When dependencies in your project have known vulnerabilities, how do you know whether you’re actually using the vulnerable part of a dependency? Use IntelliJ IDEA’s Vulnerable API Usages inspection to find out!
If you accidentally committed your code to the wrong branch, you don’t have to redo the work. IntelliJ IDEA offers a low-stress solution by allowing you to move your commit to a different branch using Git’s cherry-pick option.
As developers, we read code more than we write it. When adding new features or fixing bugs, we first need to understand existing code, so we can make the right changes in the right place.
When reading code inside the IDE, IntelliJ IDEA helps us to read and understand code by providing helpful features like syntax highlighting and inlay hints. But there are more features to help us understand a piece of code.
Formatting
We don’t read code like we do text, from start to finish. Code doesn’t run linearly! We scan code to get a feel for the shape, and to find the part we’re interested in.
IntelliJ IDEA will take care of formatting the code while we’re writing code. If we encounter code that is not properly formatted, we can have IntelliJ IDEA reformat the code for us. In the file you want to reformat, use the shortcut ⌘⌥L on macOS or Ctrl+Alt+L on Windows/Linux.
Reformat code
We can restructure the code by moving code blocks around to match our mental model, preferred style or coding conventions.
Move Statement Up and Down
Structure
There are several ways to get a quick overview of a piece of code. For example, we can collapse the code, so we only see the names of methods and not their implementation. This can help us find the specific code we are looking for more quickly. We can then expand that particular section.
Collapse and Expand code
Note that we can still search the code when it is collapsed, and if needed the relevant section will expand.
Search collapsed code
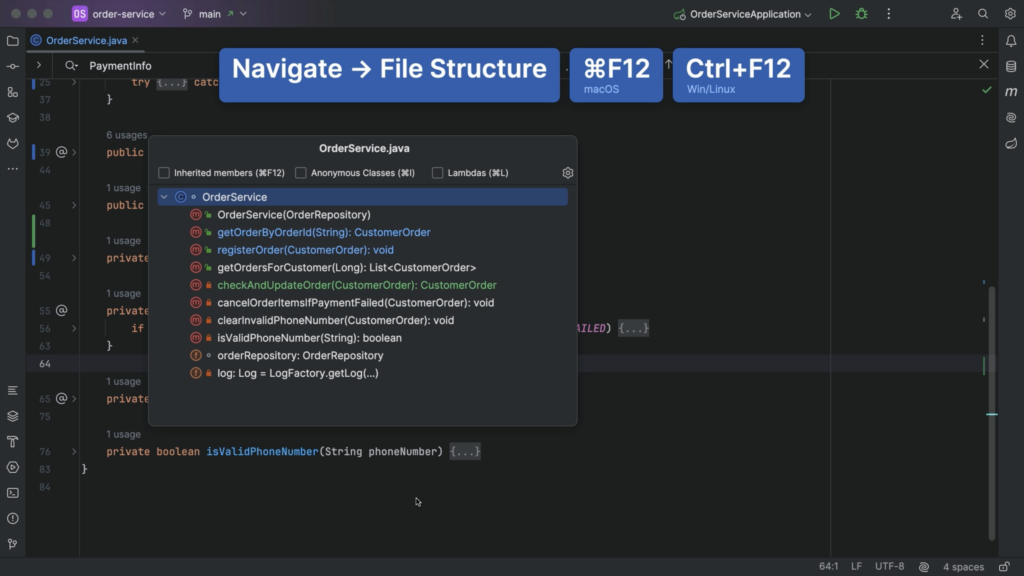
Alternatively, we can look at the File Structure for a file using ⌘ F12 on macOS or Ctrl+F12 on Windows/Linux. We can navigate to the section of the code we’re interested in from here.
File Structure
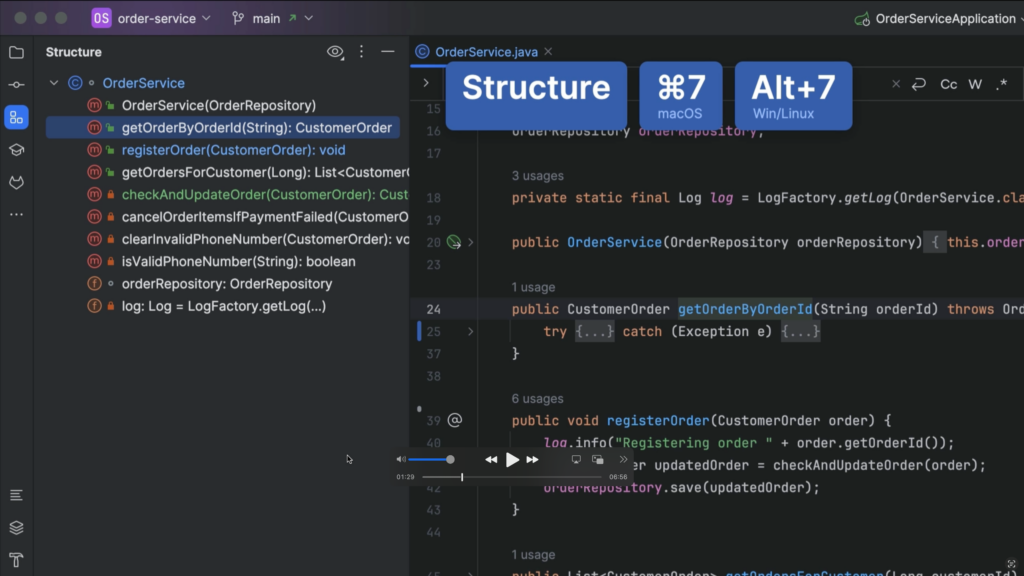
We can get the same information by opening the Structure tool window, using ⌘ 7 on macOS or Alt+7 on Windows/Linux.
Structure tool window
Searching
We can search the code for specific names of variables, methods, or Strings, for example a log message. IntelliJ IDEA will highlight the results of your search in the file.
We can also search for other occurrences from the editor. For example, we can select this variable name, and press ⌘F on macOS or Ctrl+F on Windows/Linux to search for the selected string. IntelliJ IDEA will place the selected string into the search field and highlight all occurrences in the file.
Find String in File
Additional hints: Quick Documentation & Type Information
We can also ask for additional hints from our IDE. For example, we might want more information about a particular class or method that is used in the code we are looking at, but defined elsewhere in the codebase. We can navigate to other locations in the code base, and back again, but we might end up getting lost in a large code base. Even though we can ask IntelliJ IDEA to locate a file in the project structure, jumping around too much can get overwhelming.
Select in: Project tool window
Instead, we can use Quick Documentation (F1 on macOS or Ctrl+Q on Windows/Linux) to pull up the information we need in our current location.
Quick Documentation
We can also pull up Type Information using ⌃⇧P on macOS or Ctrl+Shift+P on Windows/Linux if we’re unsure of what type is returned by a particular method.
Type Information
Reader mode
Code might contain comments that explain the code. We can toggle to reader mode in the editor using ^⌥Q (on macOS) or Ctrl+Alt+Q (on Windows/Linux). Right-click the icon in the gutter to select Render All Doc Comments if you want all comments to show in reader mode.
Toggle rendered mode
Testing and debugging
To understand intended behavior of the code, we can look at the tests in the code base. To look at the code and its tests side by side, right-click the tab and select Split and Move Right.
Split and Move Right
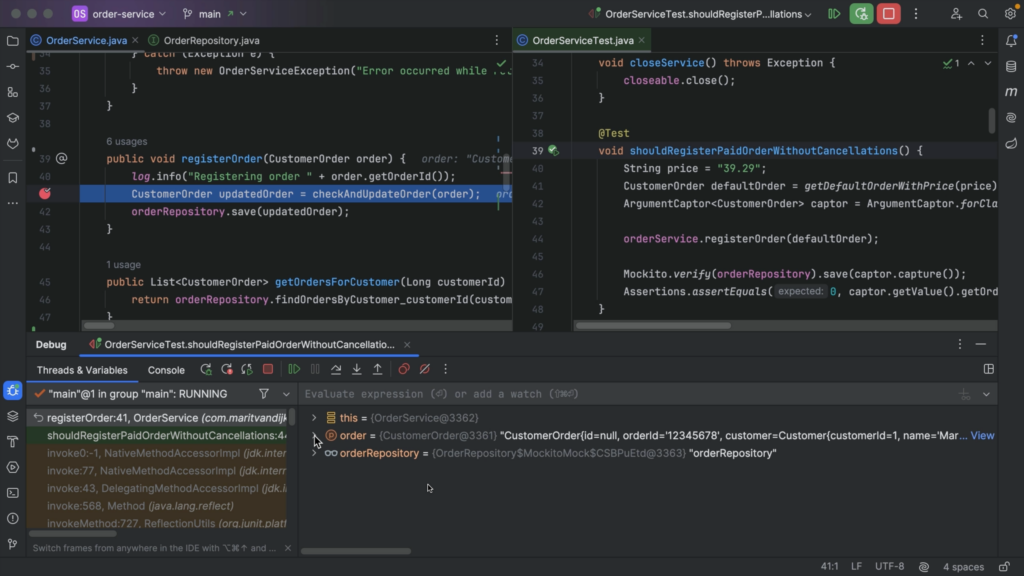
We can run a test (or our application) through the debugger to actually see how the code is executed. First, we need to place a breakpoint at the location in the code we’re interested in. Click the gutter next to the line of code where you want to place the breakpoint, or use ⌘ F8 on macOS or Ctrl+F8 on Windows/Linux to toggle the breakpoint.
Next, we run our test (or application) using the Debug option. Execution will stop at the breakpoint, so we can investigate the state of our application. Once code execution stops at the breakpoint, we can see current values of variables and objects.
We can also evaluate an expression, to see its current value and look at more details. We can even change the expressions to evaluate different results.
Evaluate Expression
We can continue execution by either stepping into (F7) a line to see what happens inside a called method or stepping over (F8) a line to go to the next line even if a method is called, depending on what we’re interested in. Finally, we can resume the program, using the shortcut ⌥⌘R on macOS or F9 on Windows/Linux, to finish the execution of the test (or continue execution of the application).
Step into, step over, resume.
If there is no test that exercises the piece of code you are interested in, you might want to add one. This can also help you verify any assumptions you might have about the code.
Refactoring for understanding
While trying to understand the code, you may want to perform small refactorings, like renaming a variable or method (using the shortcut ⇧F6 on macOS or Shift+F6 on Windows/Linux), extracting a method and giving it a meaningful name (using the shortcut ⌥⌘M on macOS or Ctrl+Alt+M on Windows/Linux), or refactor the code to a style you are more familiar with to make it easier for you to read and understand the code.
Refactor code style
Playing with the code can help you verify your assumptions and improve your understanding. Remember though, that these changes are not meant to be committed! Revert them when you’re done.
Revert changes
Version control (Git) history
We might be interested in when the code was last changed and why. We can find out by looking at the history in our version control system. If we are using Git, we can click the gutter to enable Annotate with Git Blame. Or, if you don’t like using the mouse, you can open the VCS Popup using ⌃V on macOS or Alt+` on Windows/Linux and enable or disable this option from there.
VCS Popup
In the gutter, we can now see when a line was last changed and by whom. We can hover over this information to see the commit this change was a part of and its corresponding commit message. Or we can click a line in the gutter to open the Git tool window, with the selected commit highlighted. Here, we can see the commit, its commit message and which files were changed. We can open the diff of the files to see exactly what was changed.
JetBrains AI Assistant
If you are using JetBrains AI Assistant, you can ask AI Assistant to explain the commit to you.
Explain Commit
JetBrains AI Assistant is an additional service available in IntelliJ IDEA from version 2023.3. It has several features that can help us understand our code. For example, we can ask AI Assistant to explain code, write documentation, or generate unit tests.
AI Actions
If we use the AI action Explain code without selecting any code, the entire file is selected and AI Assistant opens a chat window where it will explain the code in this file. Alternatively, we can select a specific piece of code, like a method, and perform the same action to get an explanation of that section of code.
Explain Code
We can write documentation for a class or method. Note that our cursor needs to be in the class or method for this to work. We can’t write documentation for a blank line.
Write Documentation
And of course, we can ask AI Assistant questions in the chat. For example, to explain the project.
Explain Project
Keep in mind that even if you use AI Assistant to write code for you, you’ll still need to be able to read code! You’ll need to evaluate the code provided, and understand whether that is the code you want.
Conclusion
In this tutorial we’ve looked at the many ways IntelliJ IDEA can help you read and understand code. Hopefully these tips for reading code will have you reading code like a pro.
As developers, we spend more time reading code than writing it, and this video provides tips to enhance your code-reading skills within the IntelliJ IDEA IDE. Learn how to leverage features like syntax highlighting, inlay hints, and code formatting to navigate and understand code effortlessly. Discover techniques to quickly scan code, collapse and expand sections for efficient navigation, and use powerful search functionalities to locate specific elements.
Whether you’re a beginner or an experienced developer, these tips will empower you to read and comprehend code with confidence, making your coding journey in IntelliJ IDEA a seamless and productive experience.
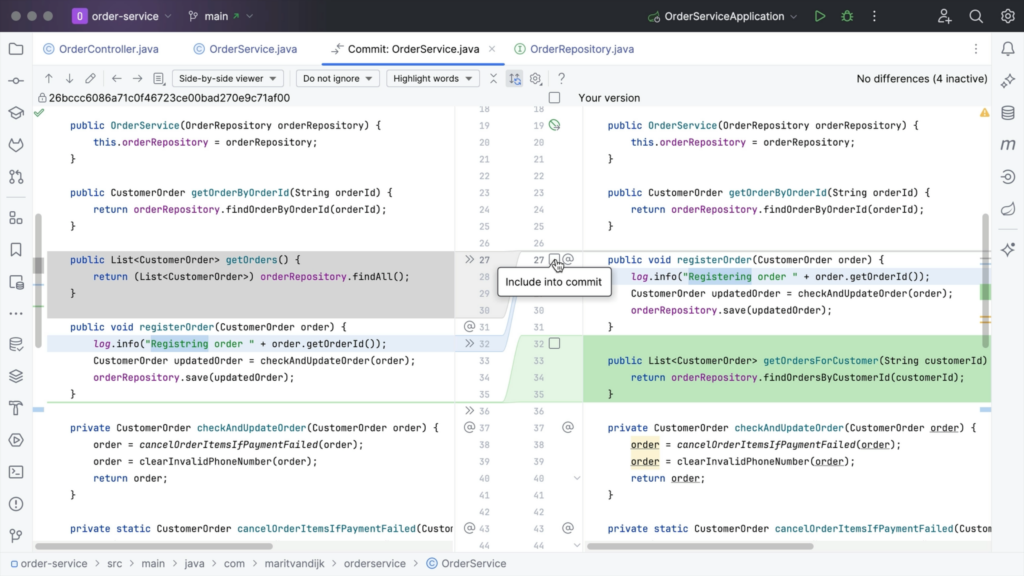
Sometimes you’re making multiple changes to a file that you don’t want to commit together. For example, if you’re working on a new feature, but notice some other small things you want to fix. If these changes are in separate files, we can commit each file separately. But what if they’re in the same file?
In IntelliJ IDEA (as of version 2023.3), we can now select which chunks and specific lines we want to add to our commit.
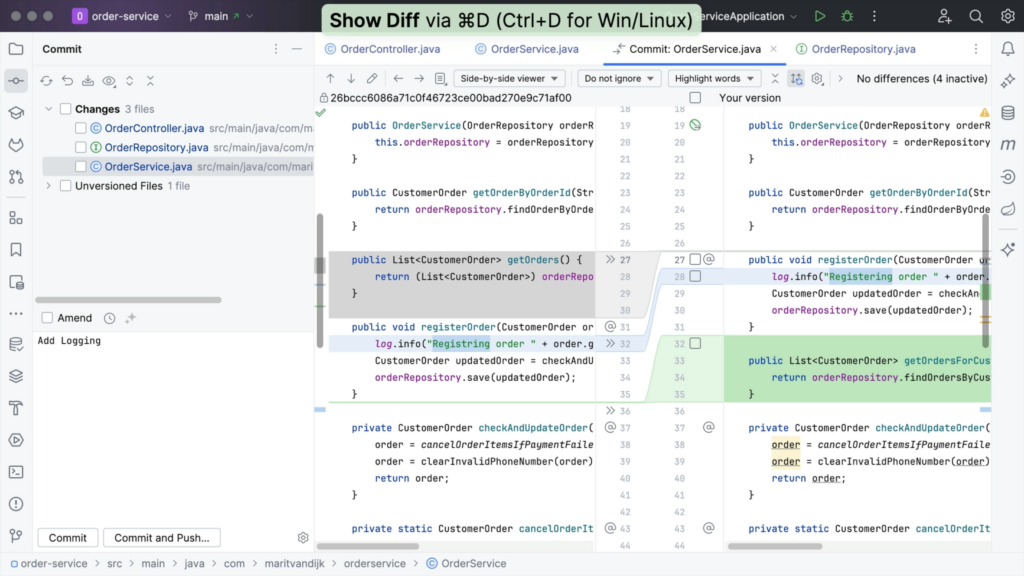
We can see which files were changed by opening the Commit tool window (⌘0 on macOS, or Alt+0 on Windows/Linux). Here we can open the diff for a particular file to see which changes were made to that file, using ⌘D (macOS) / Ctrl+D (Windows/Linux).
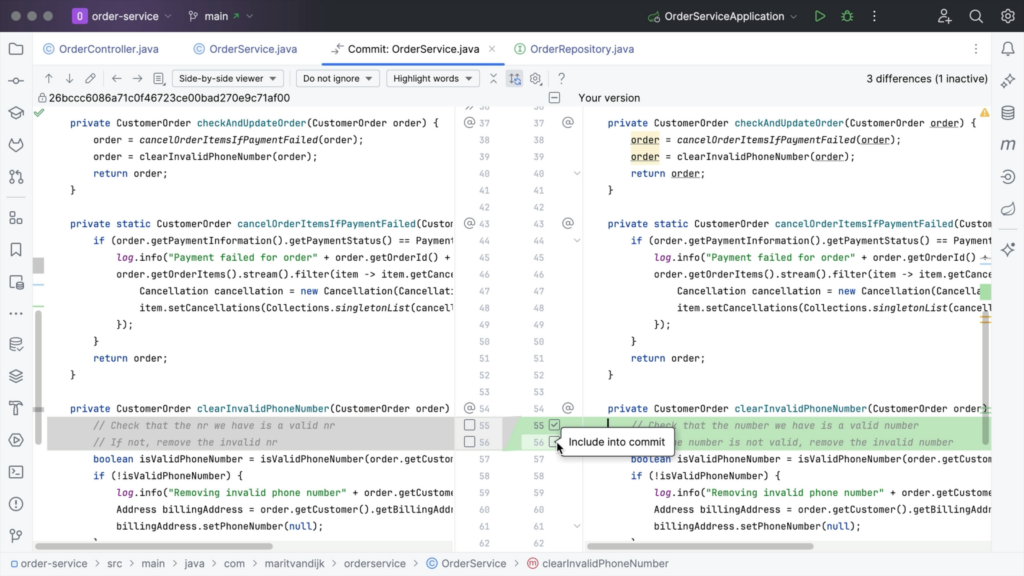
In the diff, we have the option to include specific changes to our commit, by clicking the Include into commit checkbox in the gutter next to each chunk of modified, deleted or newly added code.
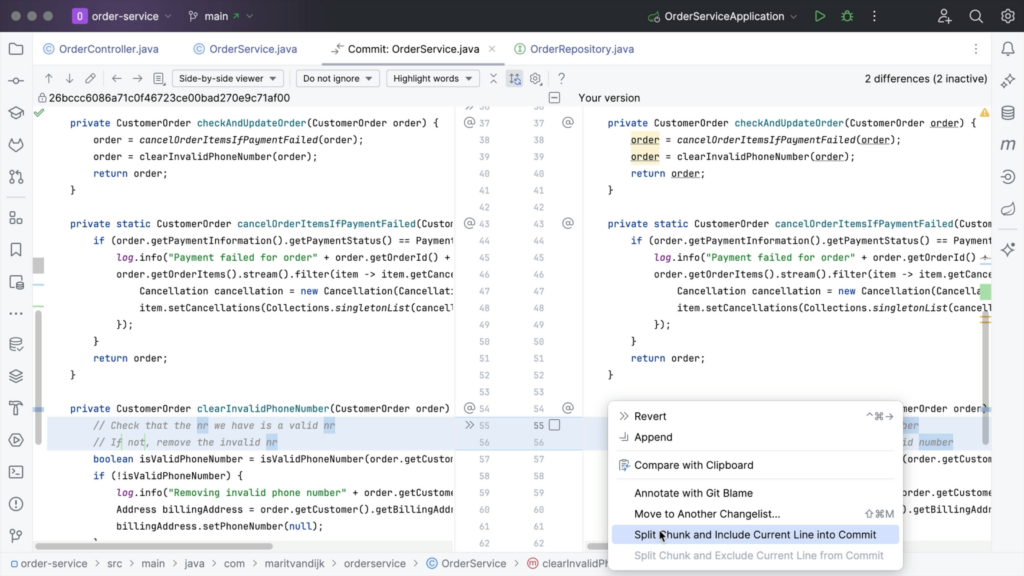
We can even select specific lines from a change to include in a commit. To commit only a specific line from a chunk, right-click the line you want to include and select Split Chunk and Include Current Line into Commit.
Alternatively, hover over the gutter and select the checkbox next to the line you want to include in the commit. Or, if we change our mind, we can also hover over the gutter and clear the checkbox next to the line we want to exclude.
Once we have selected all the changes we want to commit, we write a meaningful commit message, and select Commit. Any unselected changes will stay in the current change list, so that you can commit them separately later.
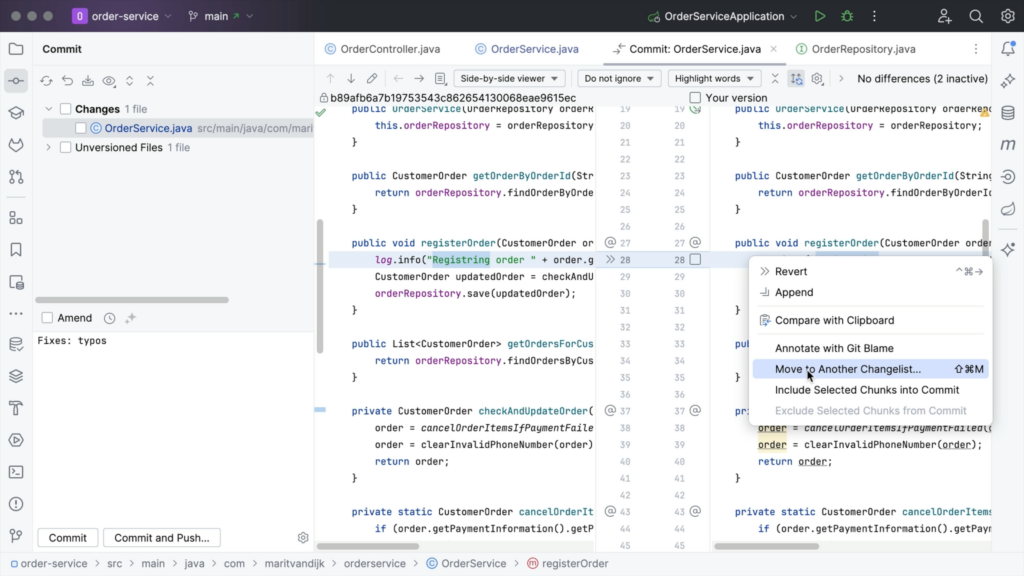
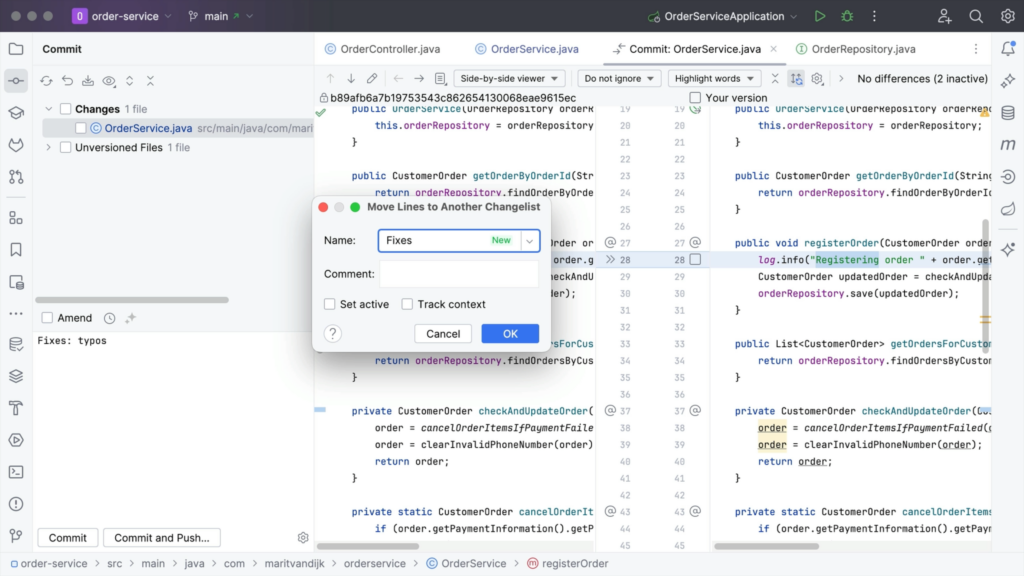
What if we don’t want to add these changes to the same pull request, not even in a separate commit? Maybe you want to do some more cleaning up in your code base, and create a separate pull request for those changes later. We can undo this commit and move these changes to a different change list. To do so, select Move to Another Changelist from the context menu of a modified chunk.
Next, we can name our new changelist. The changes will be assigned to this changelist and we can see it in the Commit tool window.
While working on a new feature, you find some small other things to fix. Since these changes are unrelated, you probably shouldn’t commit them together. You could revert these changes to redo them separately, but who wants to do extra work? Fortunately, you can now select which chunks or even lines of changes to add to your commit. You can commit the rest separately or even move it to a new change list.
In this tutorial, we’ll look at exploring project structure with IntelliJ IDEA‘s Dependency Matrix.
When working with large, complex software projects, we need to understand the dependencies between components in your projects. IntelliJ IDEA has a feature called Dependency Structure Matrix (DSM), or Dependency Matrix, that can help us with this.
When you are new to a project, the Dependency Matrix can help you get an overview of the dependencies in the project. The Dependency Matrix can also help us get an idea of how hard it will be to split a project, based on the dependencies between components. Finally, it can help us find and untangle cyclic dependencies.
It offers a matrix of the components in our project to help you and highlights the usage flow between them. Let’s take a look!
Opening the Dependency Matrix
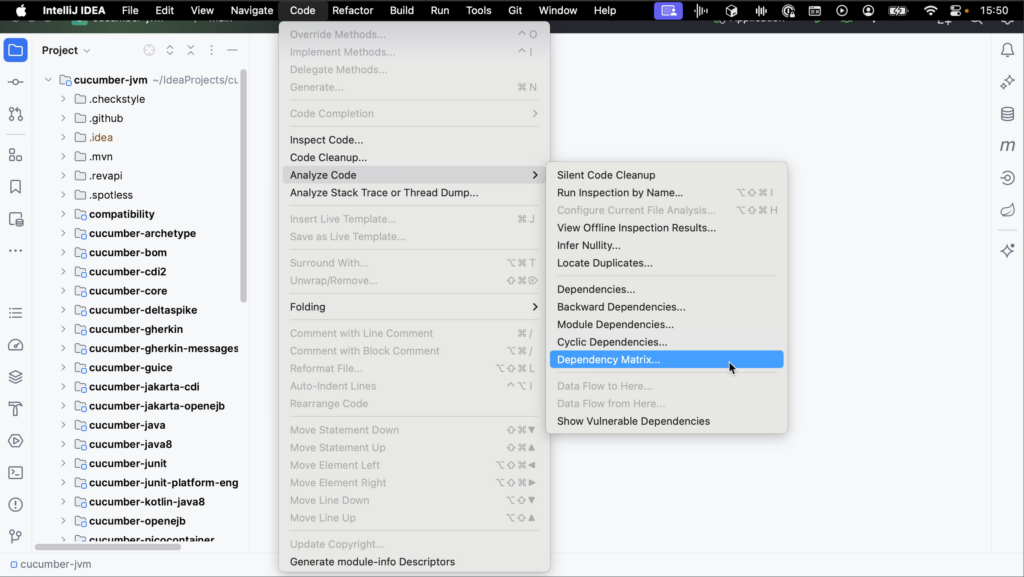
You can open the Dependency Matrix from the main menu by going to Code | Analyze Code | Dependency Matrix.
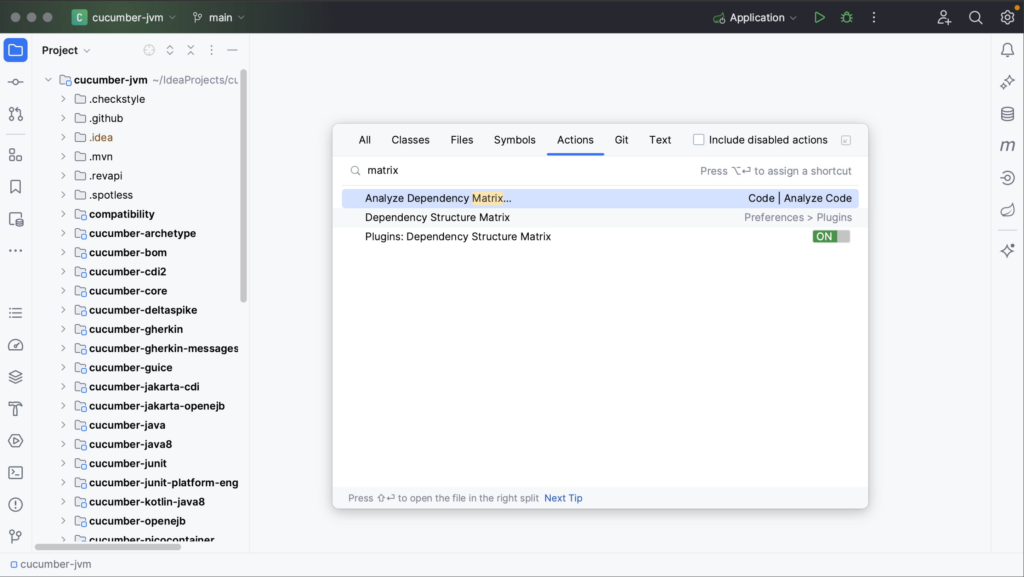
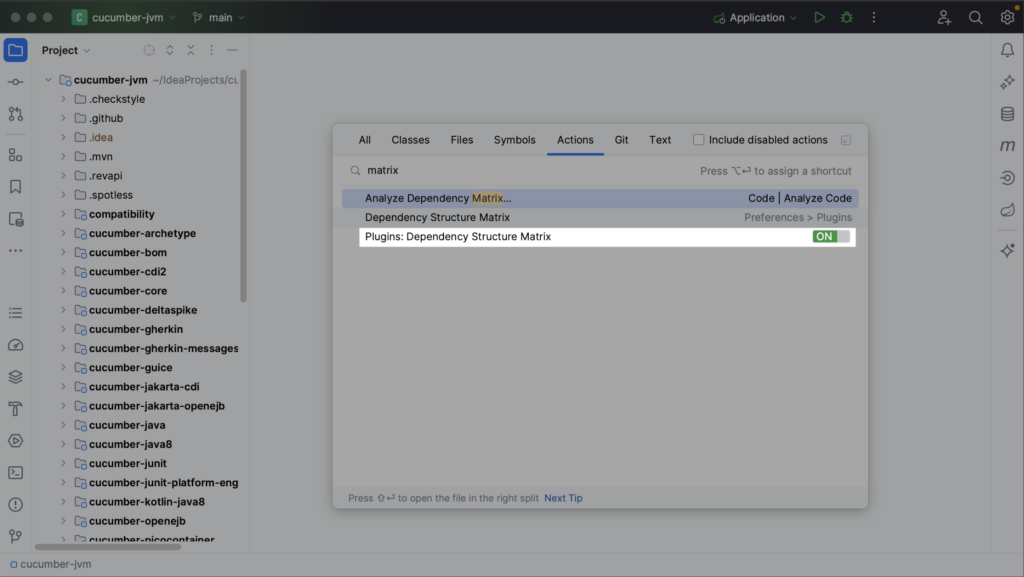
Alternatively, use Find Action (⌘⇧A on macOS, or Ctrl+Shift+A on Windows/Linux) and search for “matrix”.
To use this feature, the Dependency Matrix plugin needs to be enabled.
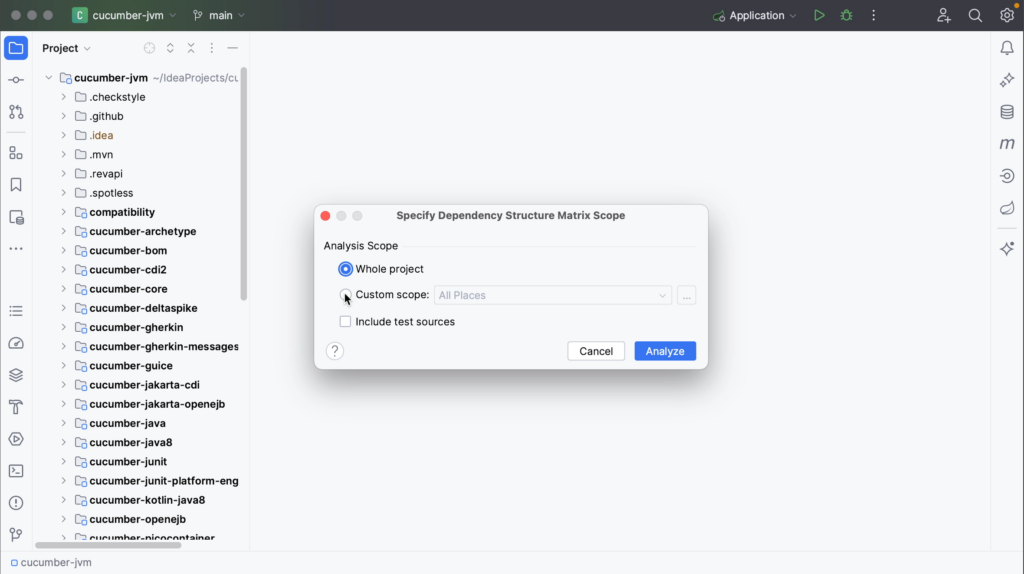
When opening the Dependency Matrix, specify the scope you want to analyze. You can select the Whole project or specify a Custom scope, and whether to include test sources or not.
After defining the scope, click Analyze.
If the project’s class files are out of date, the analysis may result in incomplete or incorrect data. To avoid this, IntelliJ IDEA will prompt you to compile the project before continuing the DSM analysis. Click Yes to build the project and make sure everything is up-to-date.
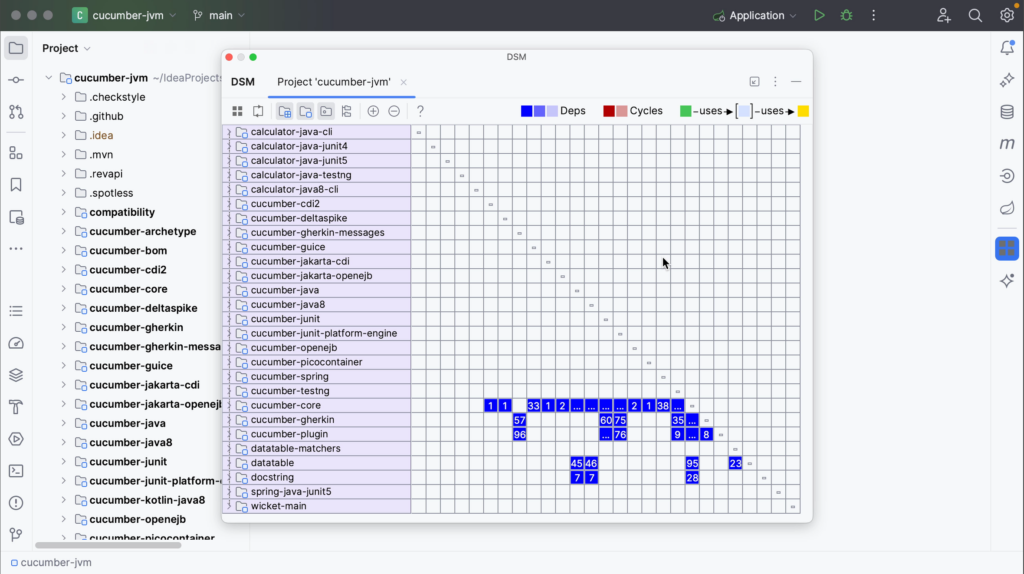
The DSM tool window will open in a popup, showing a matrix of your project’s components.
Interpreting the Dependency Matrix
Let’s take a look at how to interpret the Dependency Matrix.
The row headers represent the program structure. In this example, the matrix contains the same modules from the Project tool window as rows.
Notice that the modules are not sorted alphabetically, as they are in the Project tool window. The matrix moves the components that are used the most to the bottom. This means that the components located at the top of the matrix depend on the components below.
Since this is a matrix, the column headers are the same as the row headers. They are omitted to save space. The dashes on the diagonal correspond to self-dependencies, which are not shown.
As you can see in the legend at the top right of the DSM tool window:
dependencies are shown in blue
mutual or cyclic dependencies, meaning that two components depend on each other, are shown in red
dependencies flow from green to yellow.
Dependencies
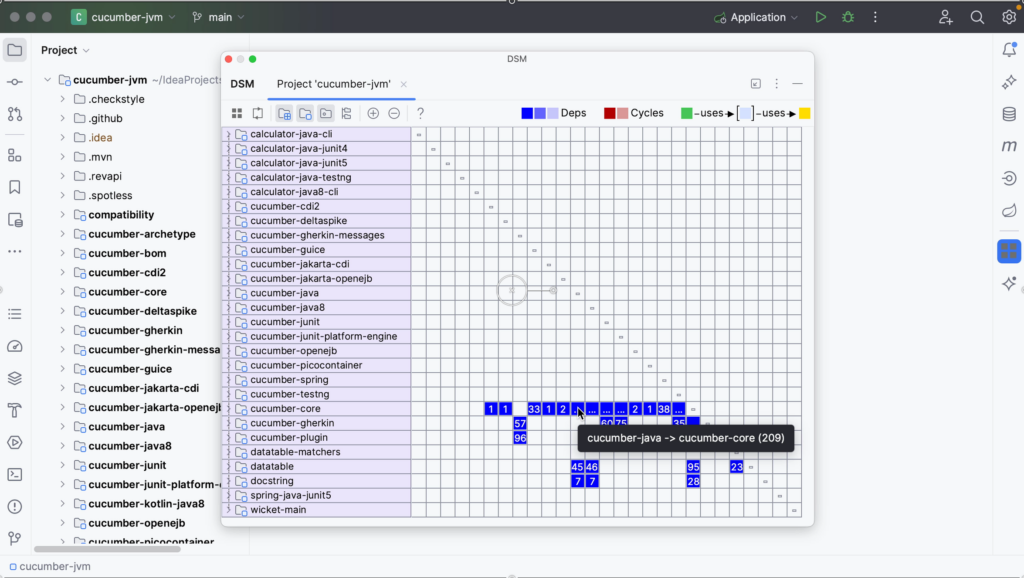
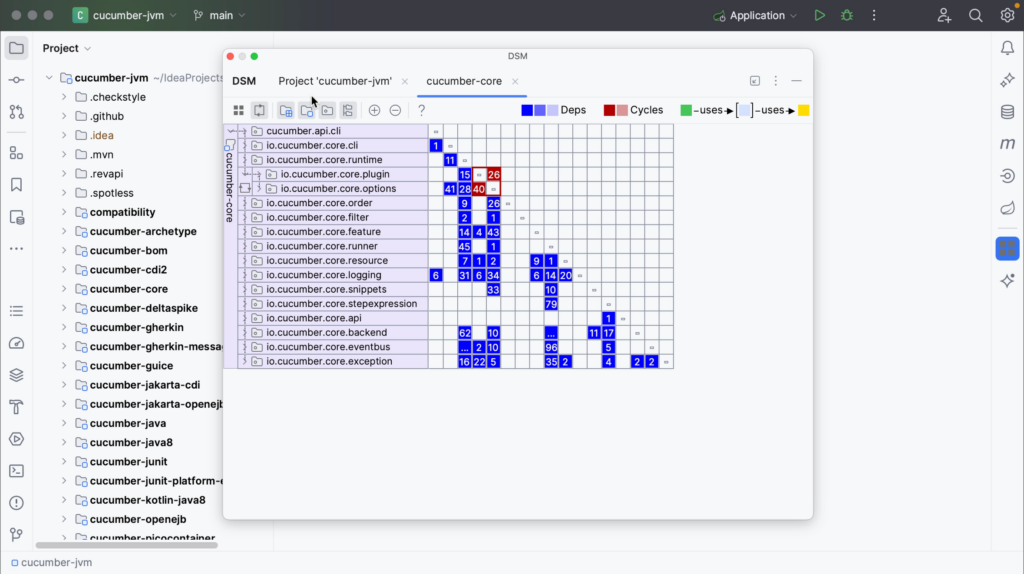
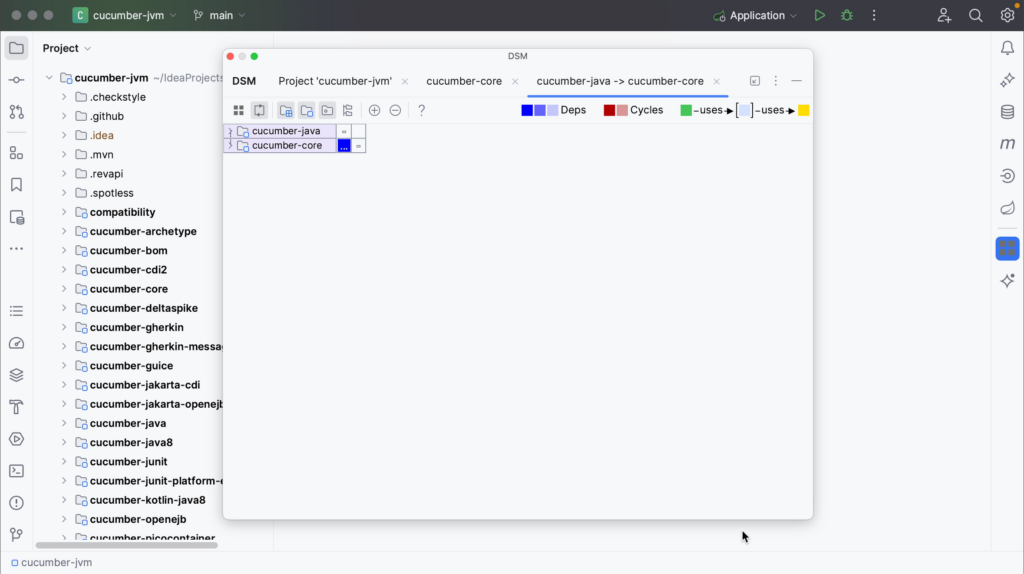
Dependencies are shown in blue. The numbers in the cells show the number of dependencies of the selected row on the selected column. An ellipsis (the three dots) in a cell means that there are more than 99 dependencies. Hover over the cell to get more information. In the example below, we see the tooltip “cucumber-java -> cucumber-core (209)”. This means that in this project the component cucumber-java (represented in the column) depends on the component cucumber-core 209 times.
You can click rows or cells to examine the relationship between the components in more detail.
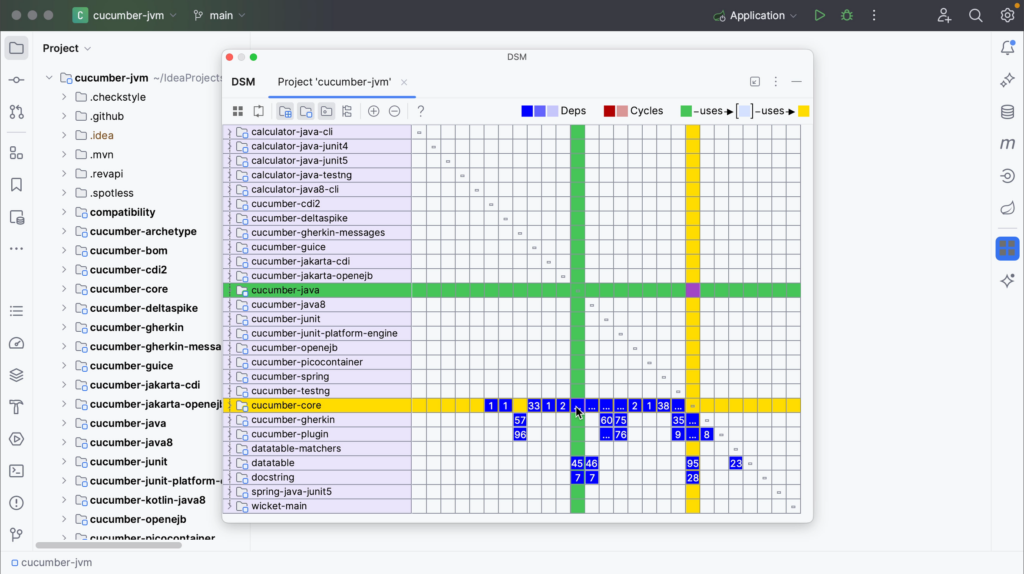
When you select a row to see the relationship between the selected component and others, the selected row and corresponding column are highlighted to visualize row dependencies.
The column shows the dependencies of the selected row.
The row shows the dependencies on the selected row.
Remember from the legend that dependencies flow from green to yellow.
In this example, the core module is selected. You can see that this module uses several other modules, marked in yellow. In turn, you see that this module is used by several modules marked in green.
You can select different rows to see which components they use or are used by. You’ll see that the components at the top mostly use the components at the bottom, while the components at the bottom are mostly used by components at the top and no longer using other components themselves.
You can drill down further into specific cells. When you click a cell, one component will be marked green and the other will be marked yellow. The green component uses the yellow component. The corresponding cell (marked purple) will show dependencies in the other direction, in this case 0.
We can drill down even further.
Expand components
Right now everything is collapsed and only the modules are shown. You can click a module to expand its packages. The module name is shown to the left, the packages are shown as rows and the dependencies between the packages are shown in the matrix inside the box marked with a black line.
You can expand the packages further to show the classes in that package, and see the dependencies between classes inside the packages. You can expand modules and packages by clicking the arrows in the rows on the left, and collapse them again.
You can also expand the modules and packages by double-clicking a cell. We can collapse everything again by using the Flatten Packages button on the top left.
Limit scope
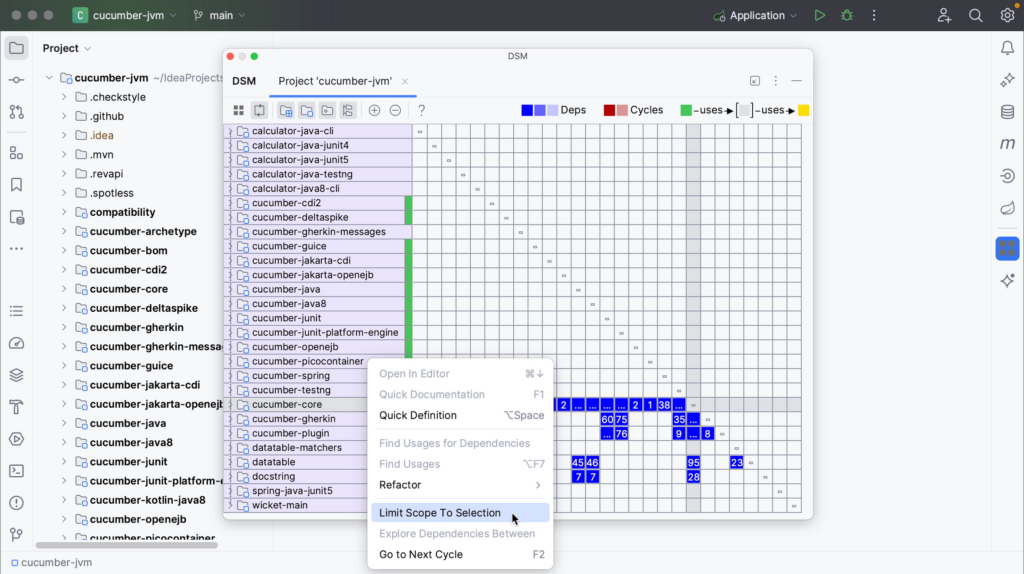
You can limit the scope of your Dependency Matrix. Right-click the row you want to look at in more detail, and from the context menu, select Limit Scope To Selection.
The limited scope will be opened in a new tab in the DSM tool window.
You can limit the view to see only selected dependencies. In the DSM tool window, right-click the cell representing the dependency you’re interested in and select Explore Dependencies Between.
The classes that produce these dependencies will be opened in a new tab in the DSM tool window. In contrast to the Limit Scope option, only classes which produce selected dependencies are left.
Another way to open the Dependency Matrix, with the option to select a specific scope, is from the Project tool window (⌘1 on macOS, or Alt+1 on Windows/Linux). Right-click an item in the Project tool window and select Analyze | Analyze Dependency Matrix.
Notice how you can now select the module or directory as scope for the Dependency Matrix, in addition to the whole project or a custom scope.
Navigate to relevant code
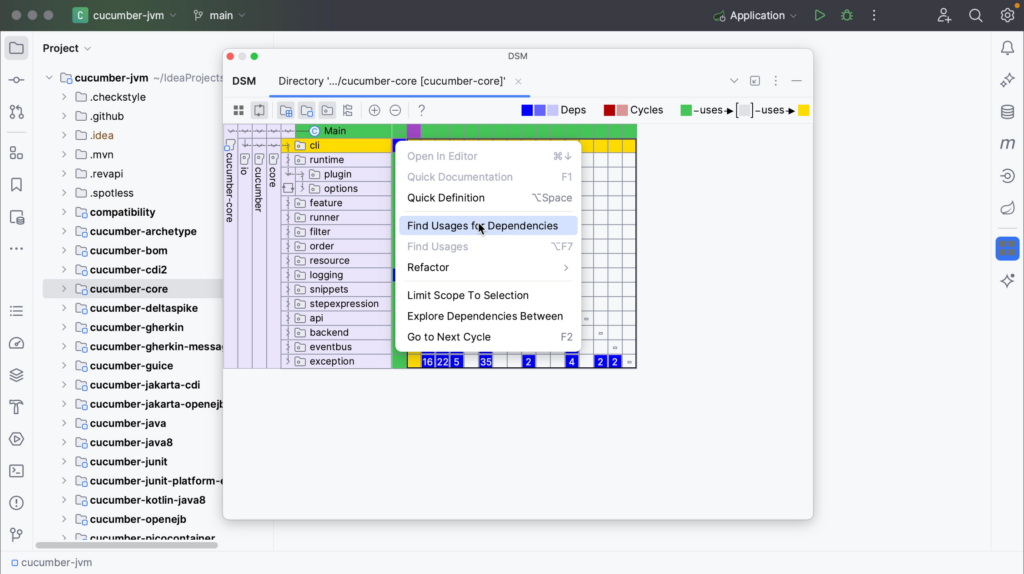
We can also navigate to the relevant code from the Dependency Matrix. To select a specific dependency for further source-code analysis, right-click the dependency you are interested in in the DSM tool window, and select Find Usages for Dependencies.
The Find tool window will open, showing the usages of the selected dependency. Close the DSM tool window to look at the results and explore the code you’re interested in. We can open the relevant code by double-clicking it in the Find tool window (⌘3 on macOS, or Alt+3 on Windows/Linux).
You can reopen the window again from the main menu by going to View | Tool Windows | DSM.
And remember that all windows can be opened from Recent Files (⌘E on macOS, or Ctrl+E on Windows/Linux) as well.
Cyclic dependencies
Remember from the legend that mutual or cyclic dependencies are shown in red. This means that two components depend on each other.
In a large application with multiple cyclic dependencies, you don’t need to expand all the nodes one by one to find all the cyclic dependencies. You can press F2 or select Go to Next Cycle from the context menu to quickly jump to the next cycle.
Summary
In this tutorial you’ve seen how the Dependency Matrix can help visualize and explore dependencies between components in your project.
IntelliJ IDEA Shortcuts Used
Here are the IntelliJ IDEA shortcuts that we used.
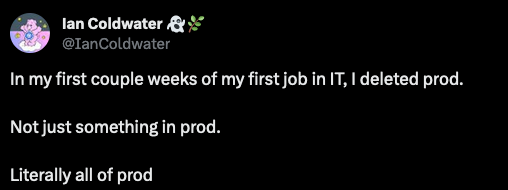
It’s a Friday, late in the afternoon. To end your work week in a clean way, you decide to get rid of some test data and files from your PC. You hit the enter button to drop a table from your local test database. Within a split second, you realize your error. Your body turns hot and cold at the same time. You double-check, but you already know the truth. You were connected to the production database and just deleted the table with all the customers…
Congratulations! You will never forget this day. It’s the day you become a real developer, and all senior developers will welcome you into their world, as they all have made a similar mistake at least once.
Database Disasters
Dropping a table or a complete database is a mistake that can happen very quickly. Another one is forgetting the WHERE part of your SQL statement. There is a big difference between DELETE FROM clients and DELETE FROM clients WHERE id = 1…
But the main mistake happens when you have multiple connections defined in your database UI and assume you are modifying the test database while having the production database open. And that’s a problem that actually should not be possible to happen, or at least not easily. Do developers need access to the production database? While it can be helpful to be able to check data directly in the live system, read-only rights are probably sufficient for most cases…
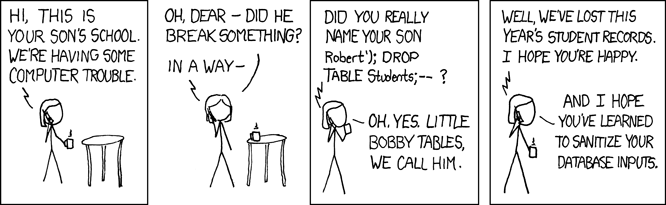
Another database disaster waiting to happen is when you forget to validate the input. SQL injection should be a well-known problem by now, but still, a lot of errors happen in this field, causing not only disasters but also security nightmares. Or, as XKCD nicely illustrates it:
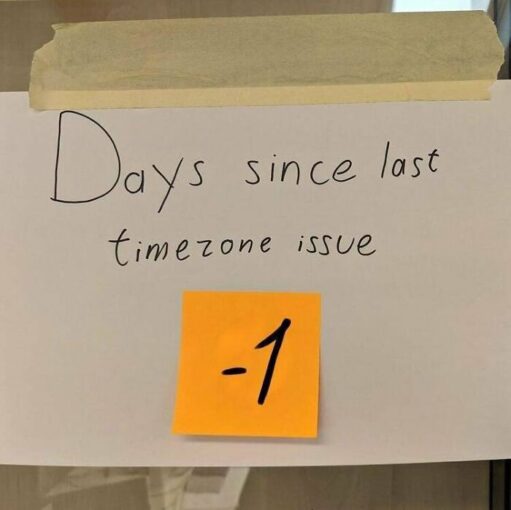
Dates and Times
Working with dates and times is the real test that distinguishes beginners from experienced developers. The defining factor is not only their ability to handle them correctly but also the number of “yes, I have seen this problem before” moments.
Before we dive into the problems, let’s summarize the most important guideline when working with dates and times in your database: store them completely, including the timezone. This is an article that goes into more details about timestamptz in PostgreSQL.
Here are some interesting situations related to dates, times, and time zones.
Young developers will probably not remember what the Y2K problem was all about, but let’s just mention here that storing a year’s value as only two numbers is a bad idea. No, the year 2000 (“00”) was not before the year 1999 (“99”). And we may be facing a similar problem in the year 2038, as I wrote in an earlier blog: “Schedule your holiday for 2038“. While writing that article, I never imagined seeing an error being caused by that Y2K38 problem already in 2023!
Frank
Of course, if your company only operates in one time zone, you might think that you will escape the problem of having to deal with time zones. And this might be true… Until you move to the cloud. Now you’ll have to deal with time zones too! And there are many reasons why dates and time zones are fertile ground for great conference talks and famous blog posts.
Marit
Computer System Breakdowns
But be aware, we can not only make mistakes in our code and database! Our whole computer infrastructure is prone to errors!
Many years ago, I was working on my first big multimedia project for a light fixtures manufacturer to bring their expensive thick catalogs to CD-ROM (for young people, a blinking disk that could contain a whopping 640 MB of data…). We had a strict deadline and had a first working version after three weeks of hard work. But then disaster struck! The hard disk of my fancy blue iMac broke.
After many hours of investigation, I ended up with four conclusions:
The backup tapes on our server that ran daily to ensure we would never lose any work contained not a single file!
It would take weeks and a lot of money to send the hard disk to a data recovery company without any guarantee to be able to recover anything.
Backups must be checked regularly and you must try from time to time if you can recover a deleted file to make sure both the backup and restore process work OK.
I had to start my work again from scratch…
Another lesson I learned from that disaster: weeks of work on a project that you have never done before can be repeated in a few days as you learned a lot during those weeks, and now know how to do things. And in the end, it even gets a cleaner and better result!
Another system disaster: never, never, NEVER, type the command rm -rf /. The remove command parameter f removes all prompts, so you let it go ahead without asking for any confirmations. The r lets the remove command work recursively, meaning it will go through all nested directories. Combine this with /, being the very root of your hard disk, and you are heading towards a total nightmare…
Frank
Testing Mistakes
In the same category of testing versus production databases: mailing lists! The number of stories of test emails reaching thousands of clients is incredibly long.It’s still amazing how many times one still receives an email with all recipients in the TO field. Any programmed emailing system should generate a single mail per person. And if you really, really need to send to multiple persons with one message, the BCC field is your only friend!Another well-known example is sending test messages in production, like the time Airbnb sent test notifications to users around the world or an intern at HBO Max sent an integration test email to subscribers.
I can remember a story, in the early days of the internet, when networks were not that fast, and servers were smaller. Most companies had their own internal email server. But when someone mailed a big PDF report or other file to everyone at the company, the complete system could crash. Suddenly too much storage was needed, and a ping-pong of email error replies, led to a total breakdown of the server.
Frank
Similarly, I remember several situations where we’ve had to (re)upload batches of data and somehow miscalculated the size and processing time, leading to queues being full and data processing to be severely delayed.
Marit
Conclusions
While some of the mistakes mentioned here are honest mistakes made by developers, some of the bad events described here actually reveal a problem within the organization. Do developers need unrestricted access to the production database? Why are they able to access the entire production mailing list for a test? Some data (especially personal data) should be behind heavily closed doors with minimal access. But in many companies, all this data is widely accessible to the whole developer team (or worse). If this is not guarded by the organization, developers should always be professional and handle data with care.
In addition, tooling should be used in such a way as to make mistakes like these harder. For example, environments should be clearly marked so it’s easy to see whether you are working on a test environment or the production environment. In some cases, additional steps have to be taken in order to get access to a production environment. Evaluate potential risks in your organization and act accordingly.
But as much as you try to avoid them, mistakes do happen. In the end, it’s essential to keep in mind that people will mostly remember how you reacted to a disaster. After the initial adrenaline spike has settled down, grab a cup of coffee, cancel your plans for the following days, and fix the problem. Everything will be OK soon. Afterward, you will wear the badge of “Senior Developer” with pride…
When working with large, complex software projects, we need to understand the dependencies between components in your projects.
IntelliJ IDEA’s Dependency Structure Matrix (DSM), or Dependency Matrix, that can help us with this! Let’s take a look at how to use the Dependency Structure Matrix to see dependencies between different components, like modules, packages, and classes. See how to identify dependencies, find cyclic or mutual dependencies, and visualize the flow of dependencies to see which components use or depend on other components and vice versa.
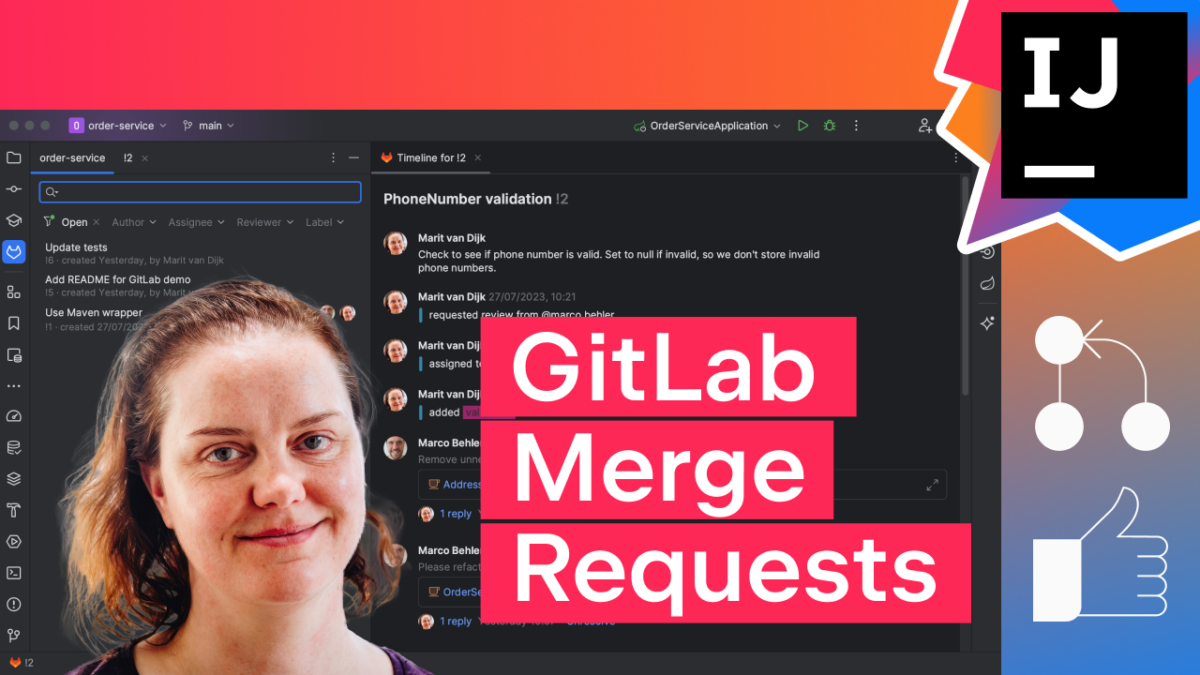
In this tutorial, we will take a look at working with GitLab Merge Requests inside IntelliJ IDEA.
When reviewing Merge Requests in a web interface, we don’t have the same support that our IDE gives us, like syntax highlighting and the context within which the code was written.
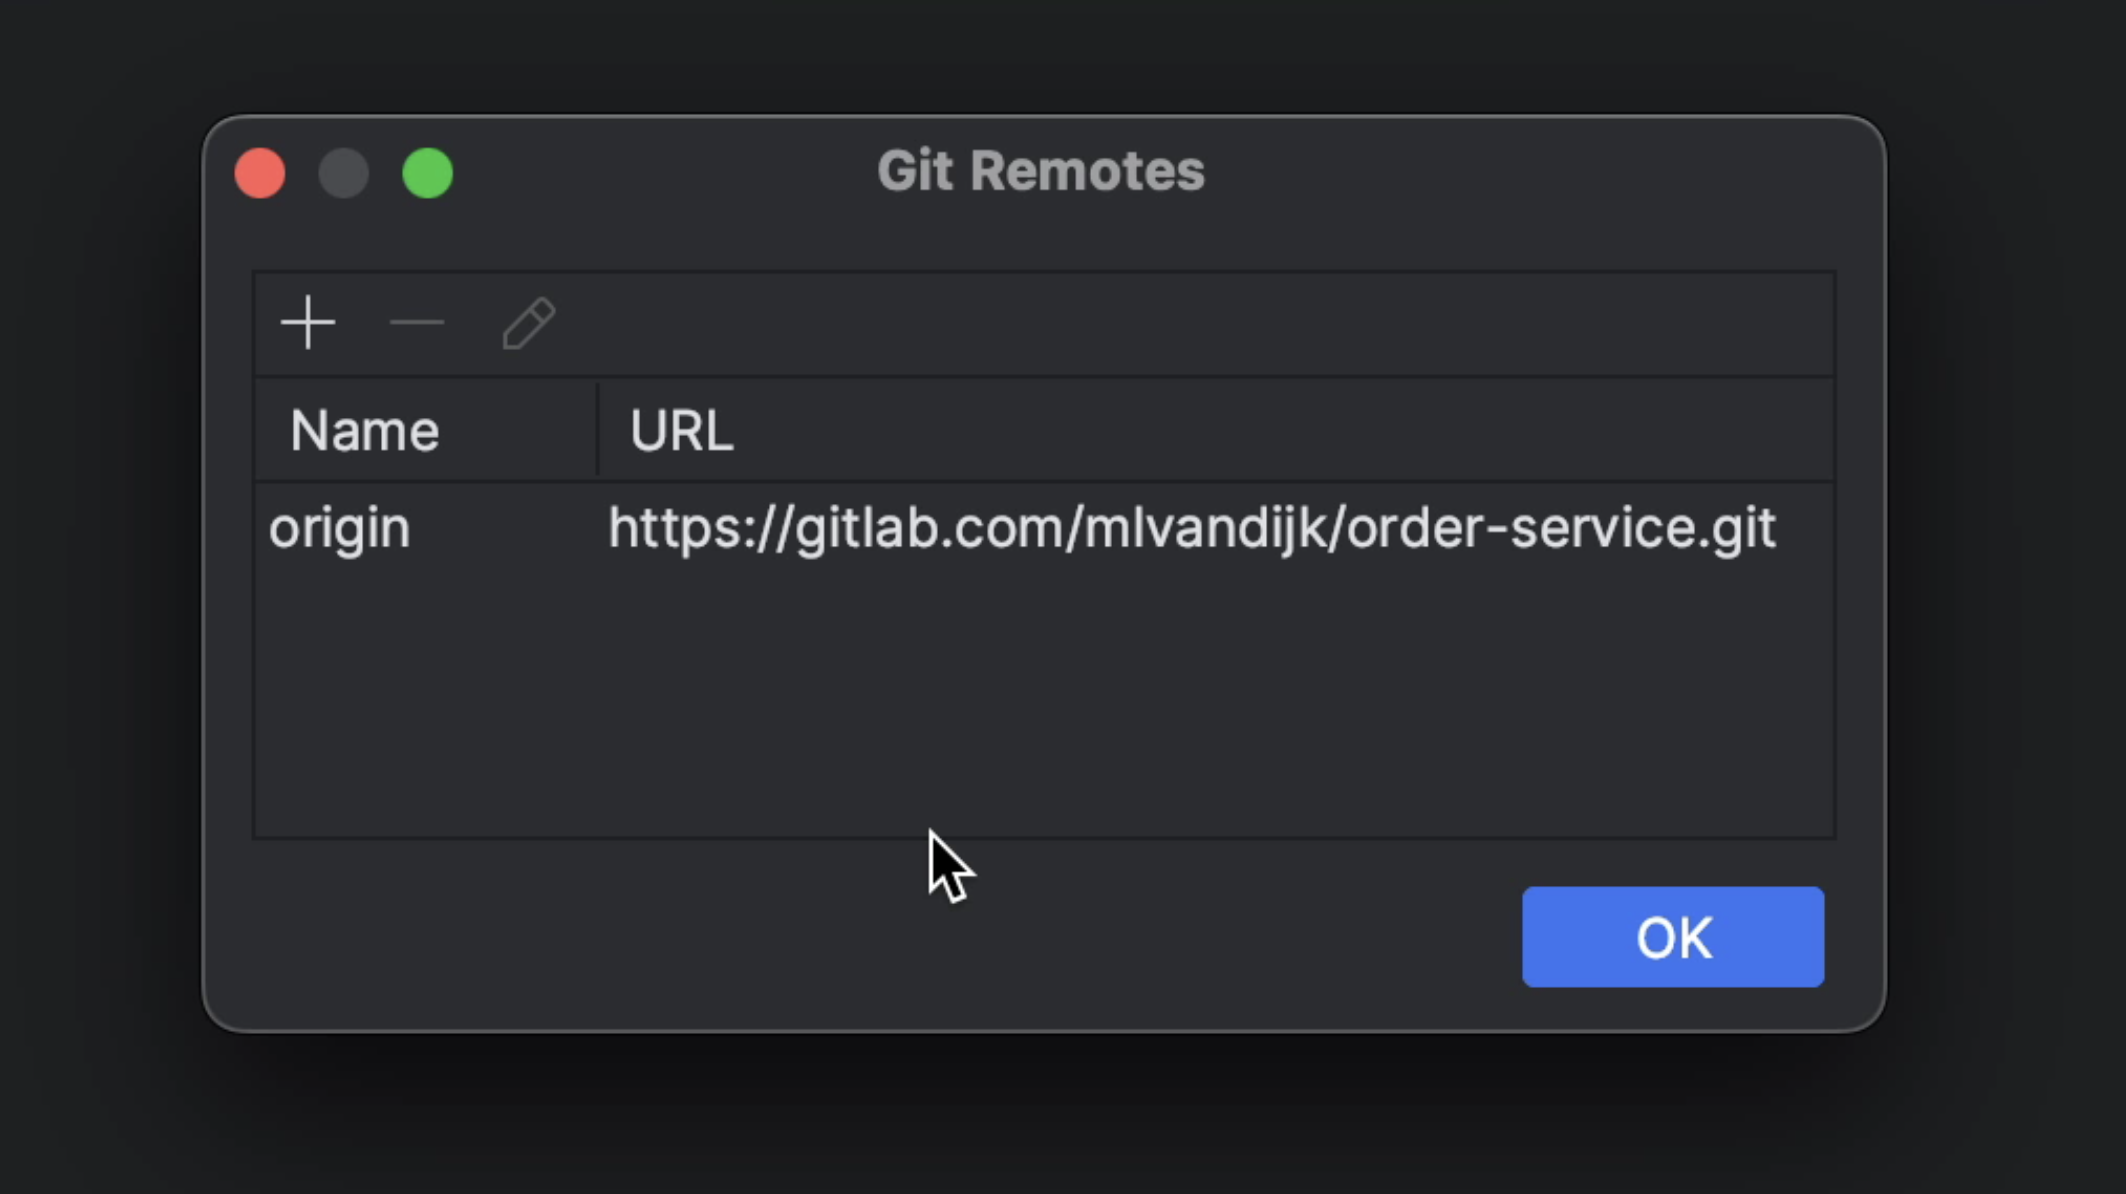
IntelliJ IDEA has support for reviewing and merging GitLab Merge Requests. These features are available if the IntelliJ IDEA project has a remote that points to GitLab.
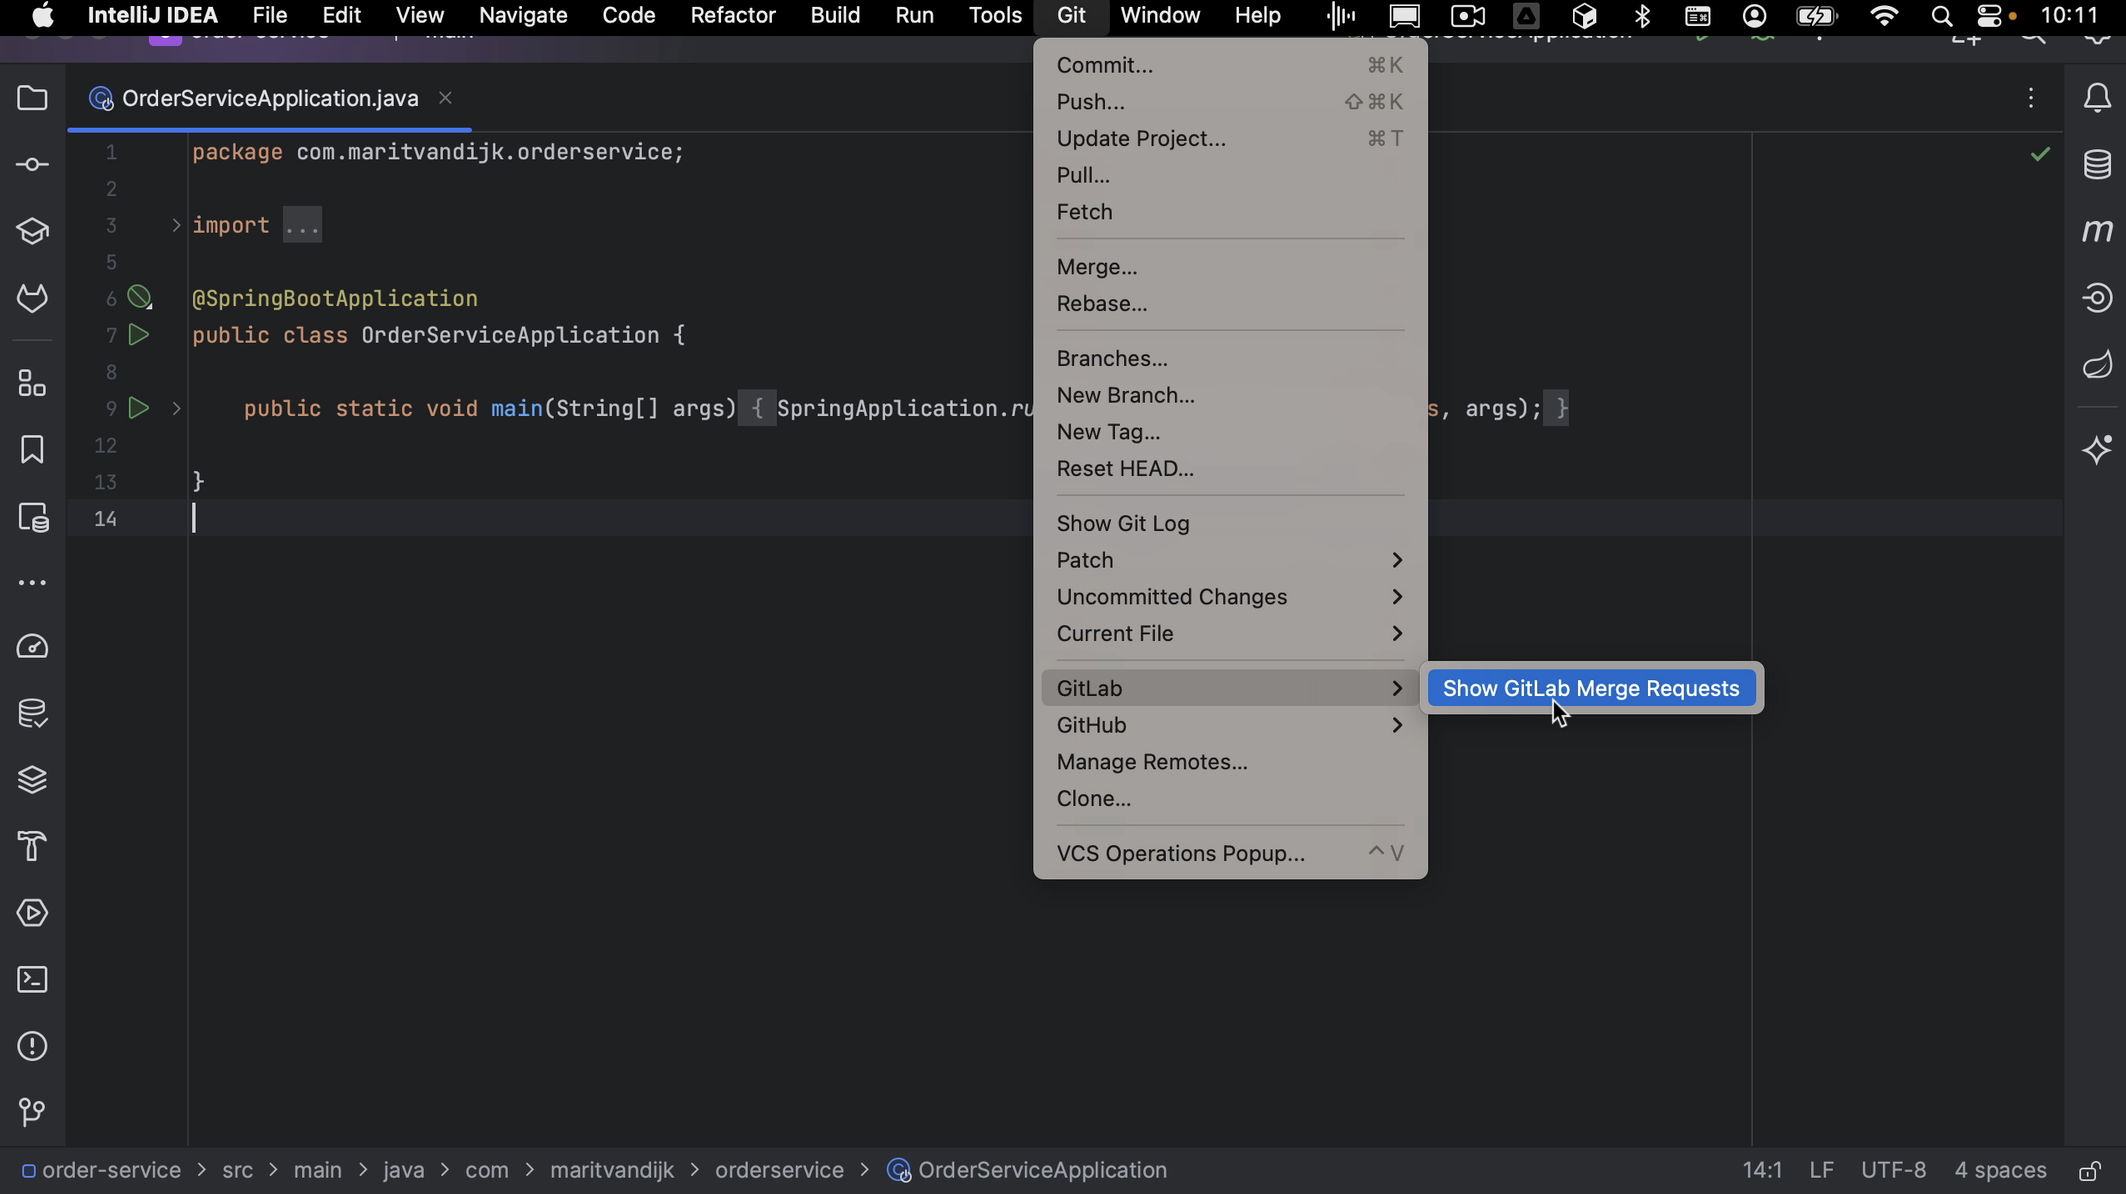
We can open the GitLab Merge Requests using the GitLab logo on the left, or from the menu by going to Git > Gitlab > Show Gitlab Merge Request.
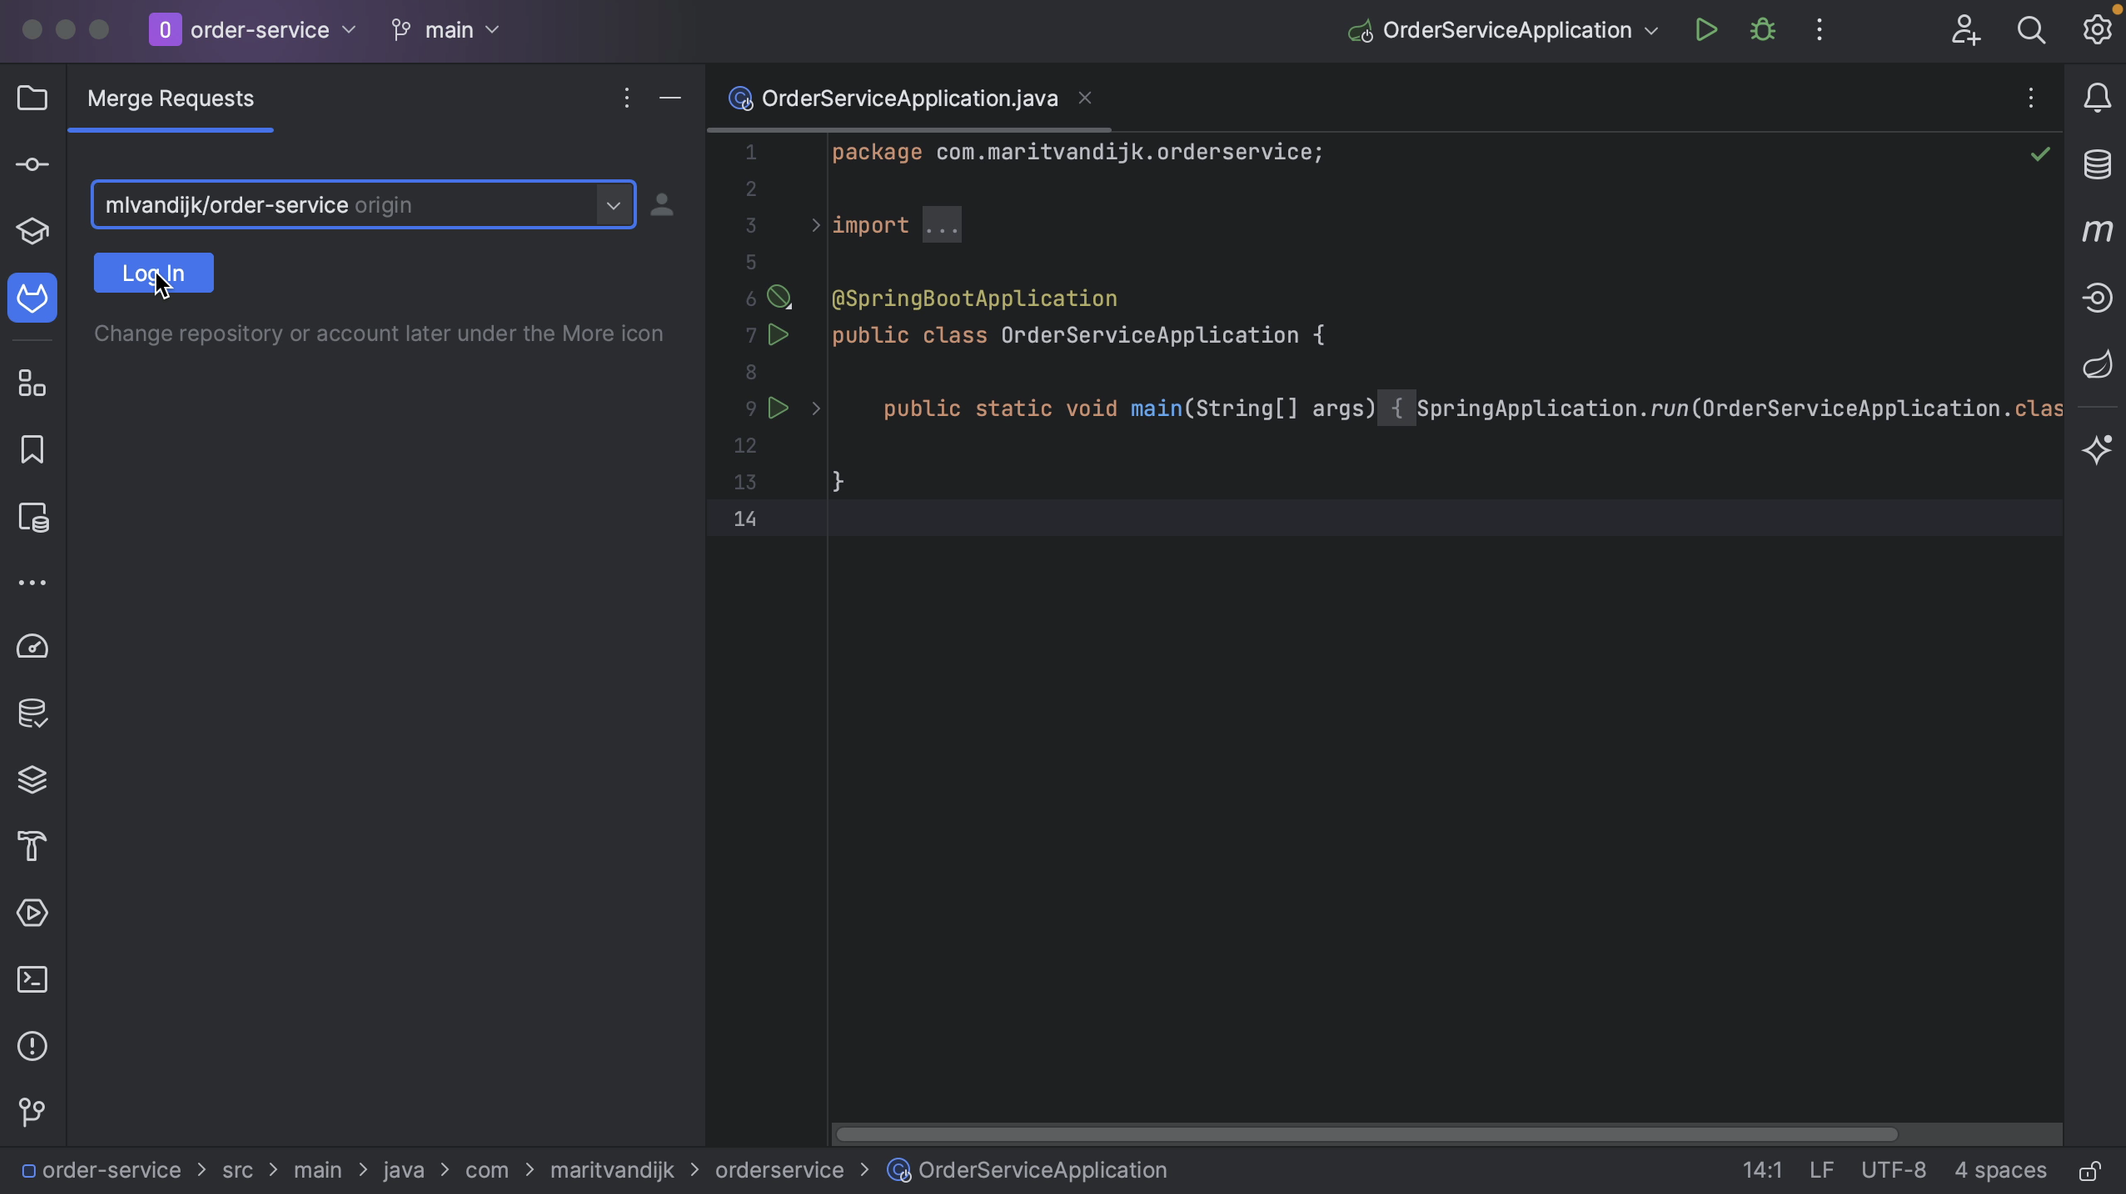
Logging in to GitLab from IntelliJ IDEA
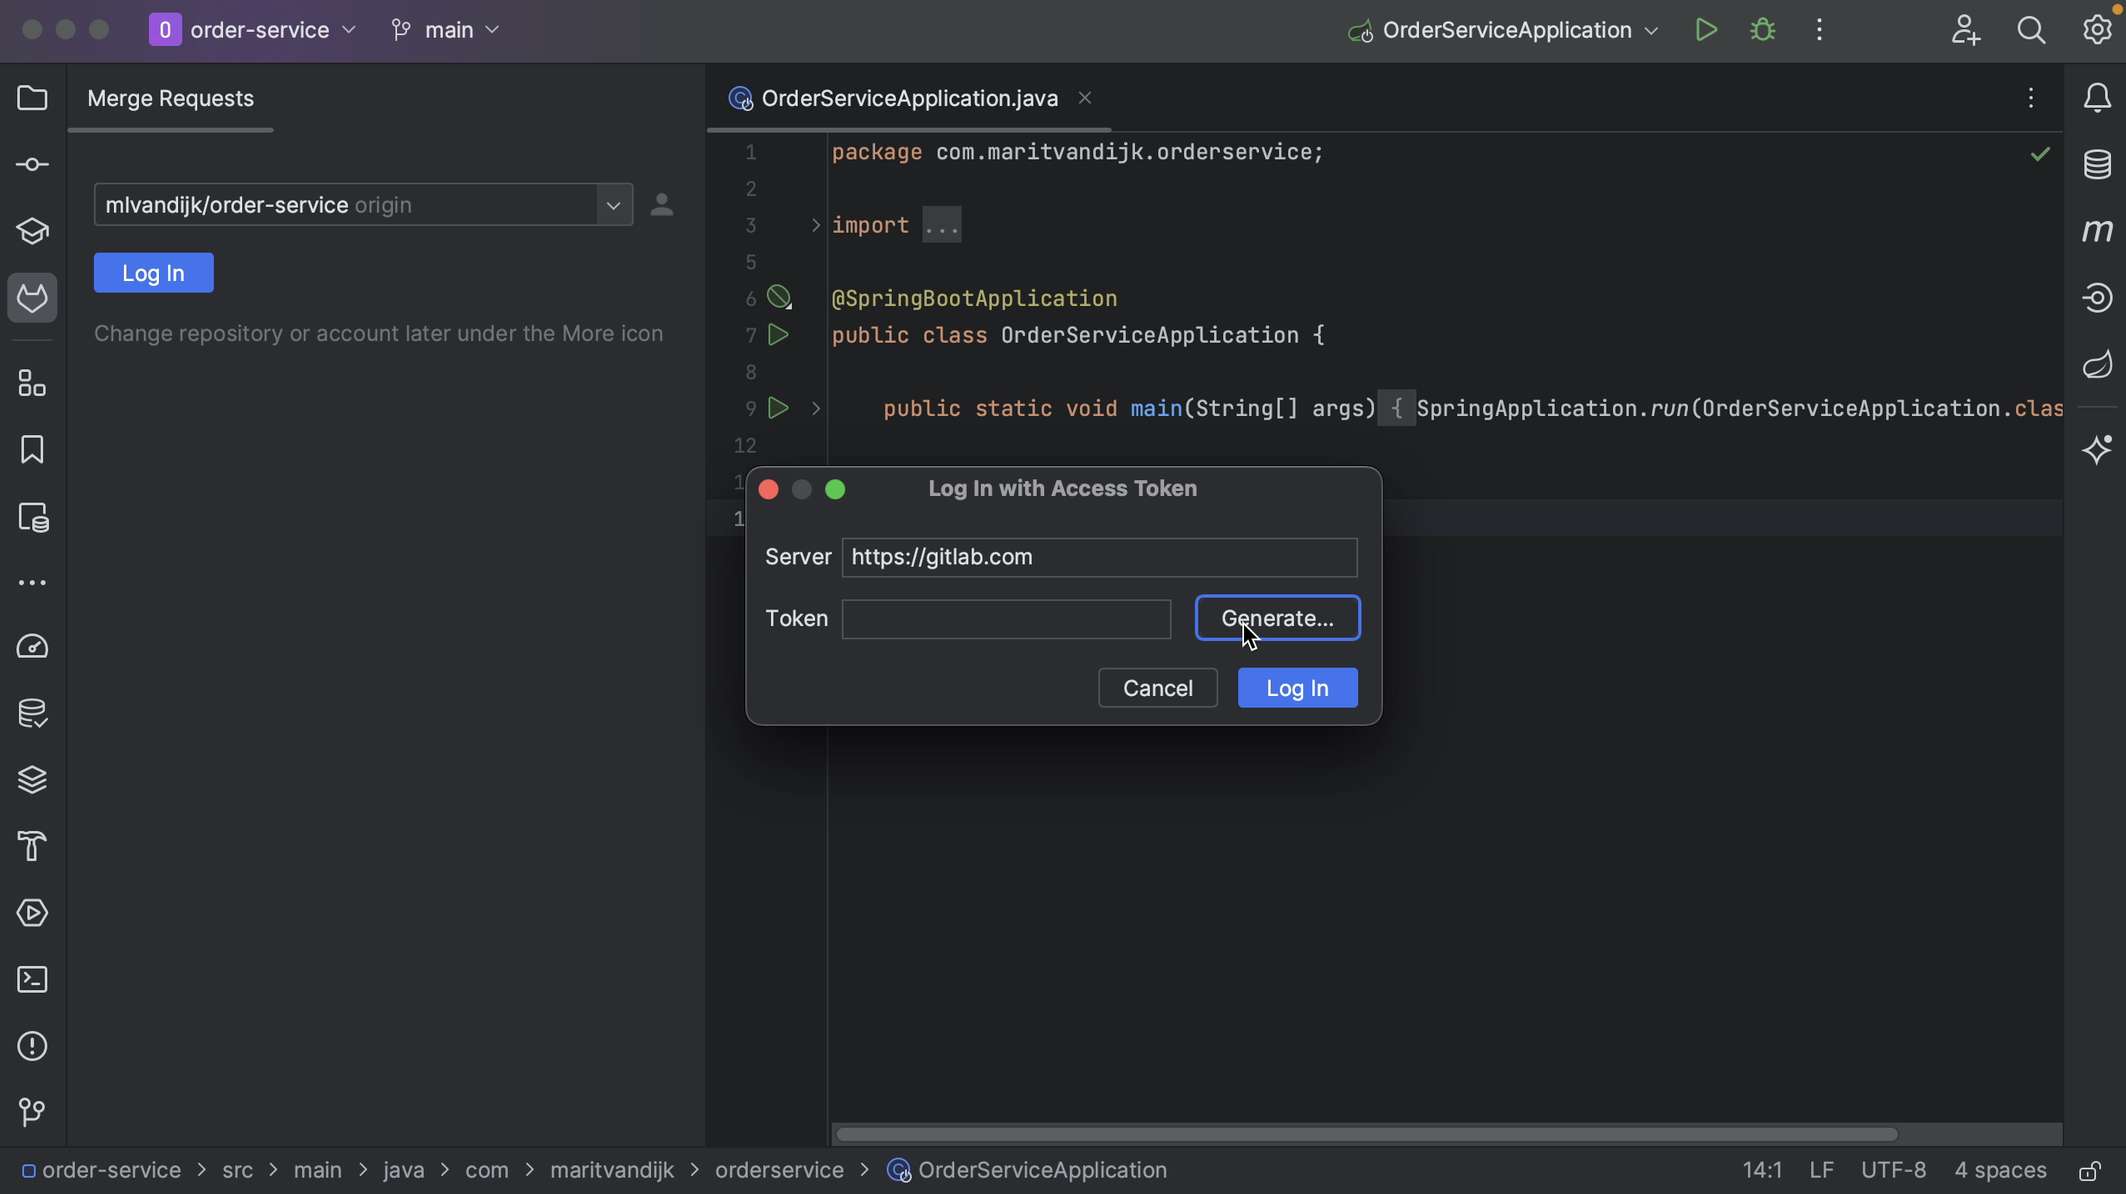
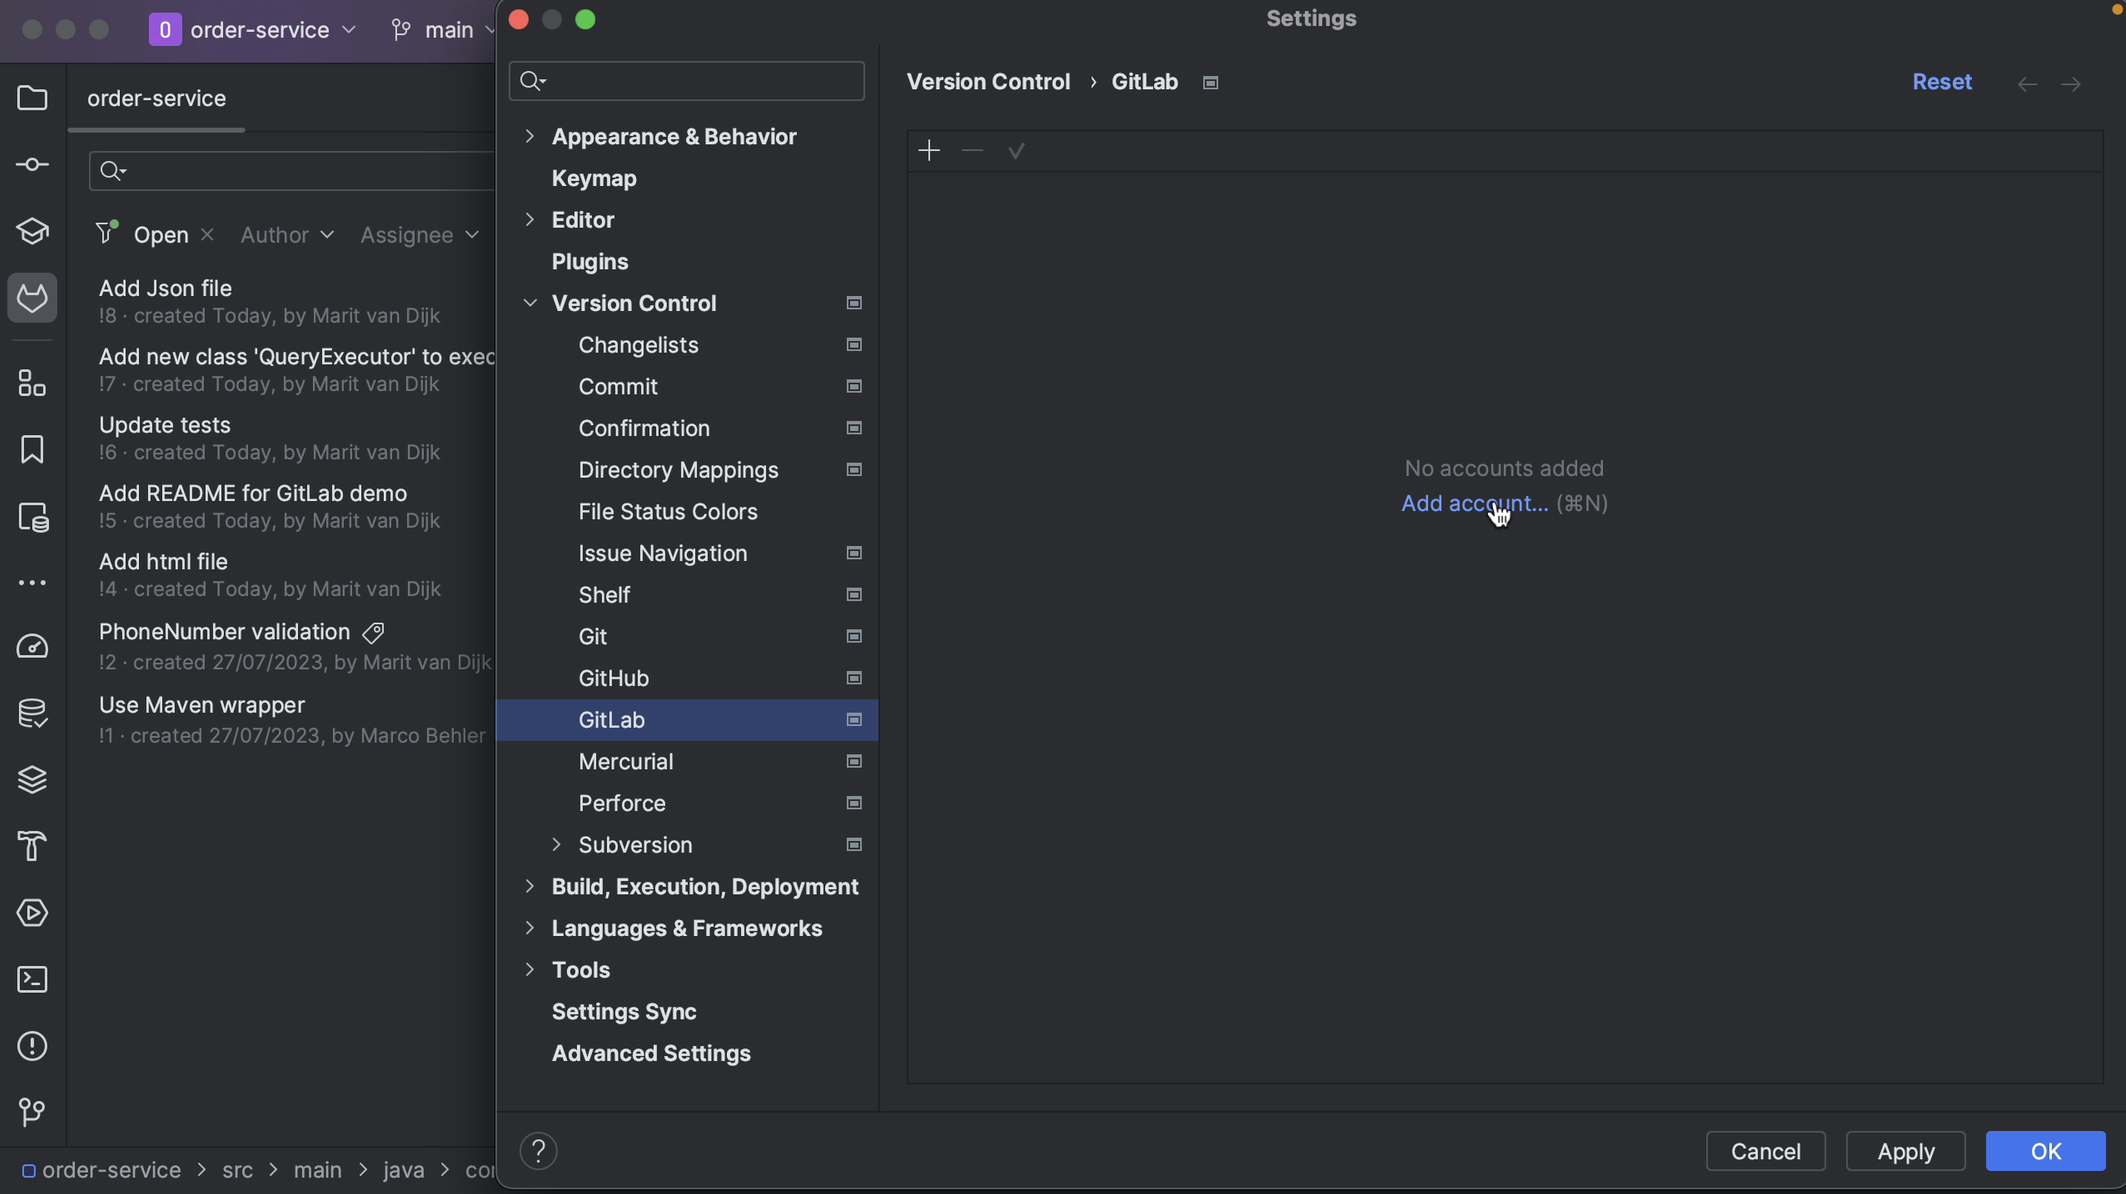
If we aren’t already logged in to GitLab via IntelliJ IDEA, the GitLab Merge Requests tool window will prompt us to Log In.
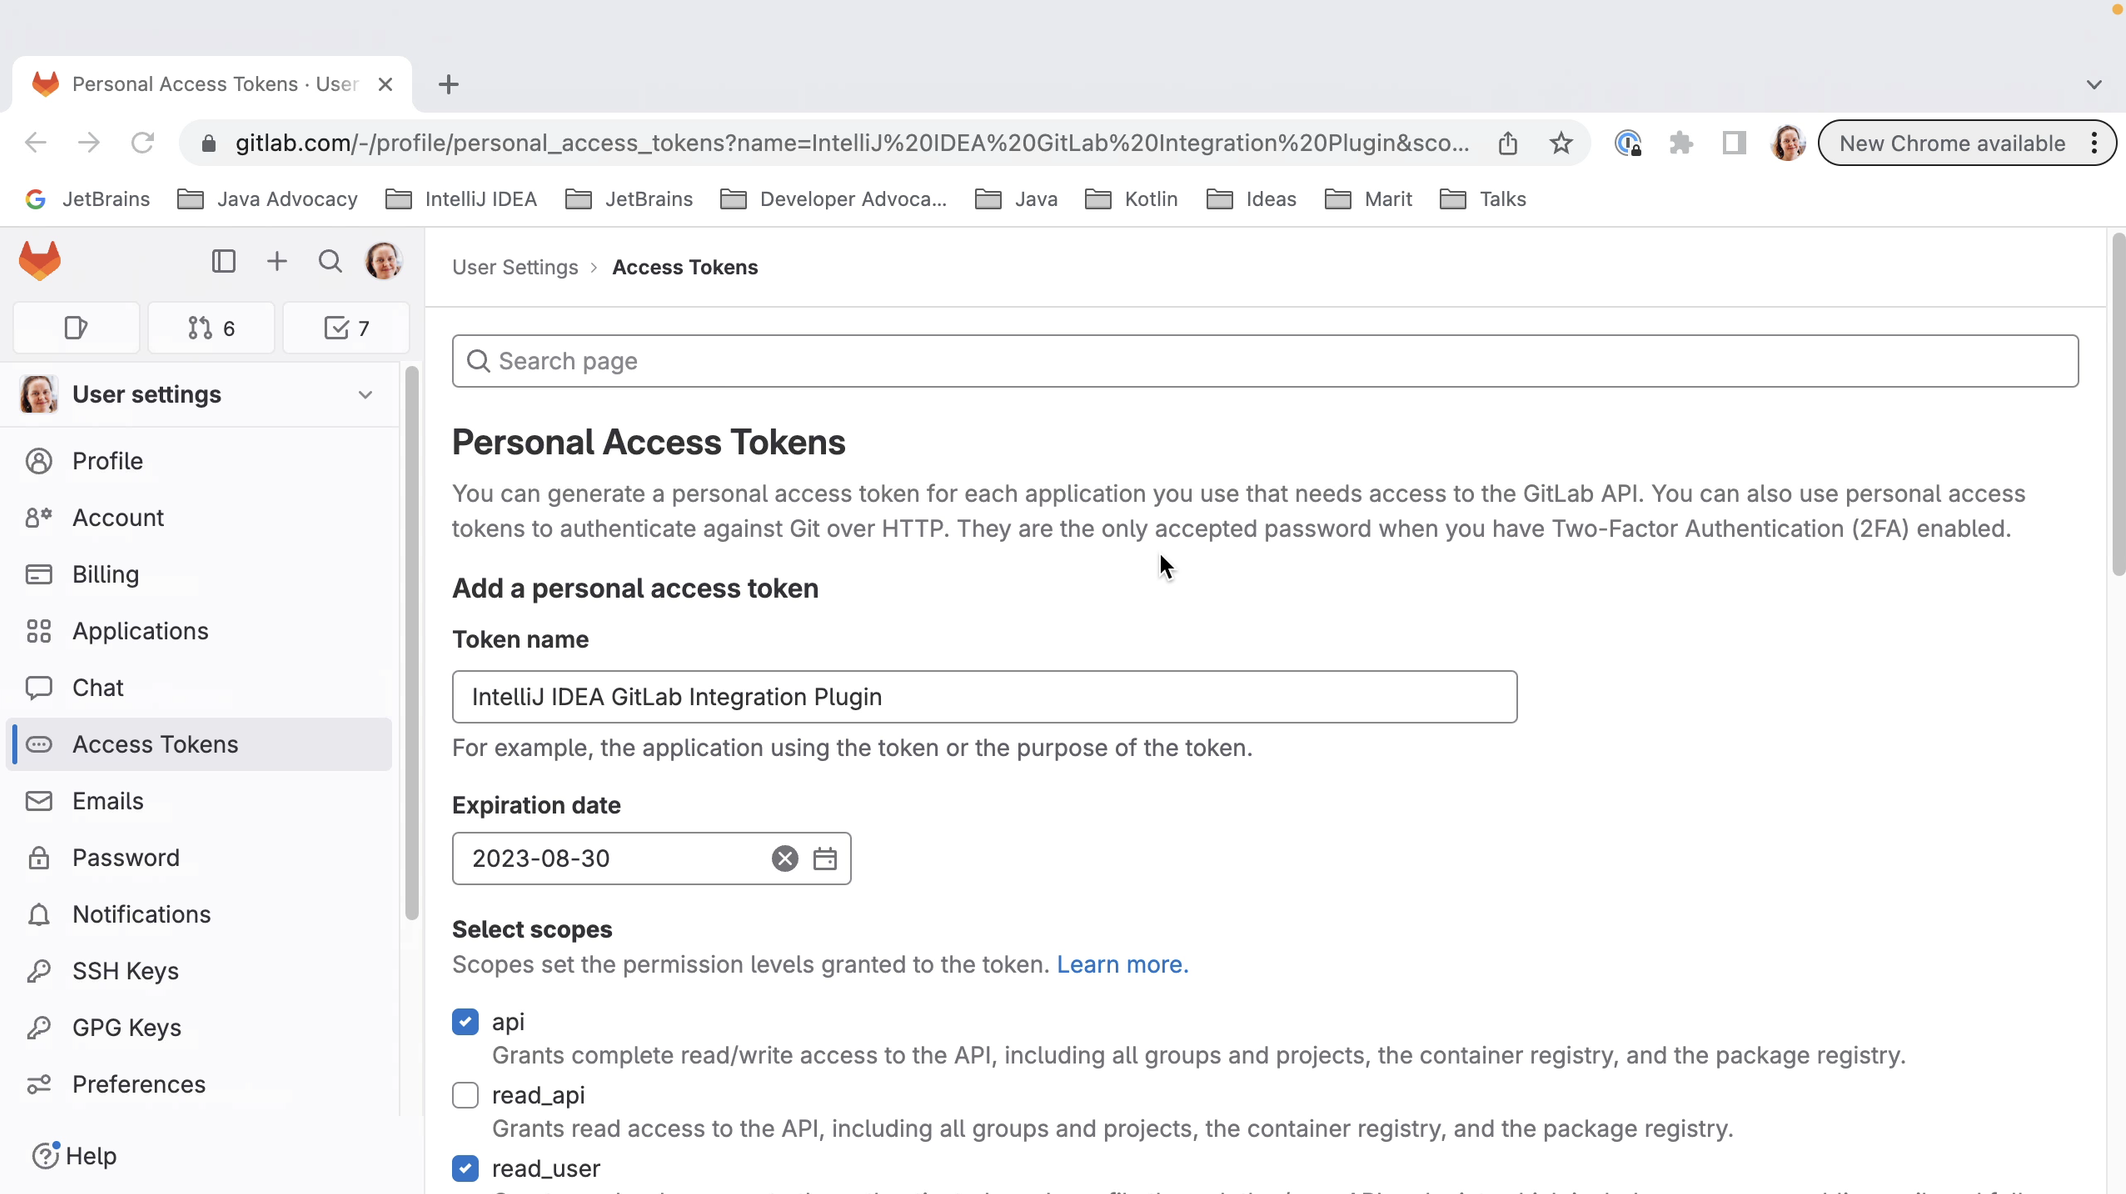
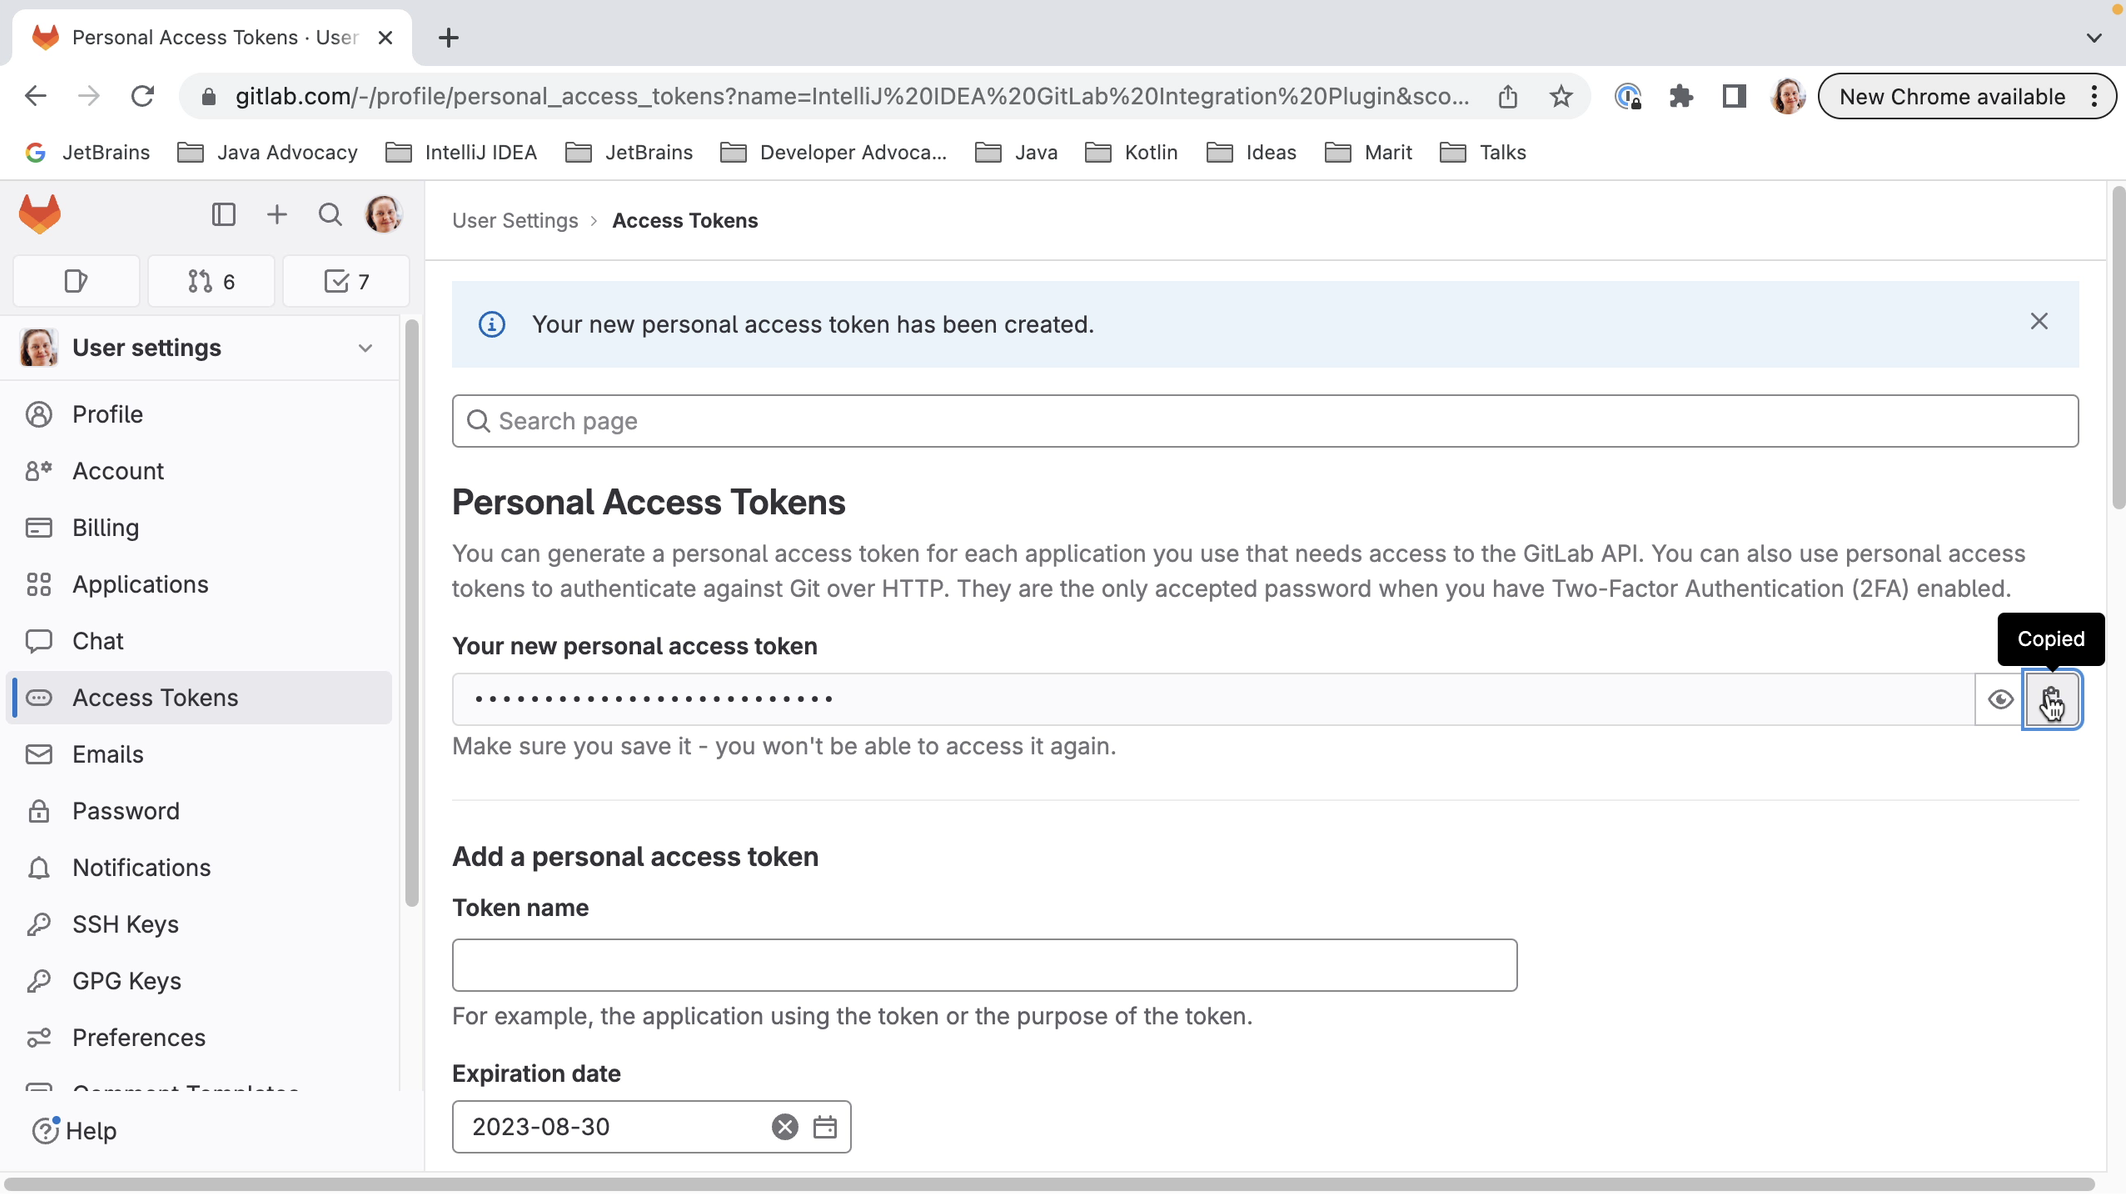
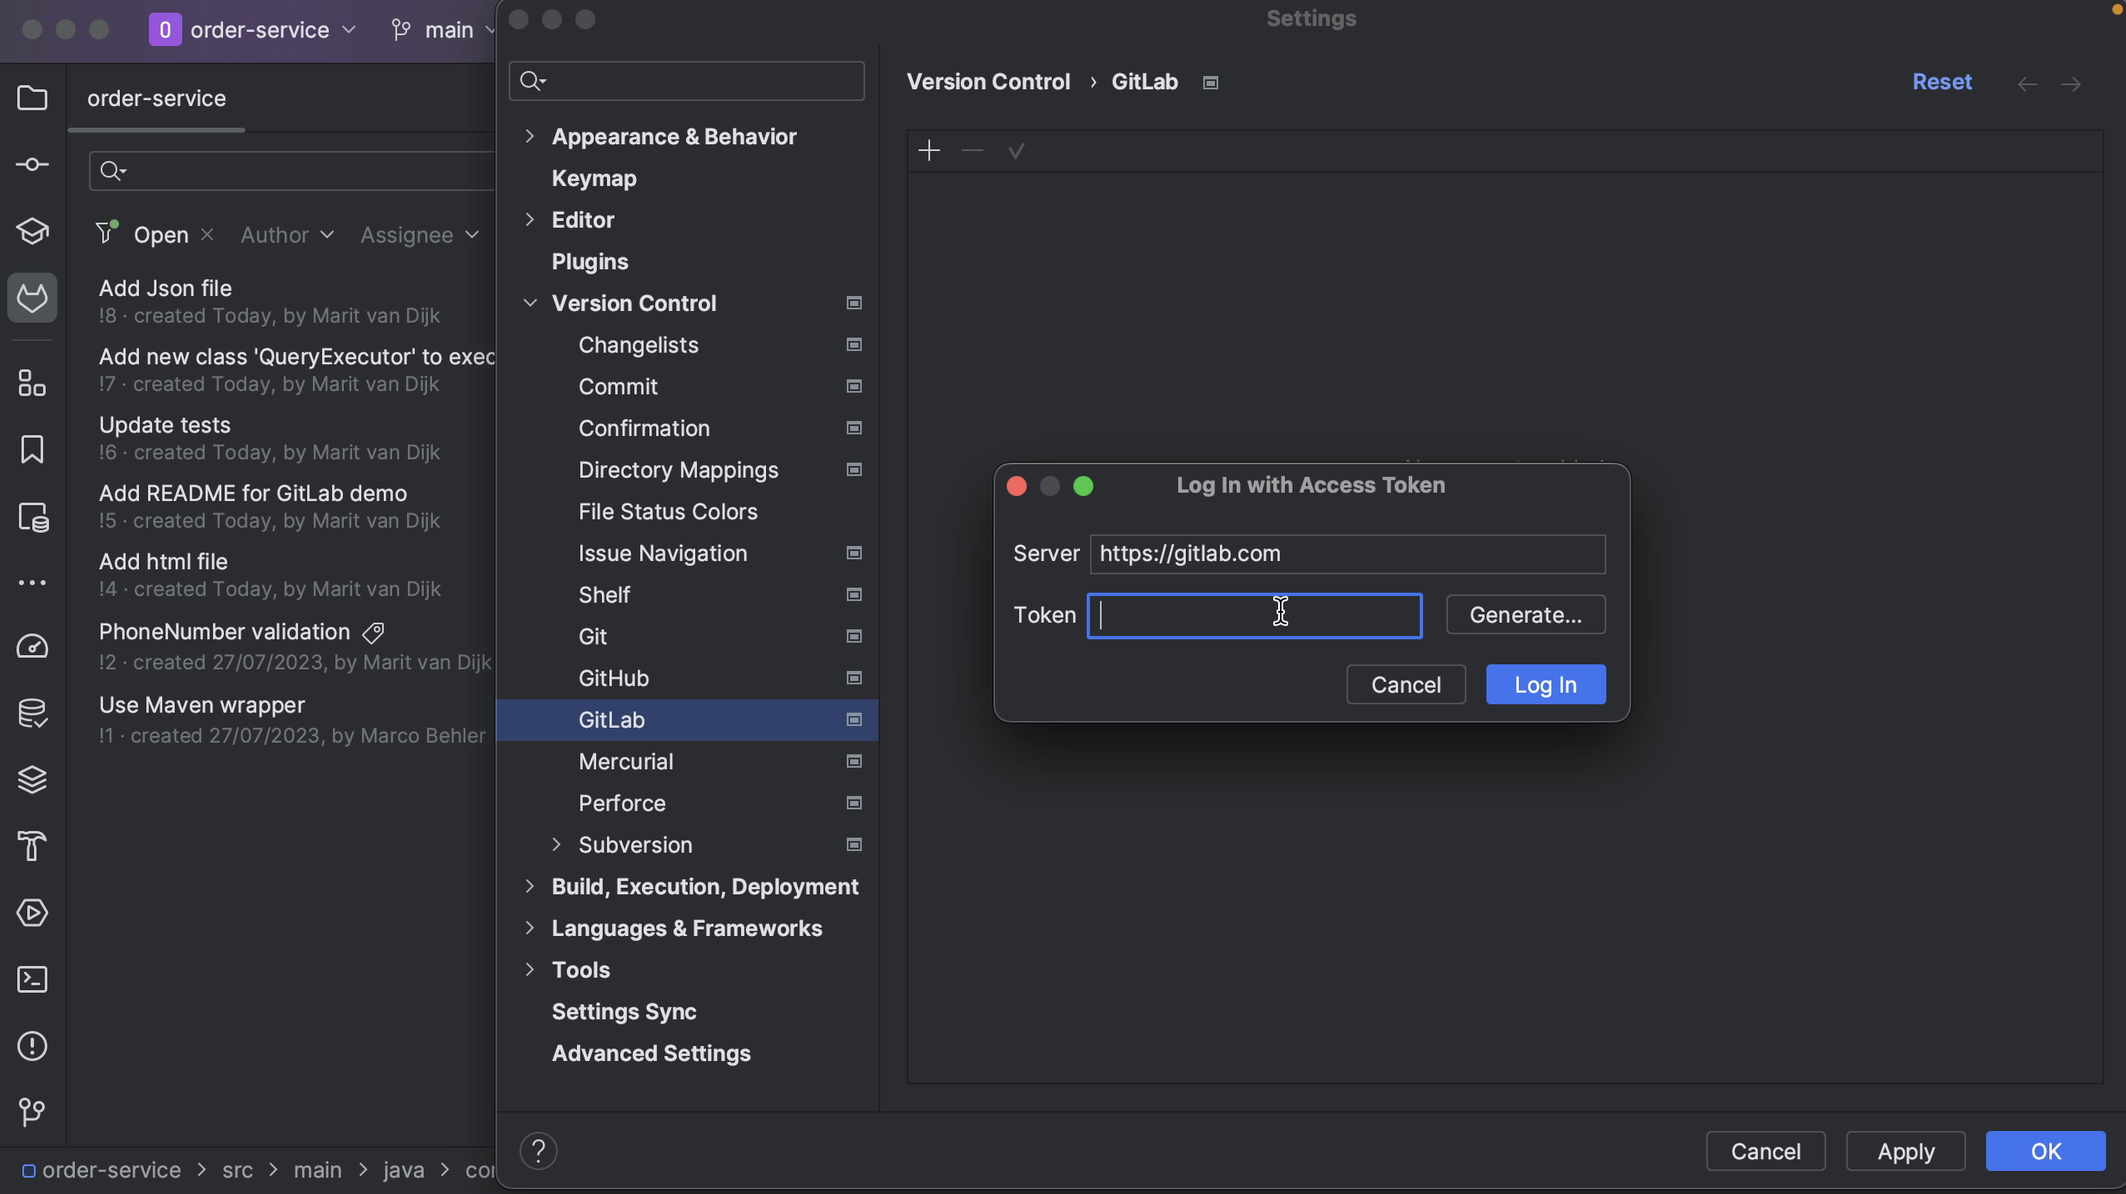
We can log into GitLab with a token. When we click Generate, this will take us to the GitLab page where a token with the right scopes can be generated for us. Click the button Create personal access token to create the token. When the token is generated, click the button to copy the token.
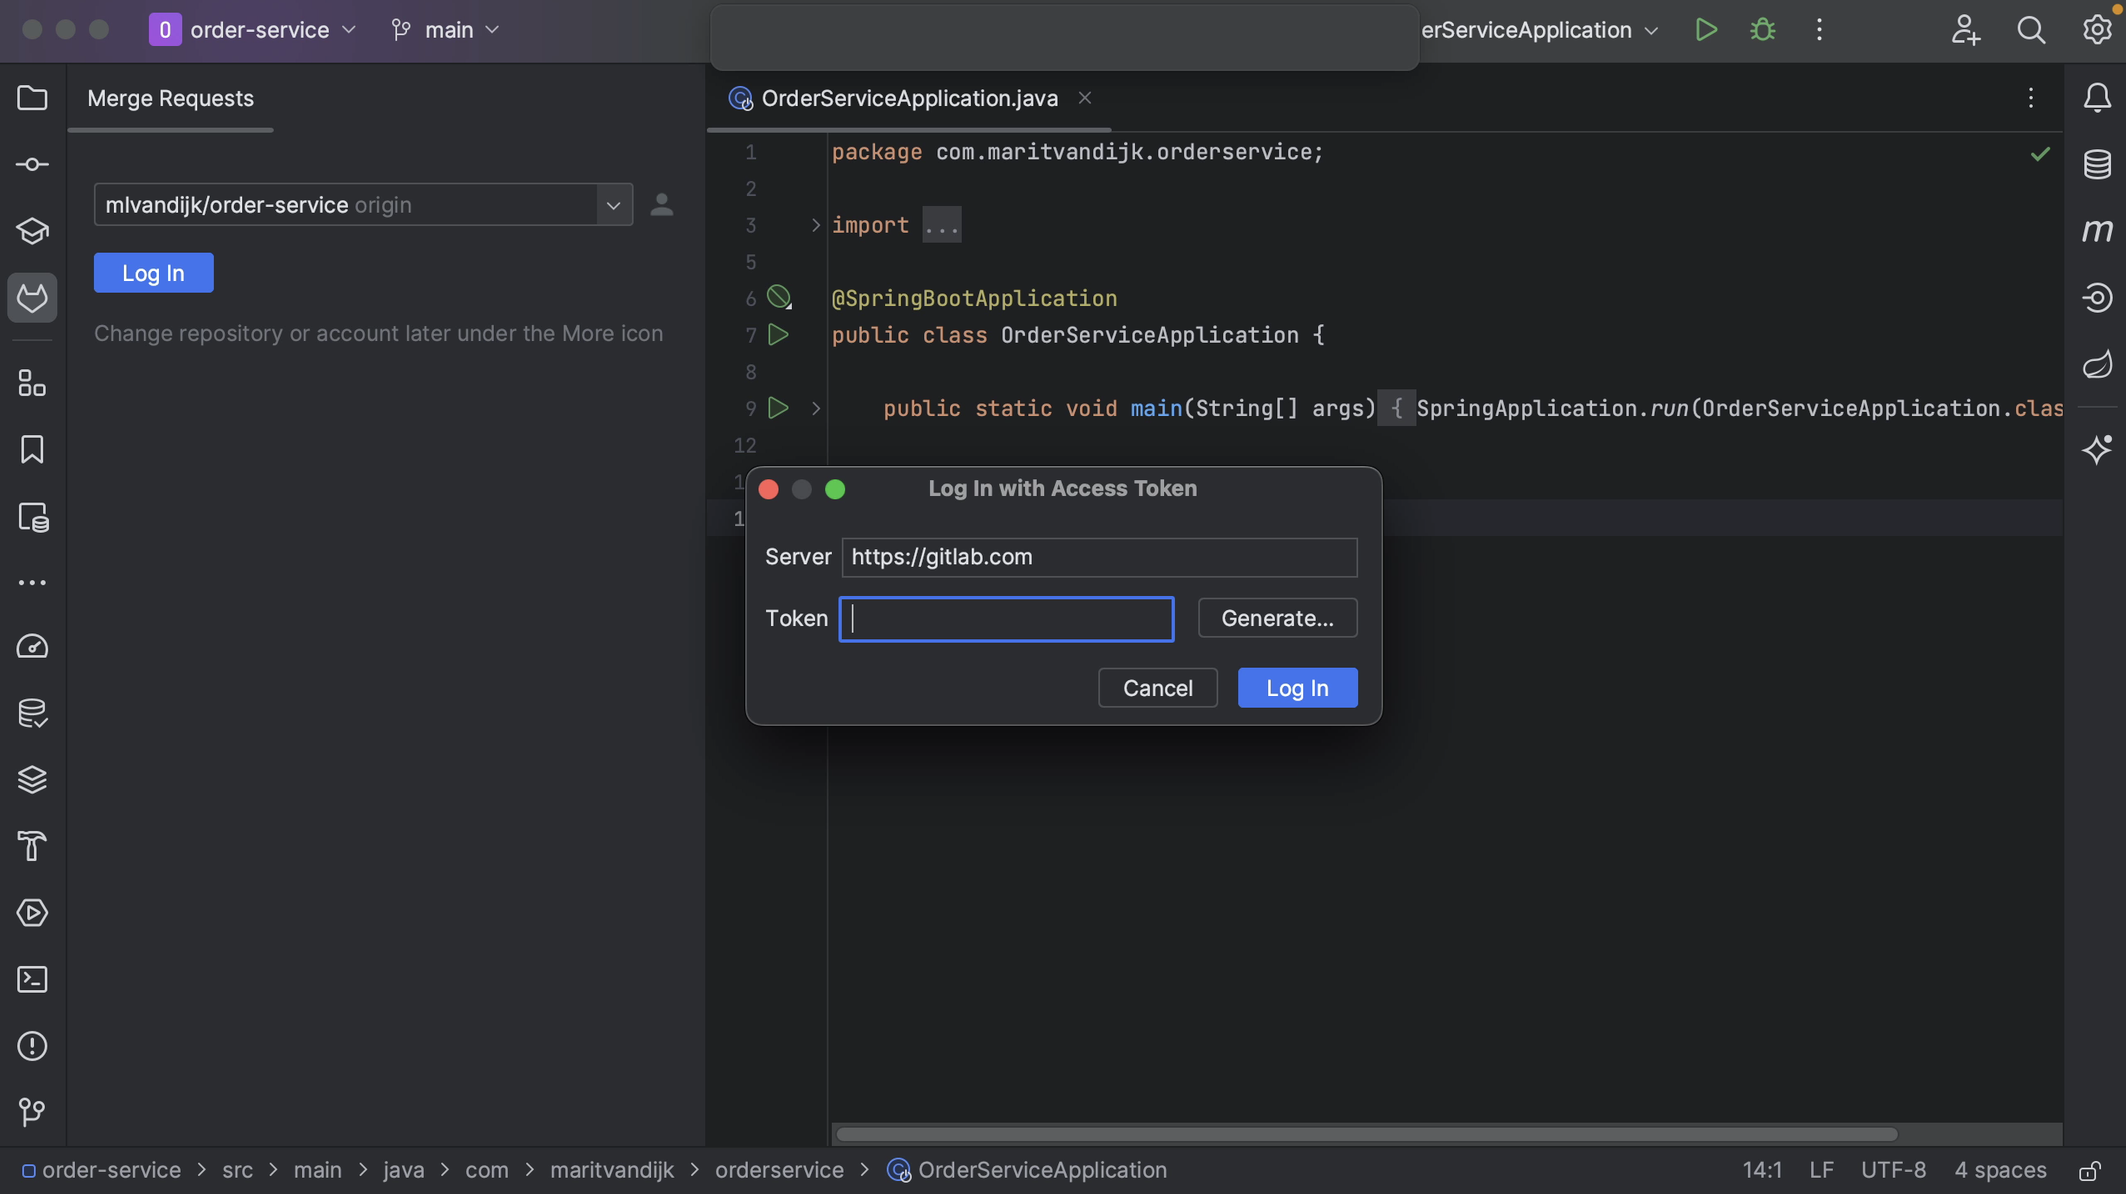
We can copy the token into the Token field in the popup and click Log In.
Alternatively, we can use an existing token, as long as it has the required scopes.
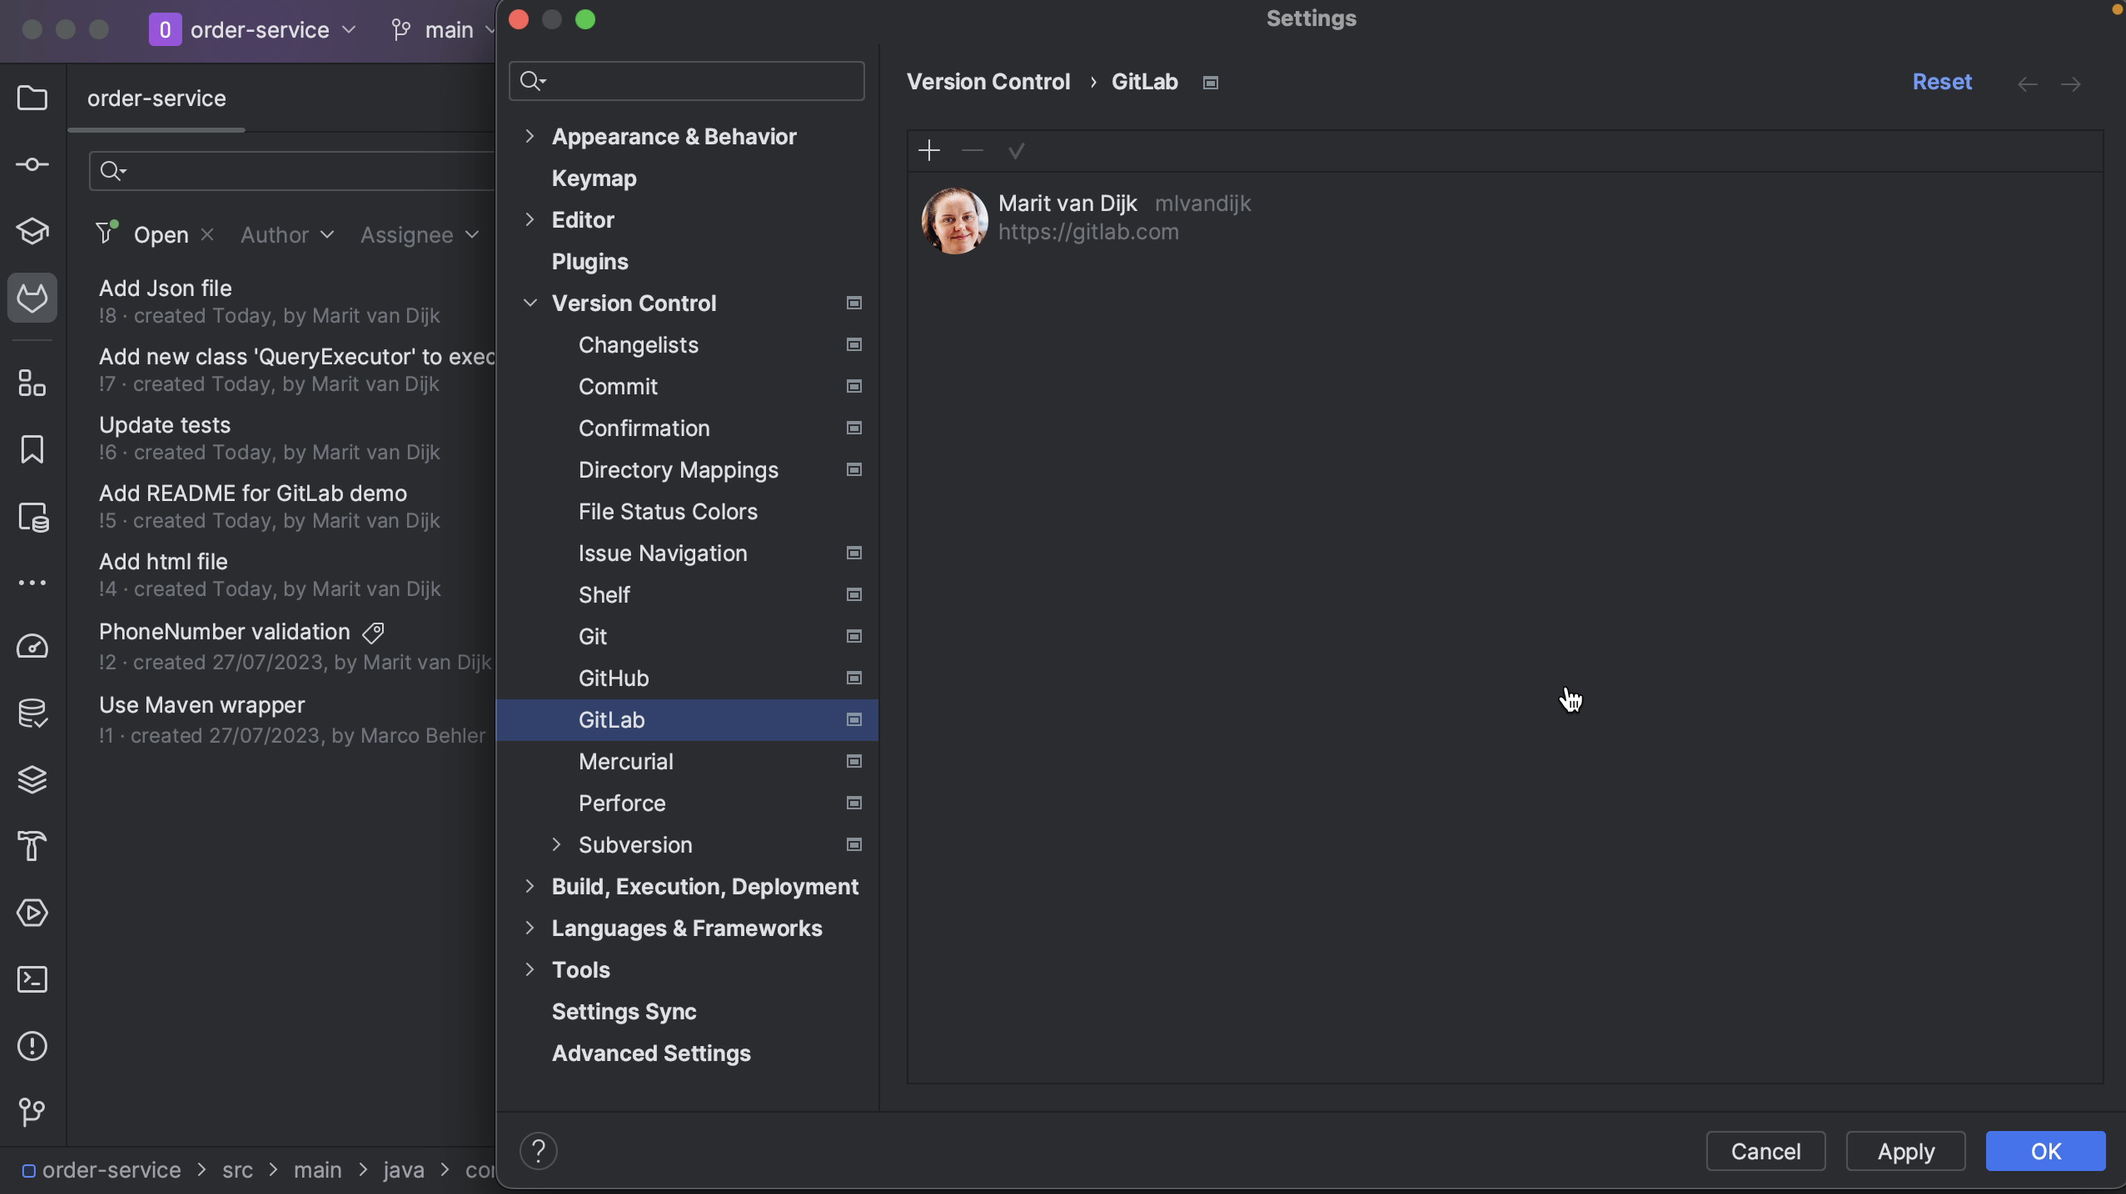
We can also log in to our GitLab account in the Settings. Open the Settings (⌘, on macOS | Ctrl+Alt+S on Windows/Linux) and go to Version Control > GitLab. Click Add Account (⌘N on macOS | Alt+Insert on Windows/Linux) to add an account if there is no account logged in, or click the + button at the top left to add an account. In the popup, add the Server if needed, paste the token from GitLab into the Token field in the popup and click Log In.
GitLab Merge Request tool window
Once we’re logged in, the GitLab Merge Requests tool window will show all open Merge Requests for the GitLab repository.
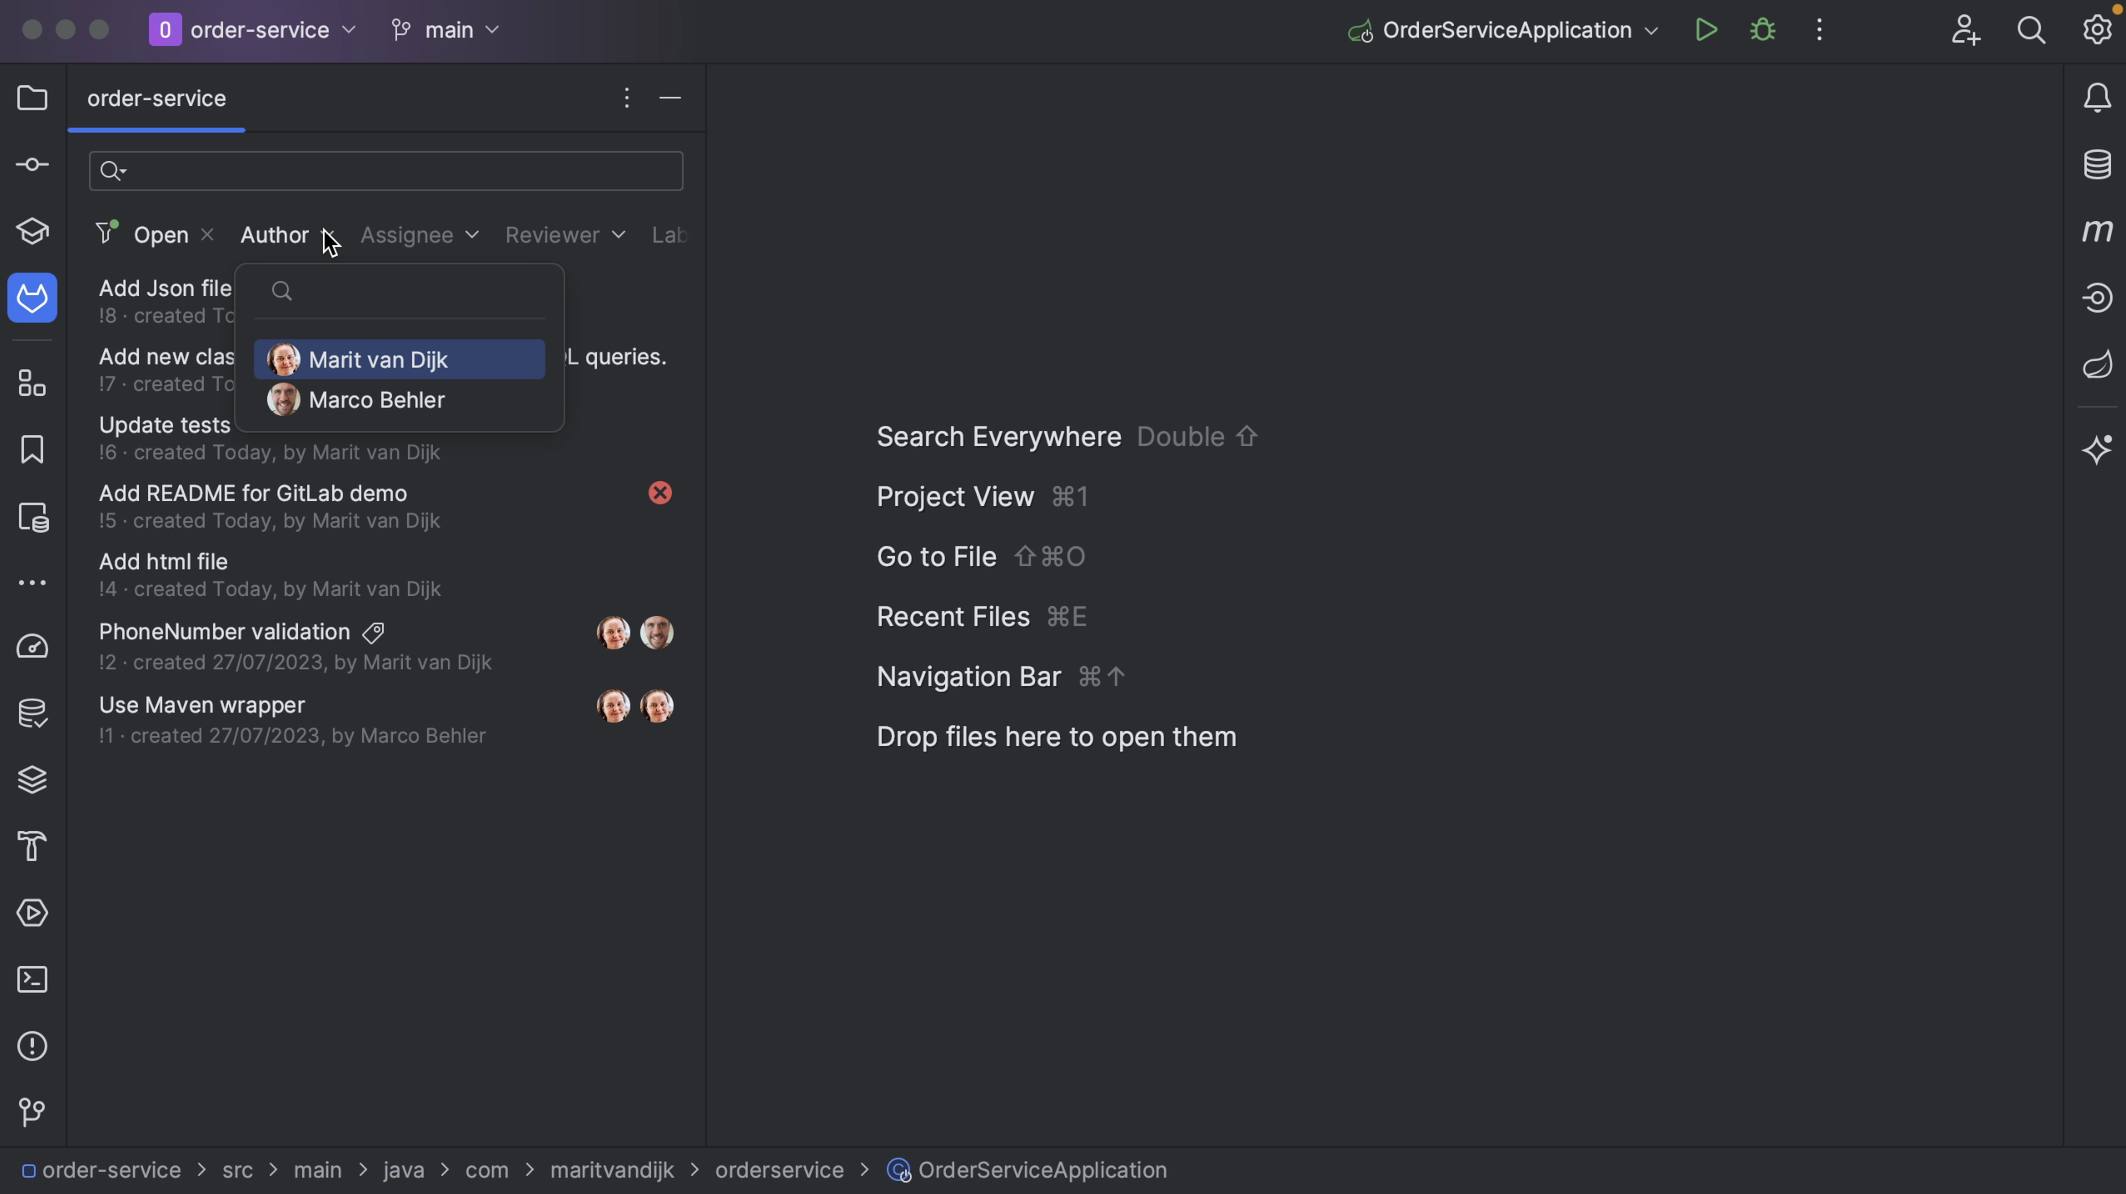
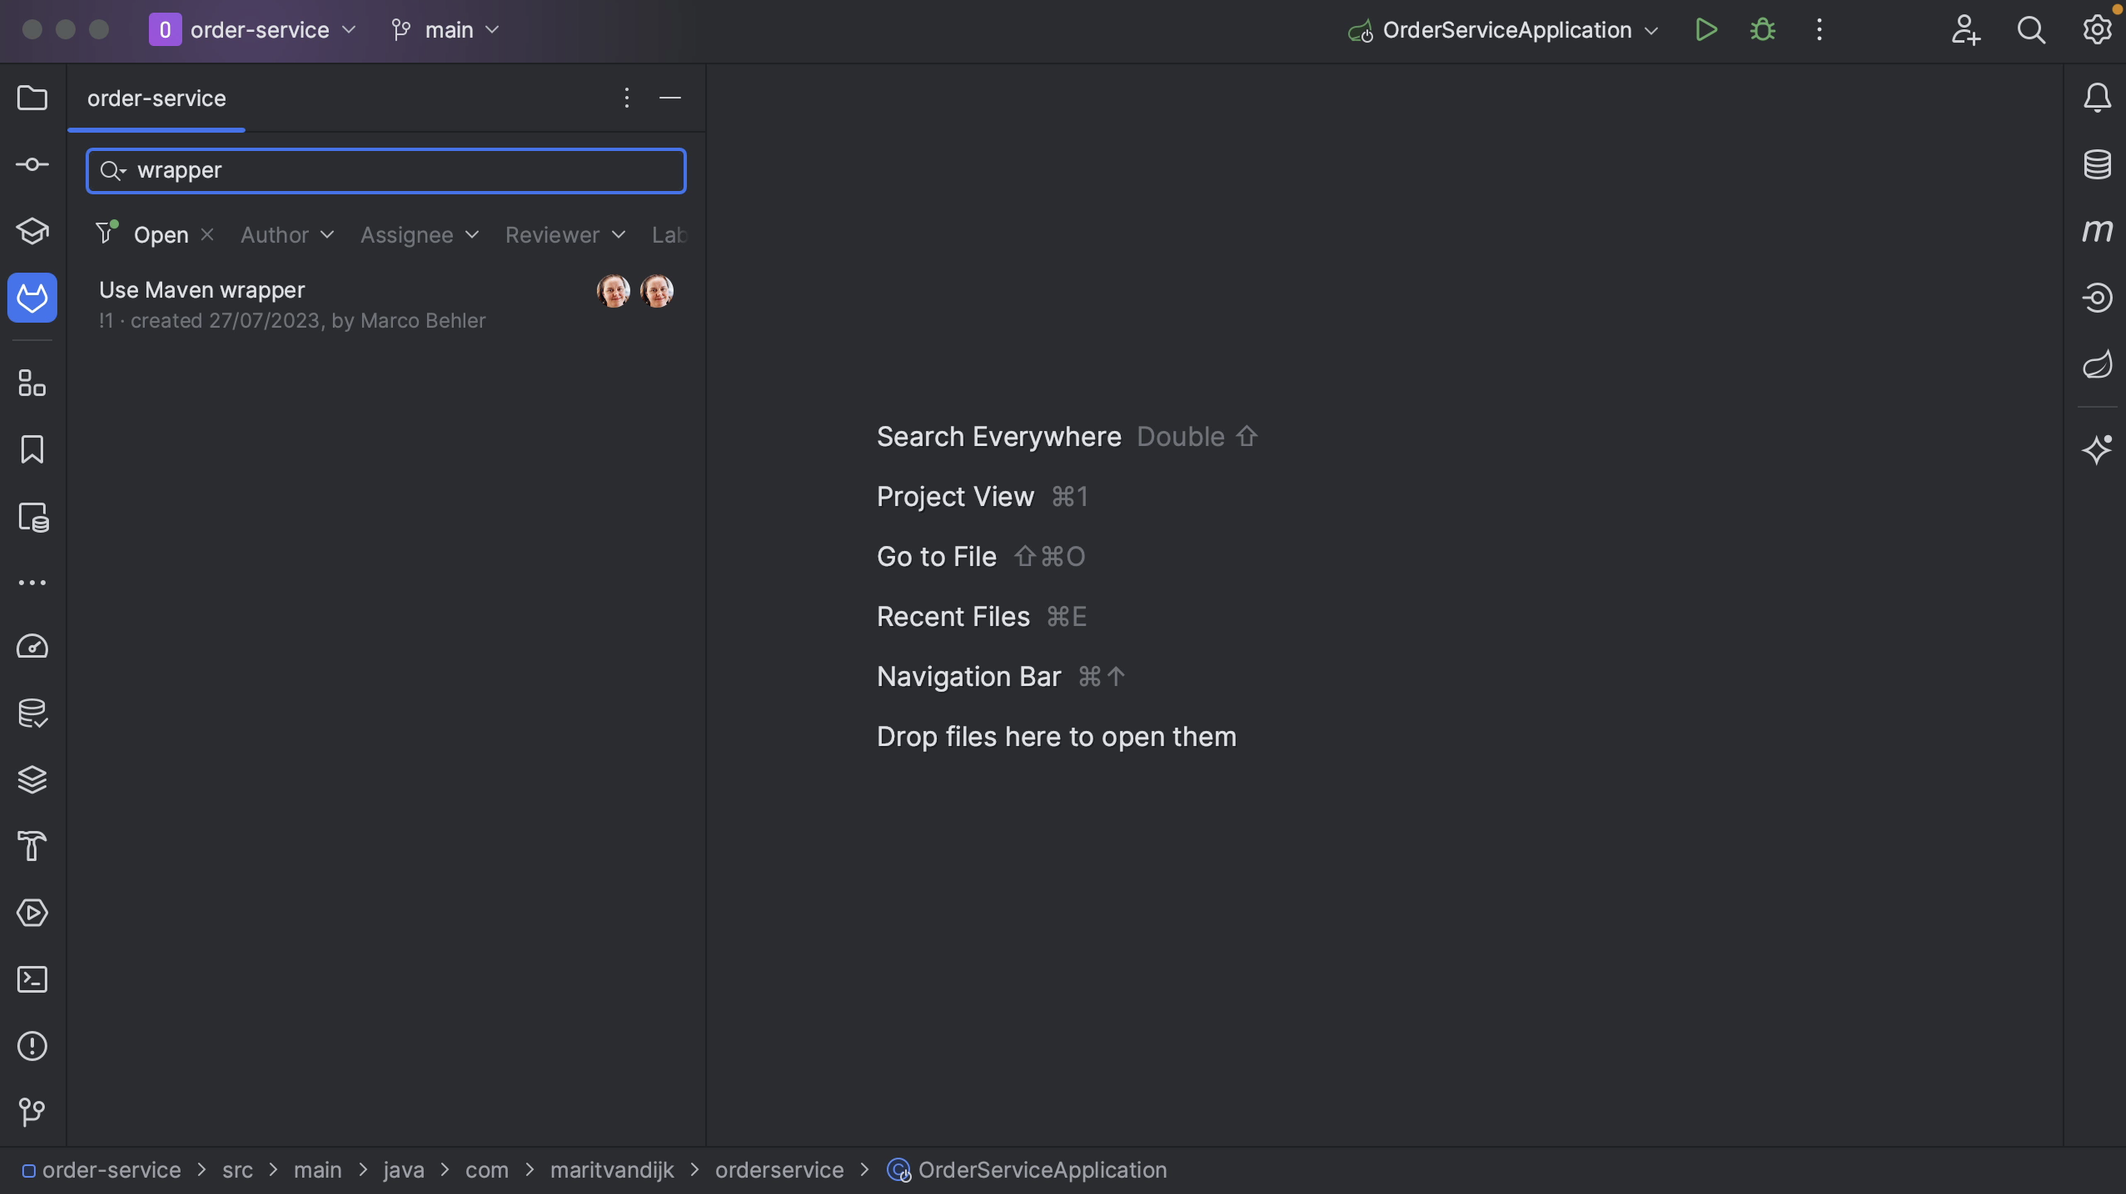
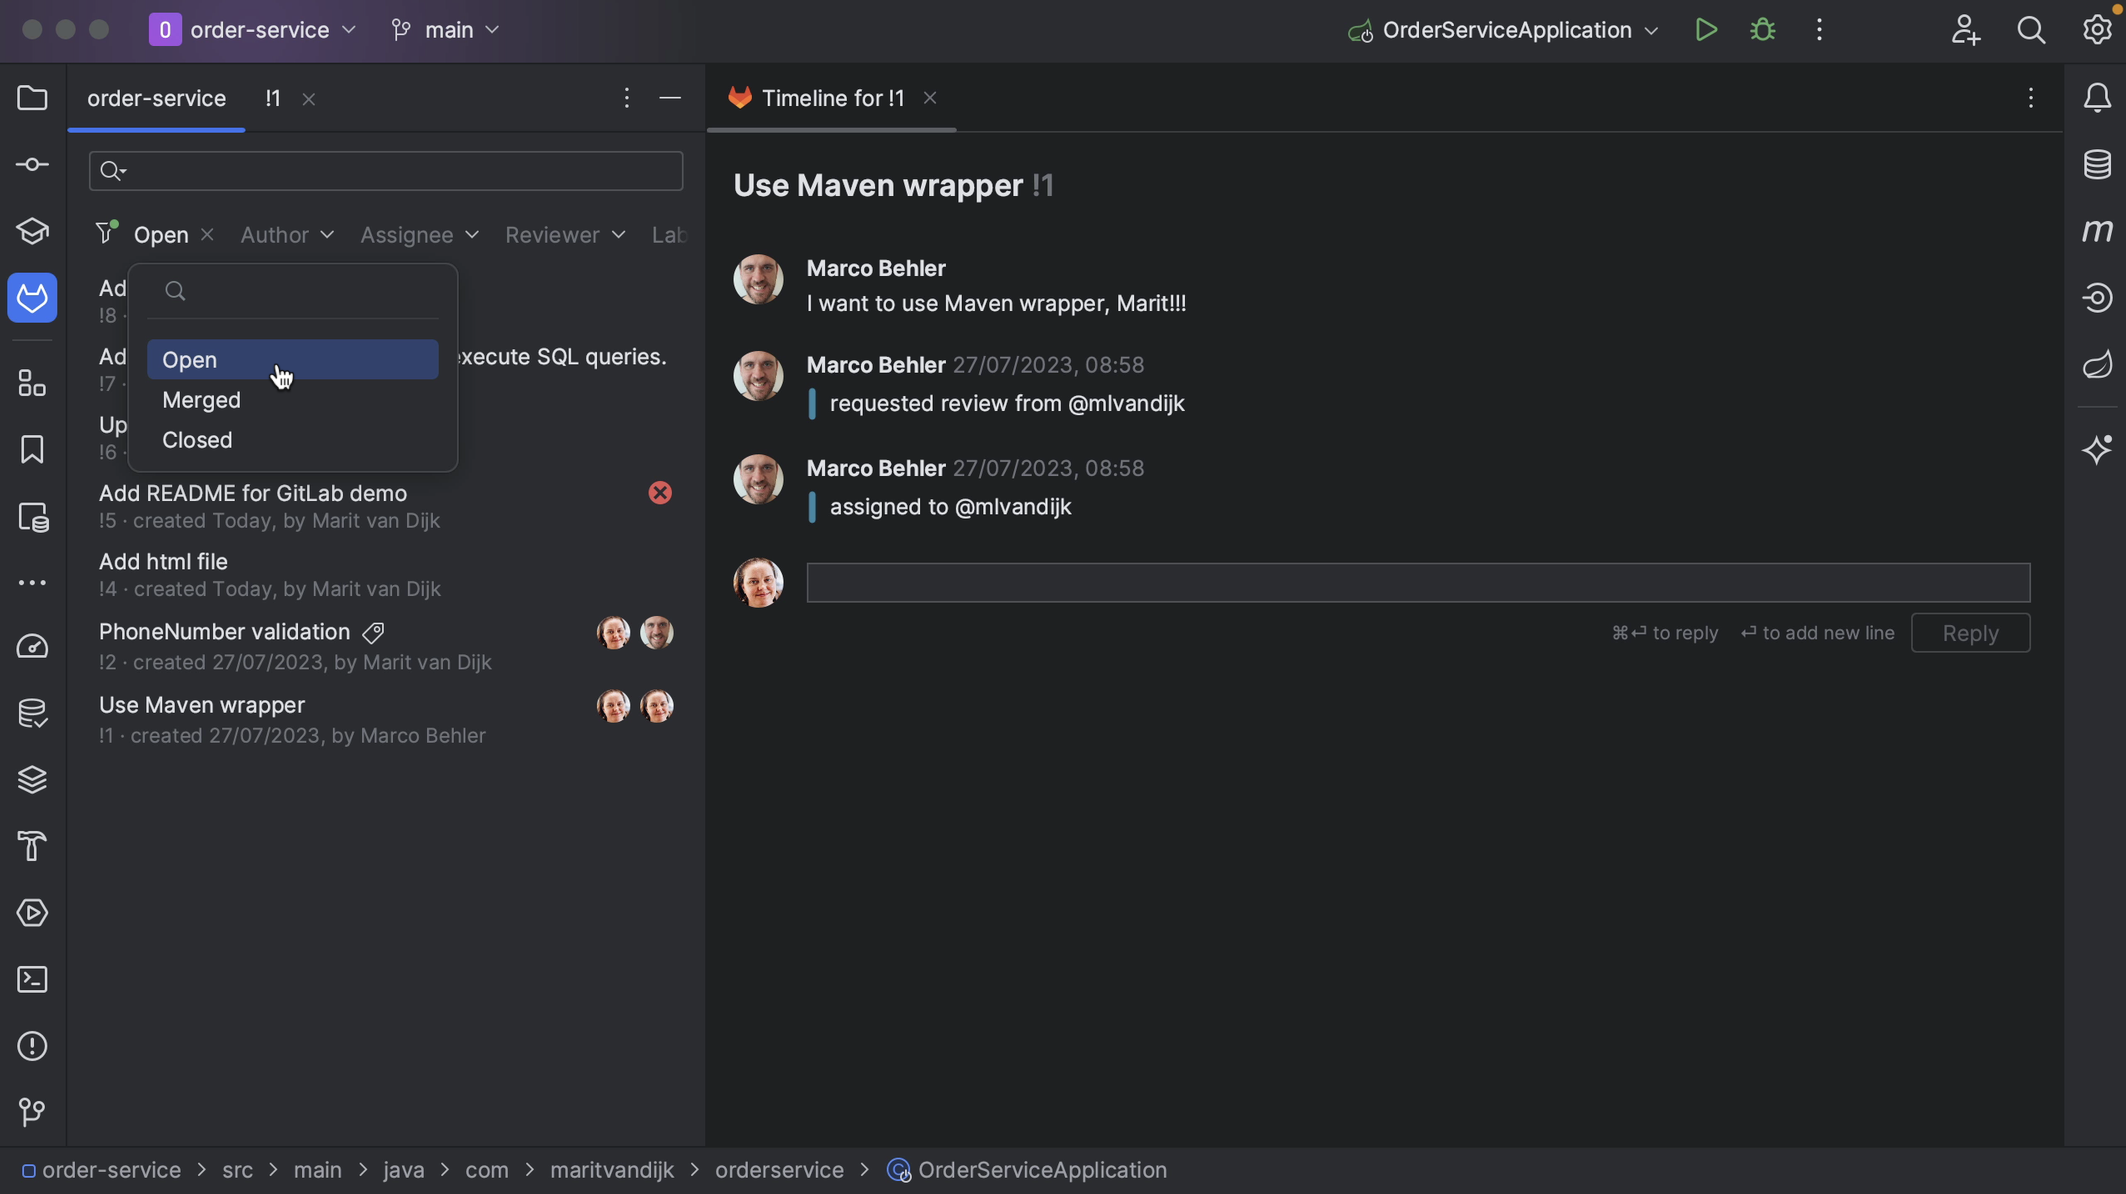
We can change the search criteria to look for specific Merge Requests. We can use predefined filters, or search for something more specific.
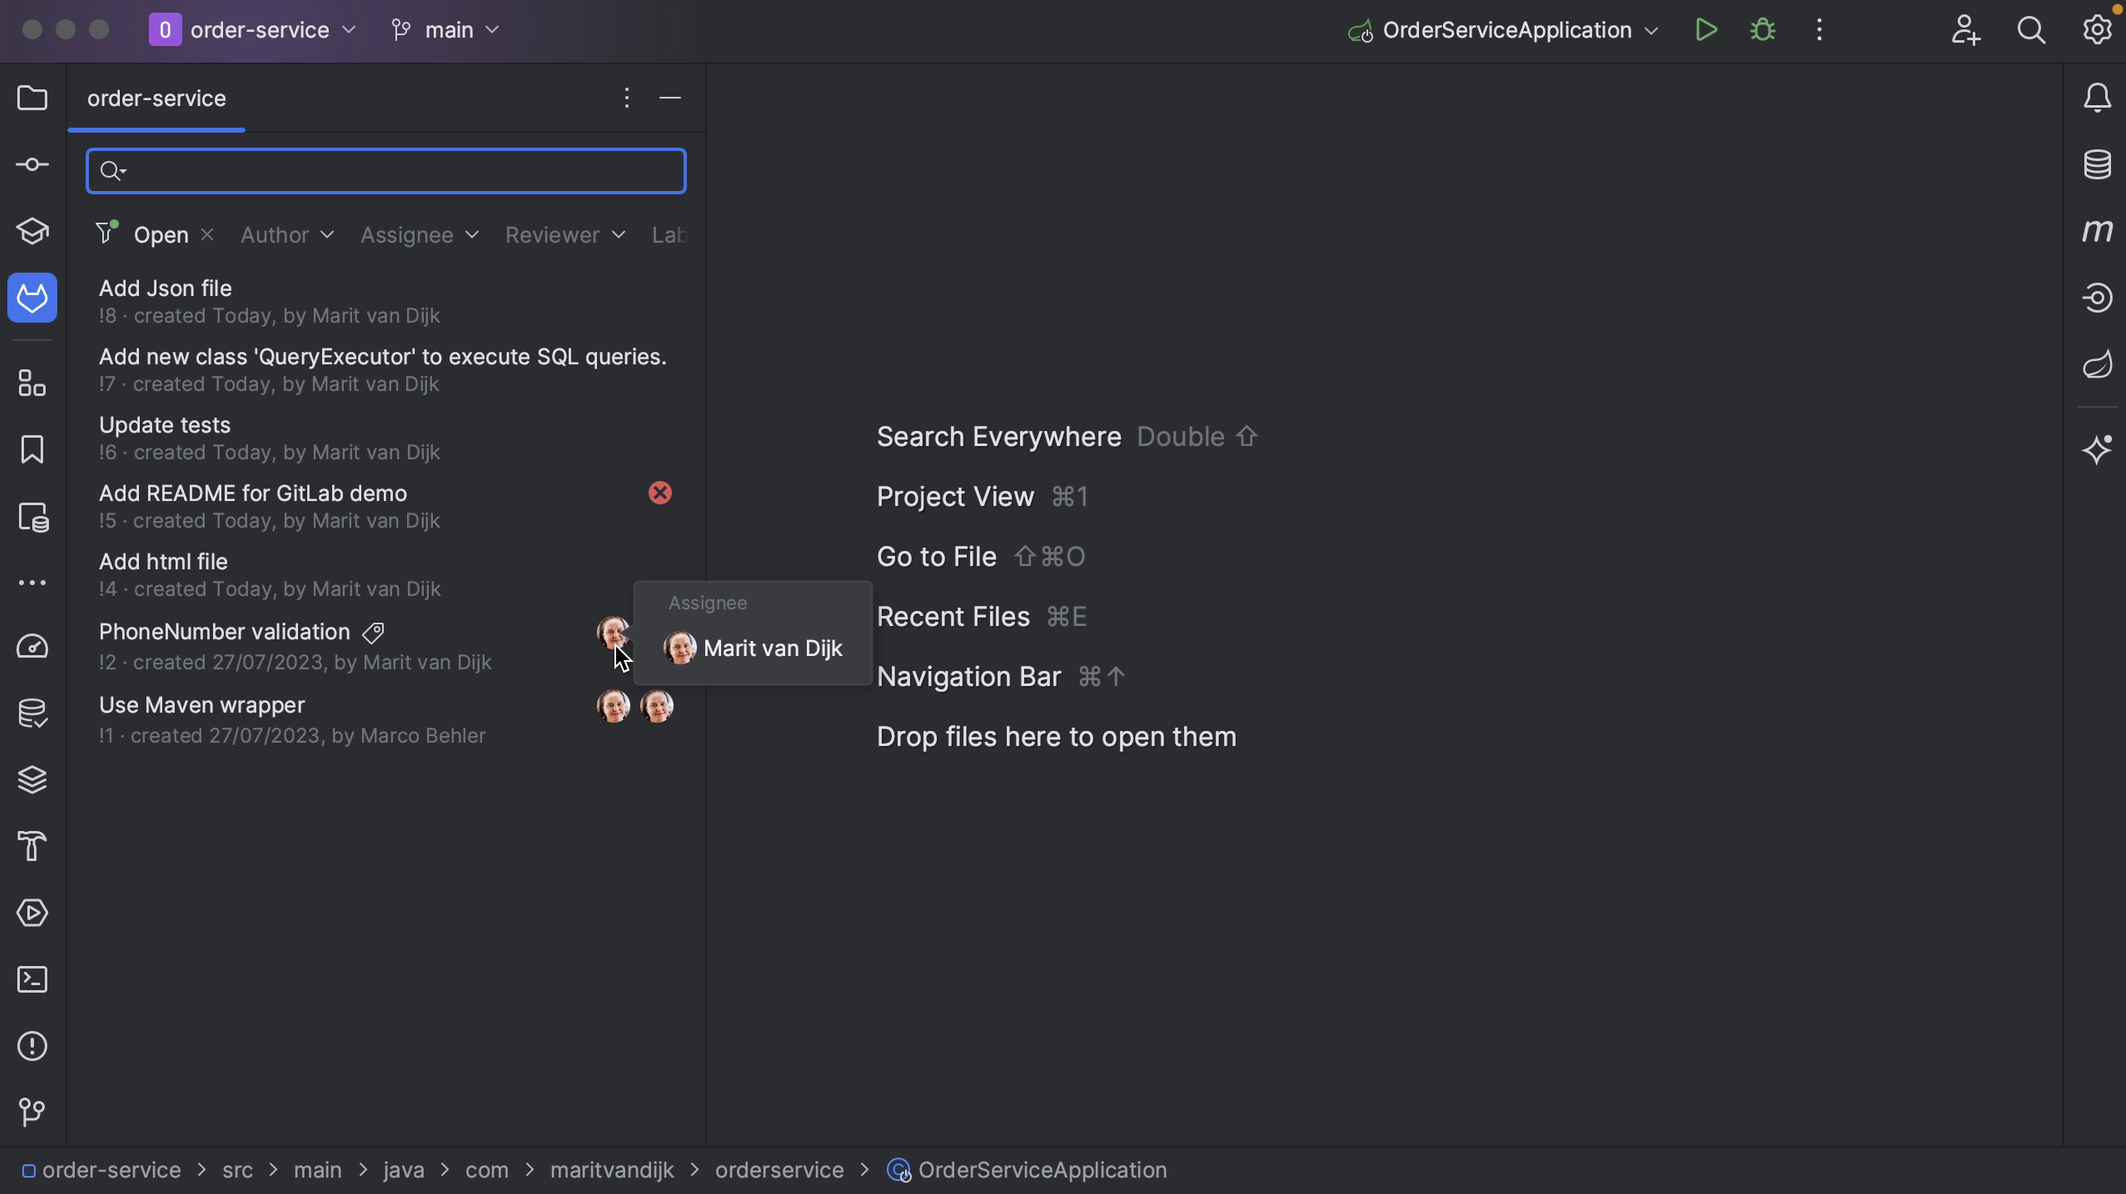
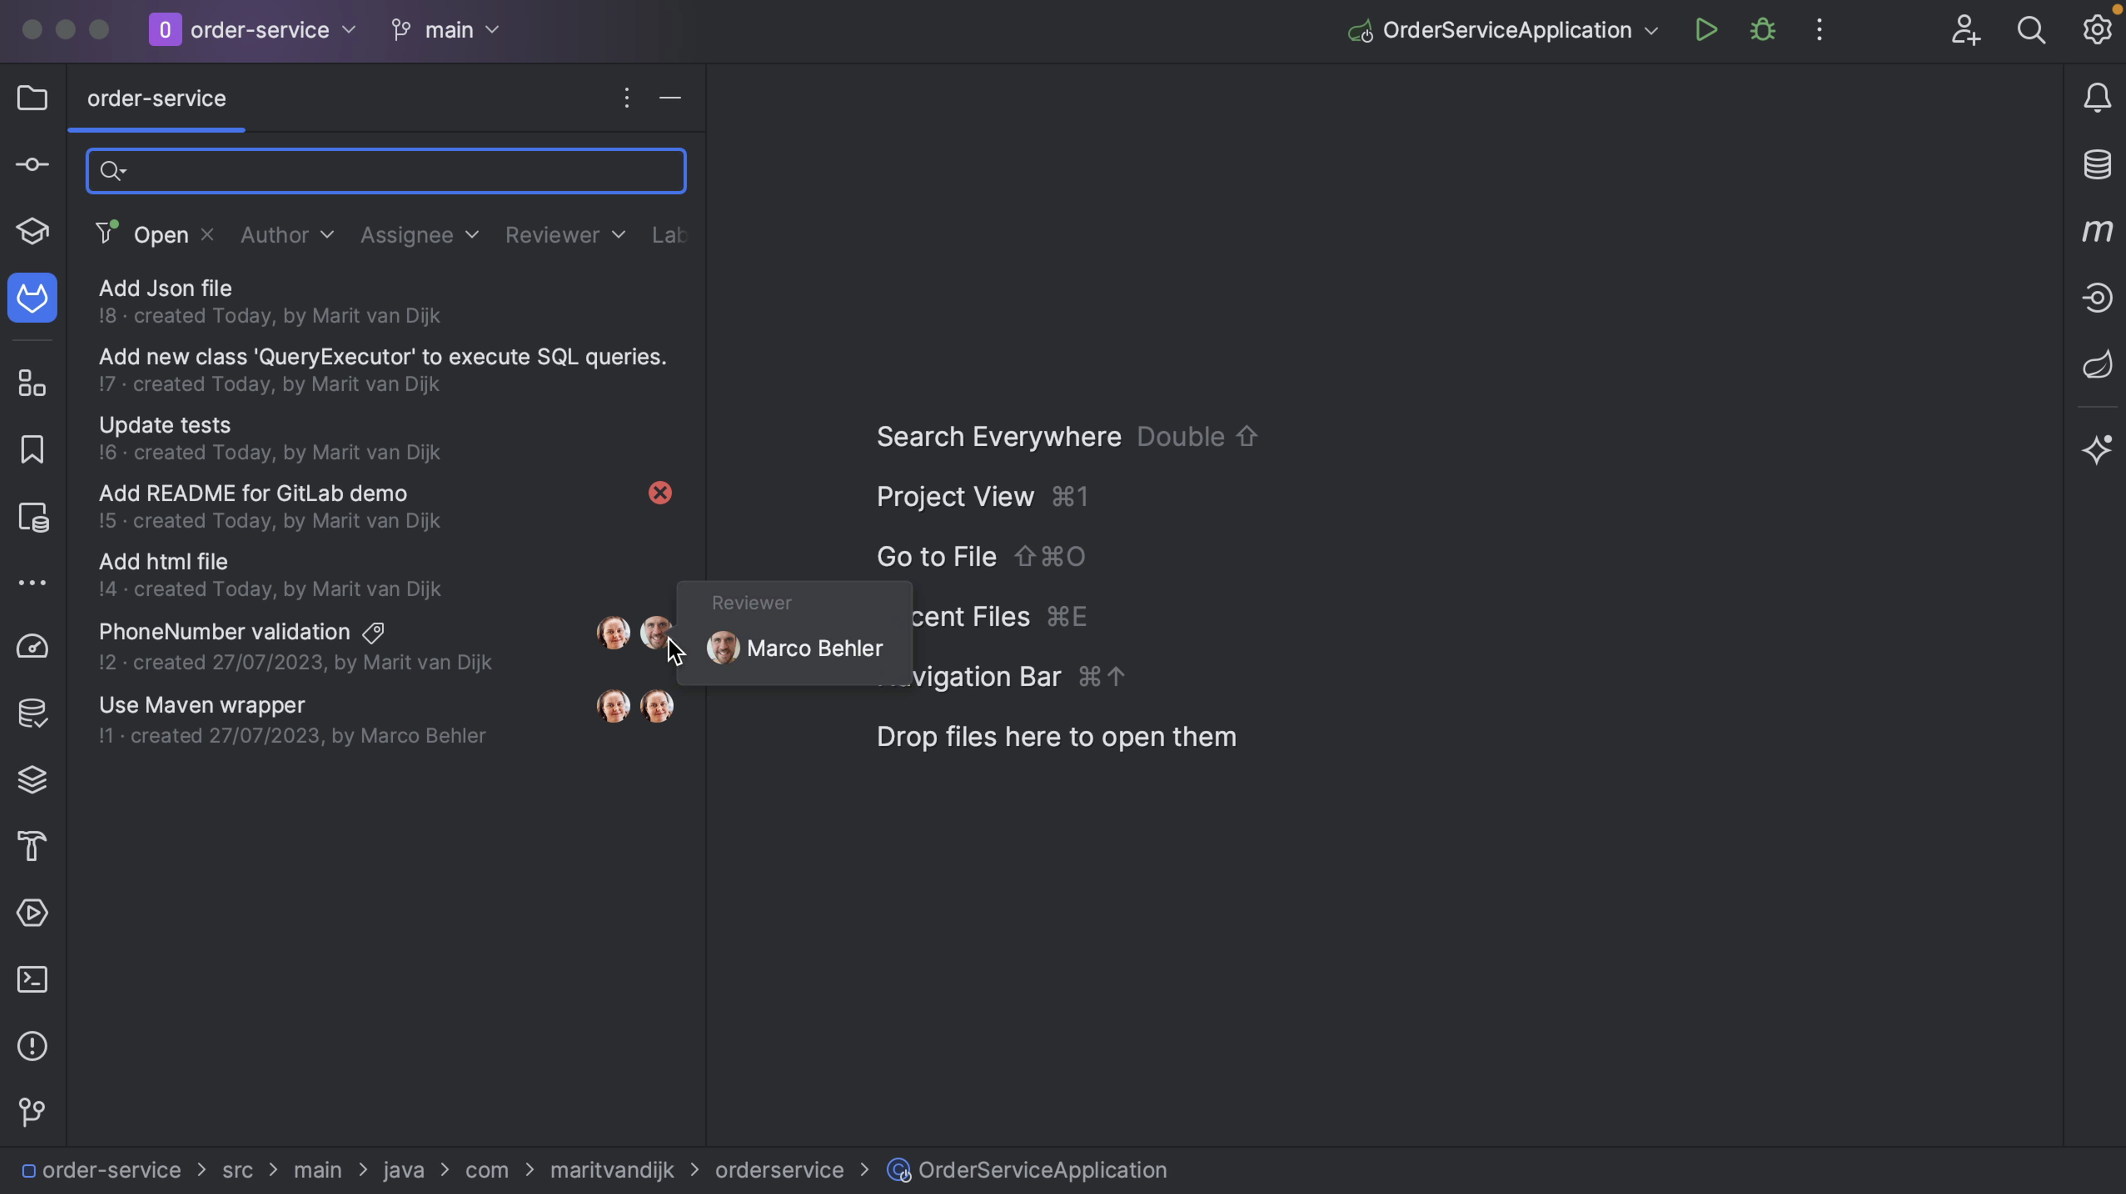
If the Merge Request has assignees and/or reviewers assigned, we can see them here.
We can see the details of a specific Merge Request by double-clicking on it.
We can go back to the list of search results by clicking the project name in the top left of the Merge Requests tool window. We can see that the Merge Request we just looked at still has a tab open here, in case we want to go back.
Usually, you’ll want to look for open Merge Requests, since these are the ones that need attention. Let’s double-click, or press Enter, on one of these Merge Requests.
View GitLab Merge Requests inside IntelliJ IDEA
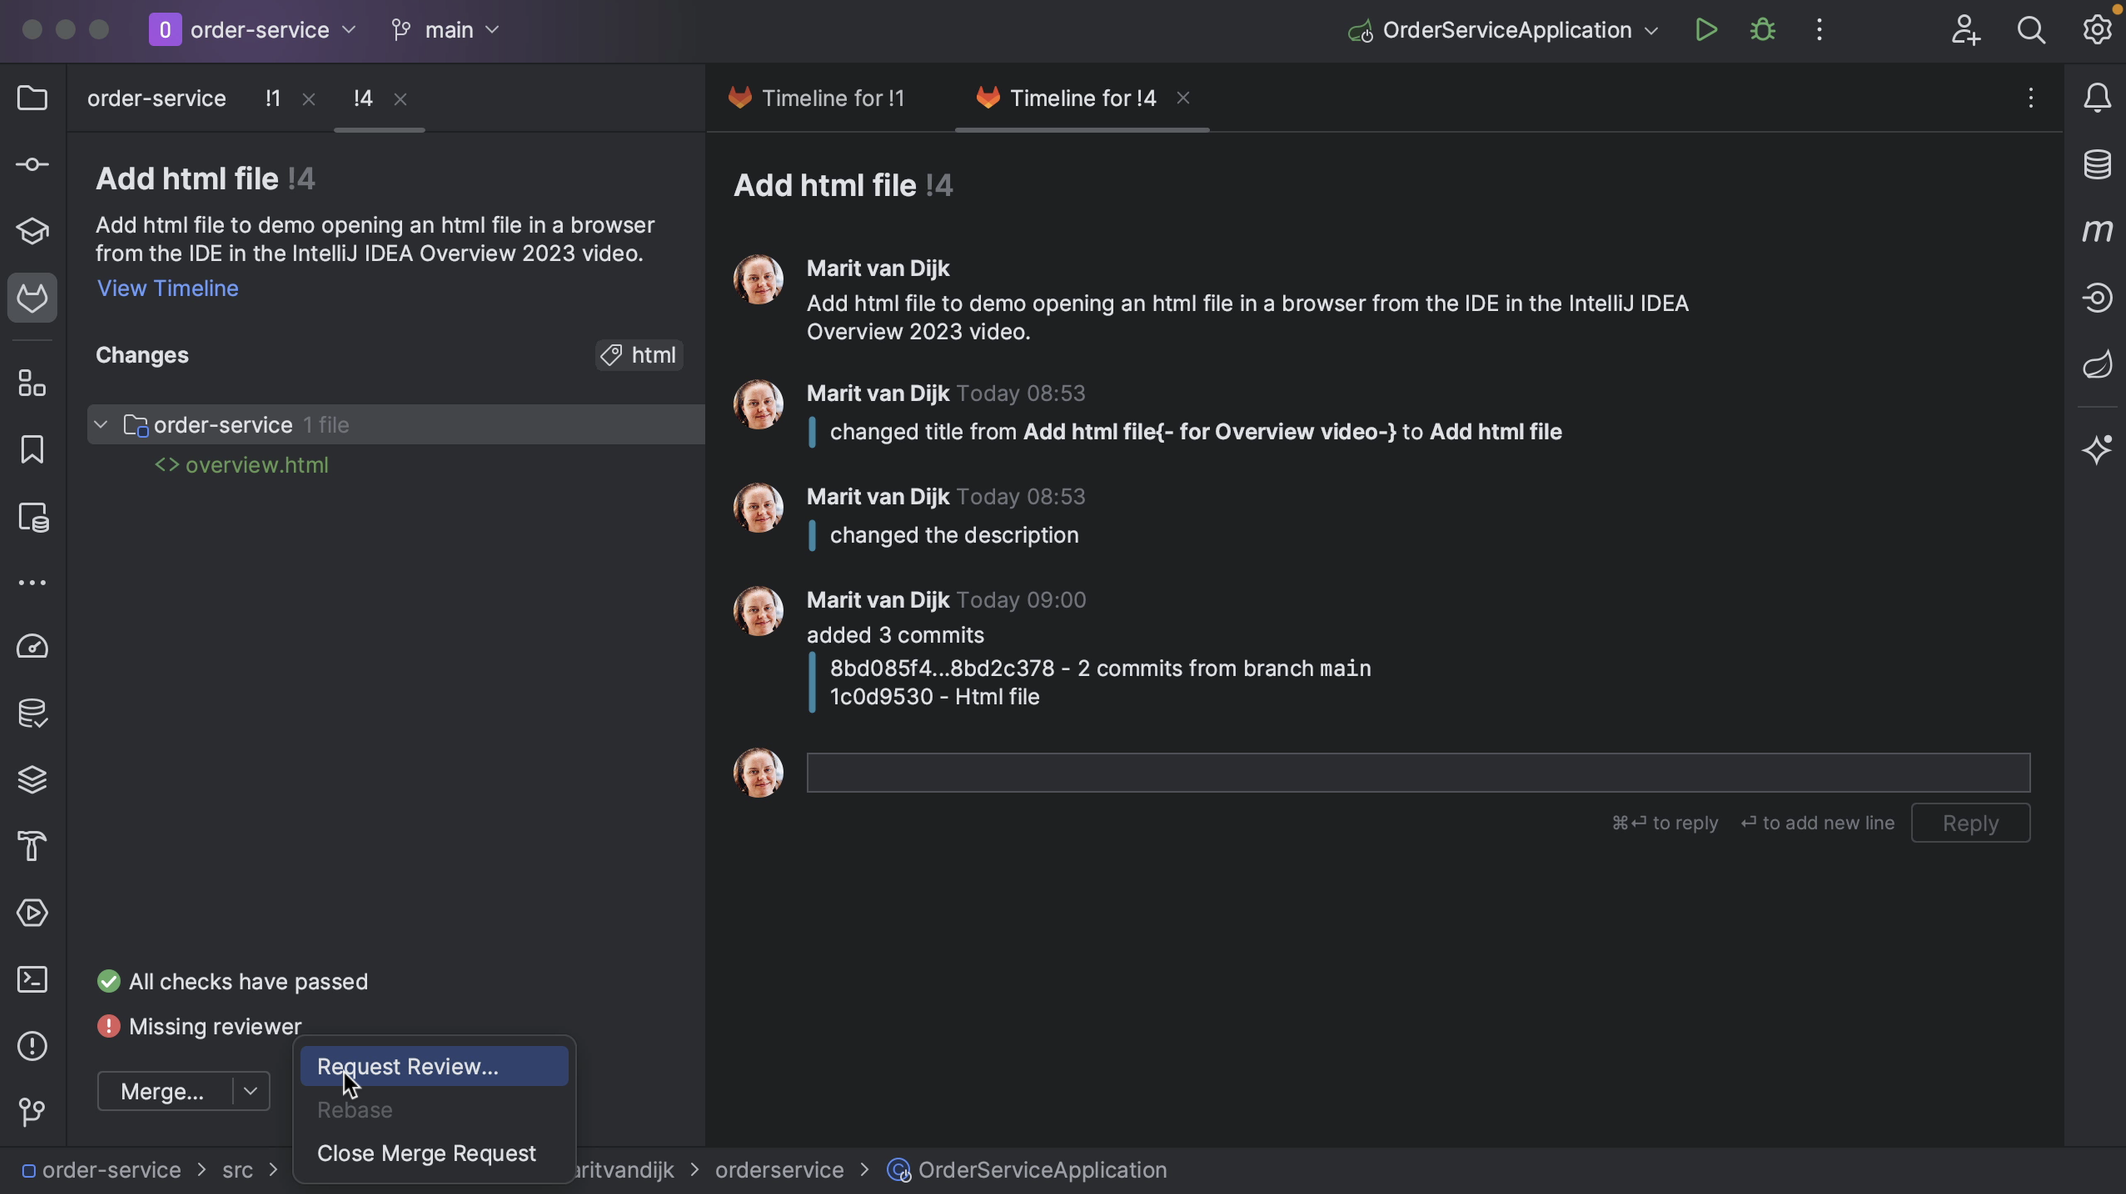
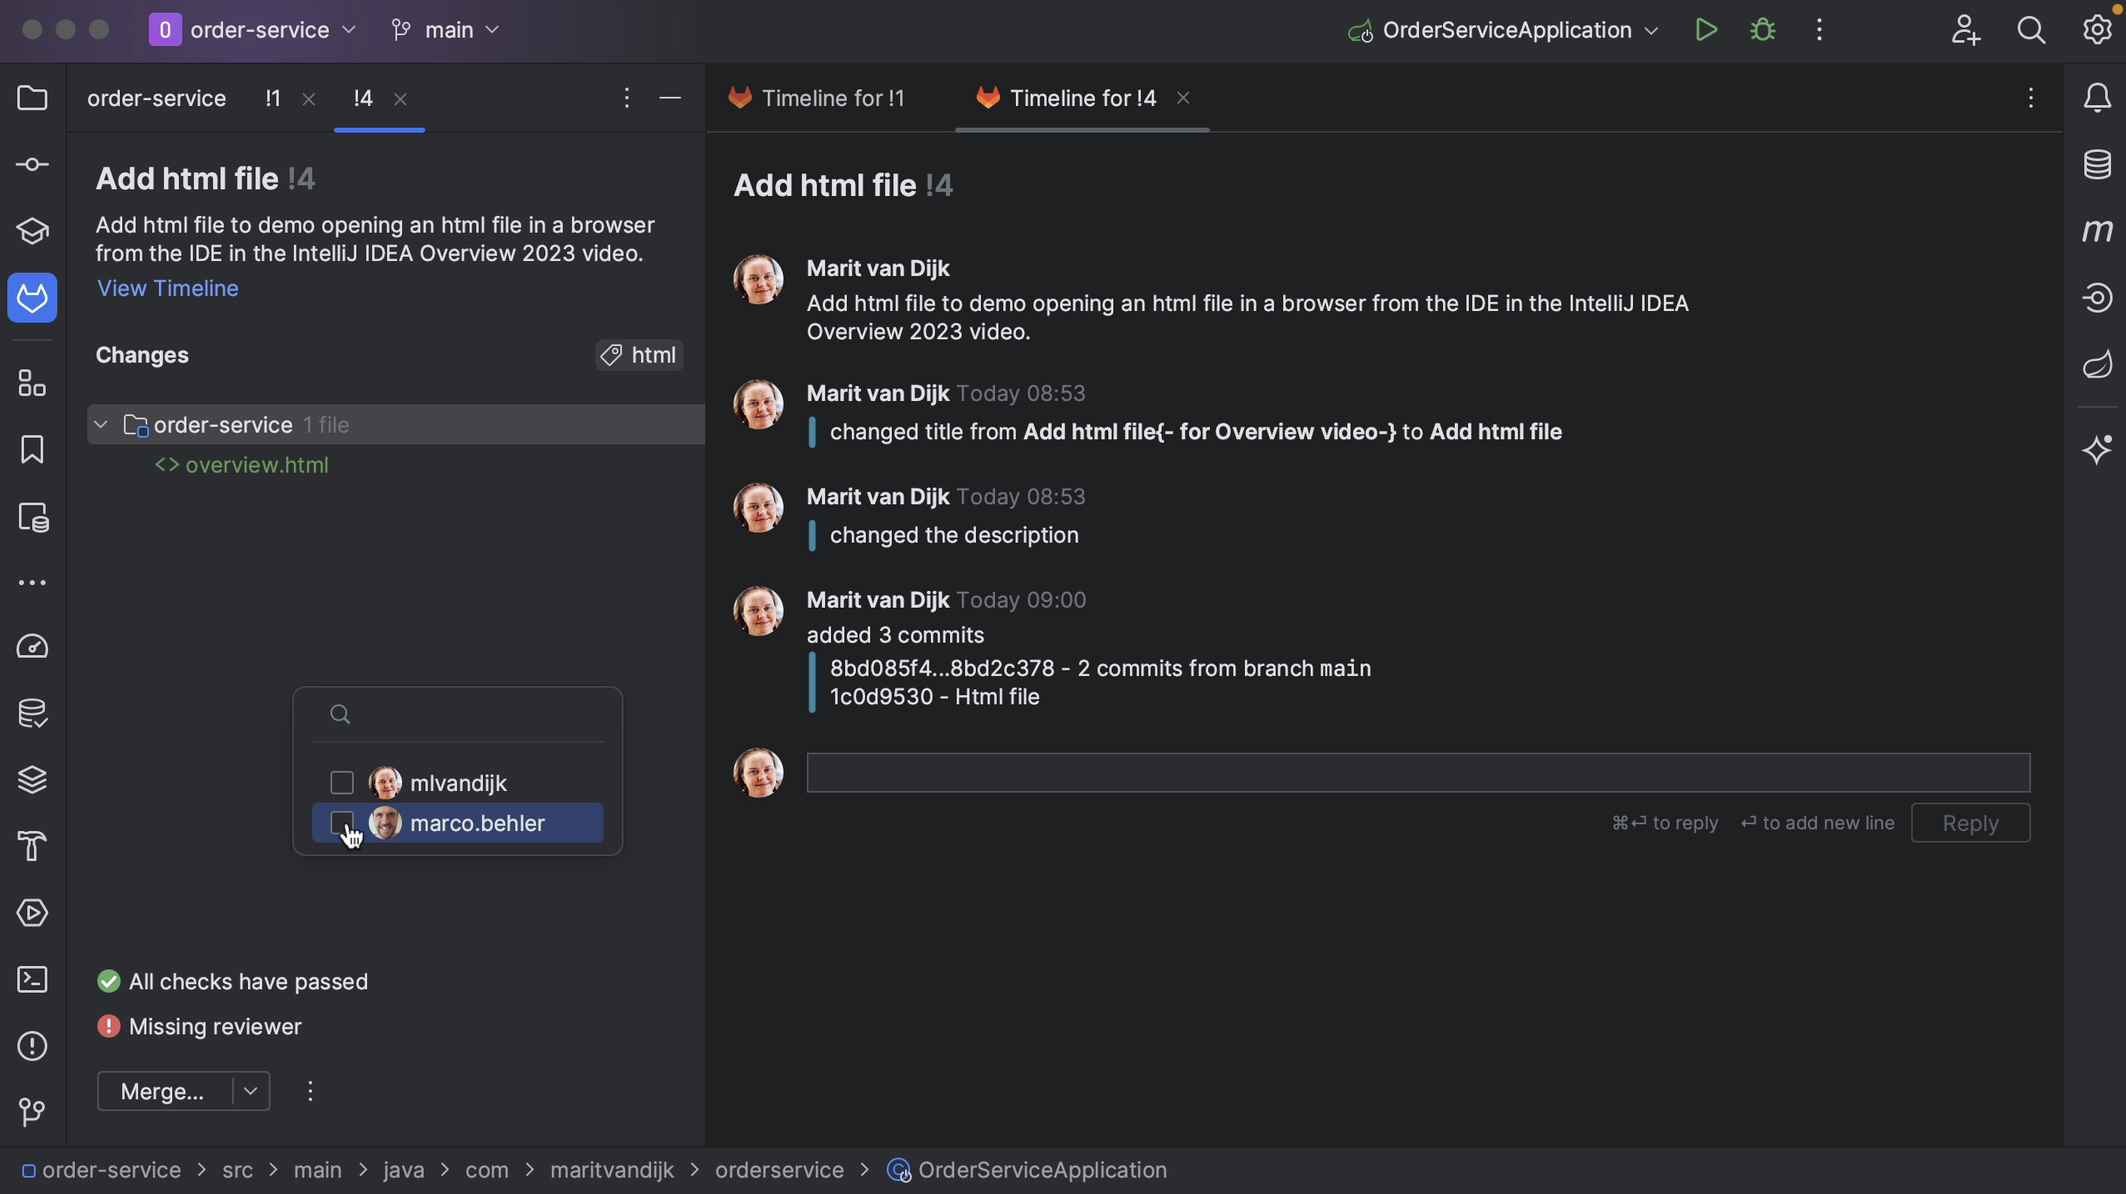
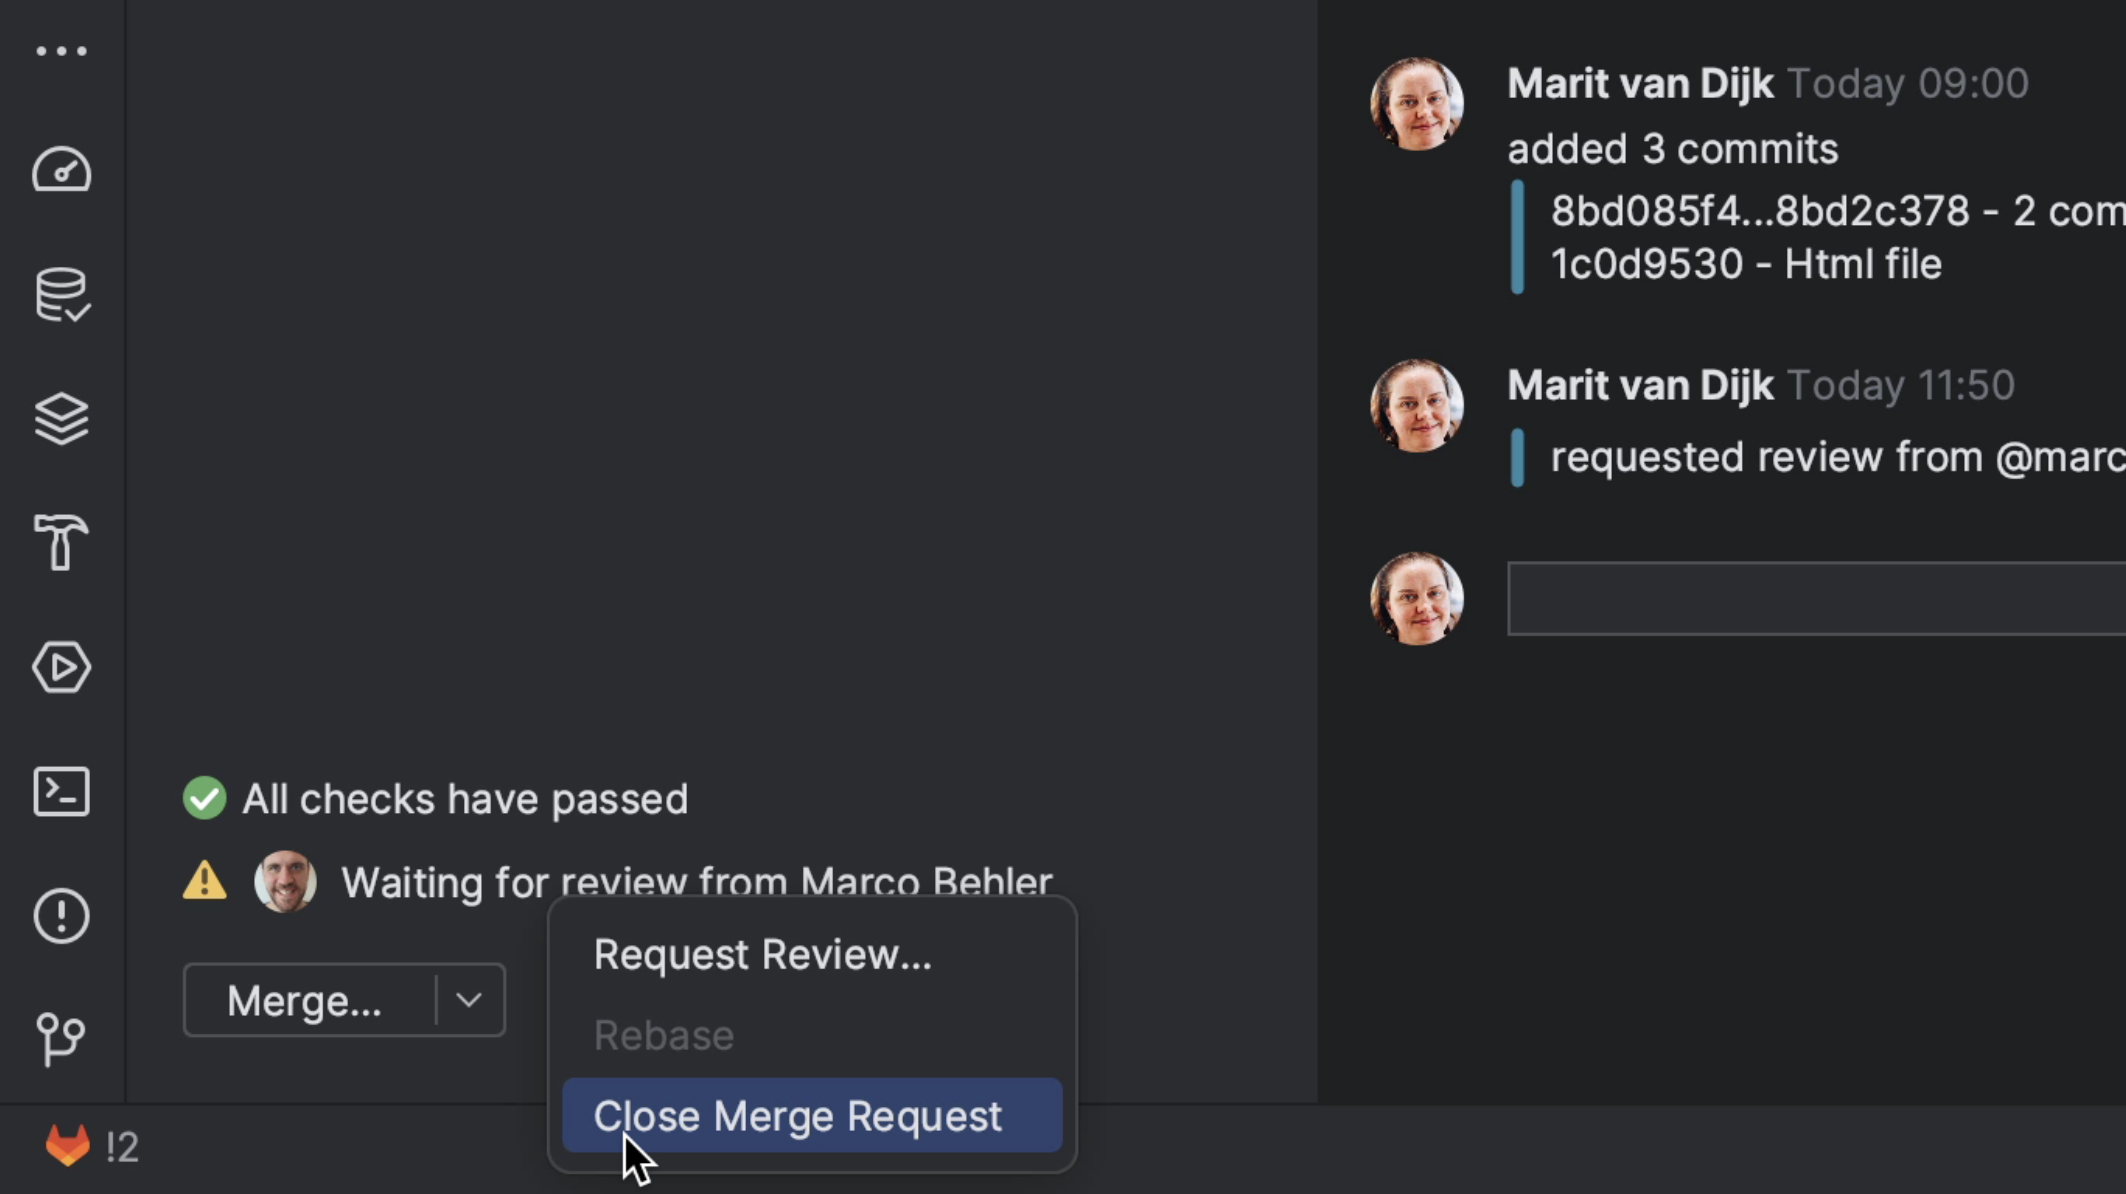
If the Merge Request does not have a reviewer assigned, we can assign one from the Merge Request tool window in IntelliJ IDEA. Click the three dots at the bottom left of the Merge Request details and select the action Request Review. From the list that pops up, select the reviewer(s) to assign this Merge Request to.
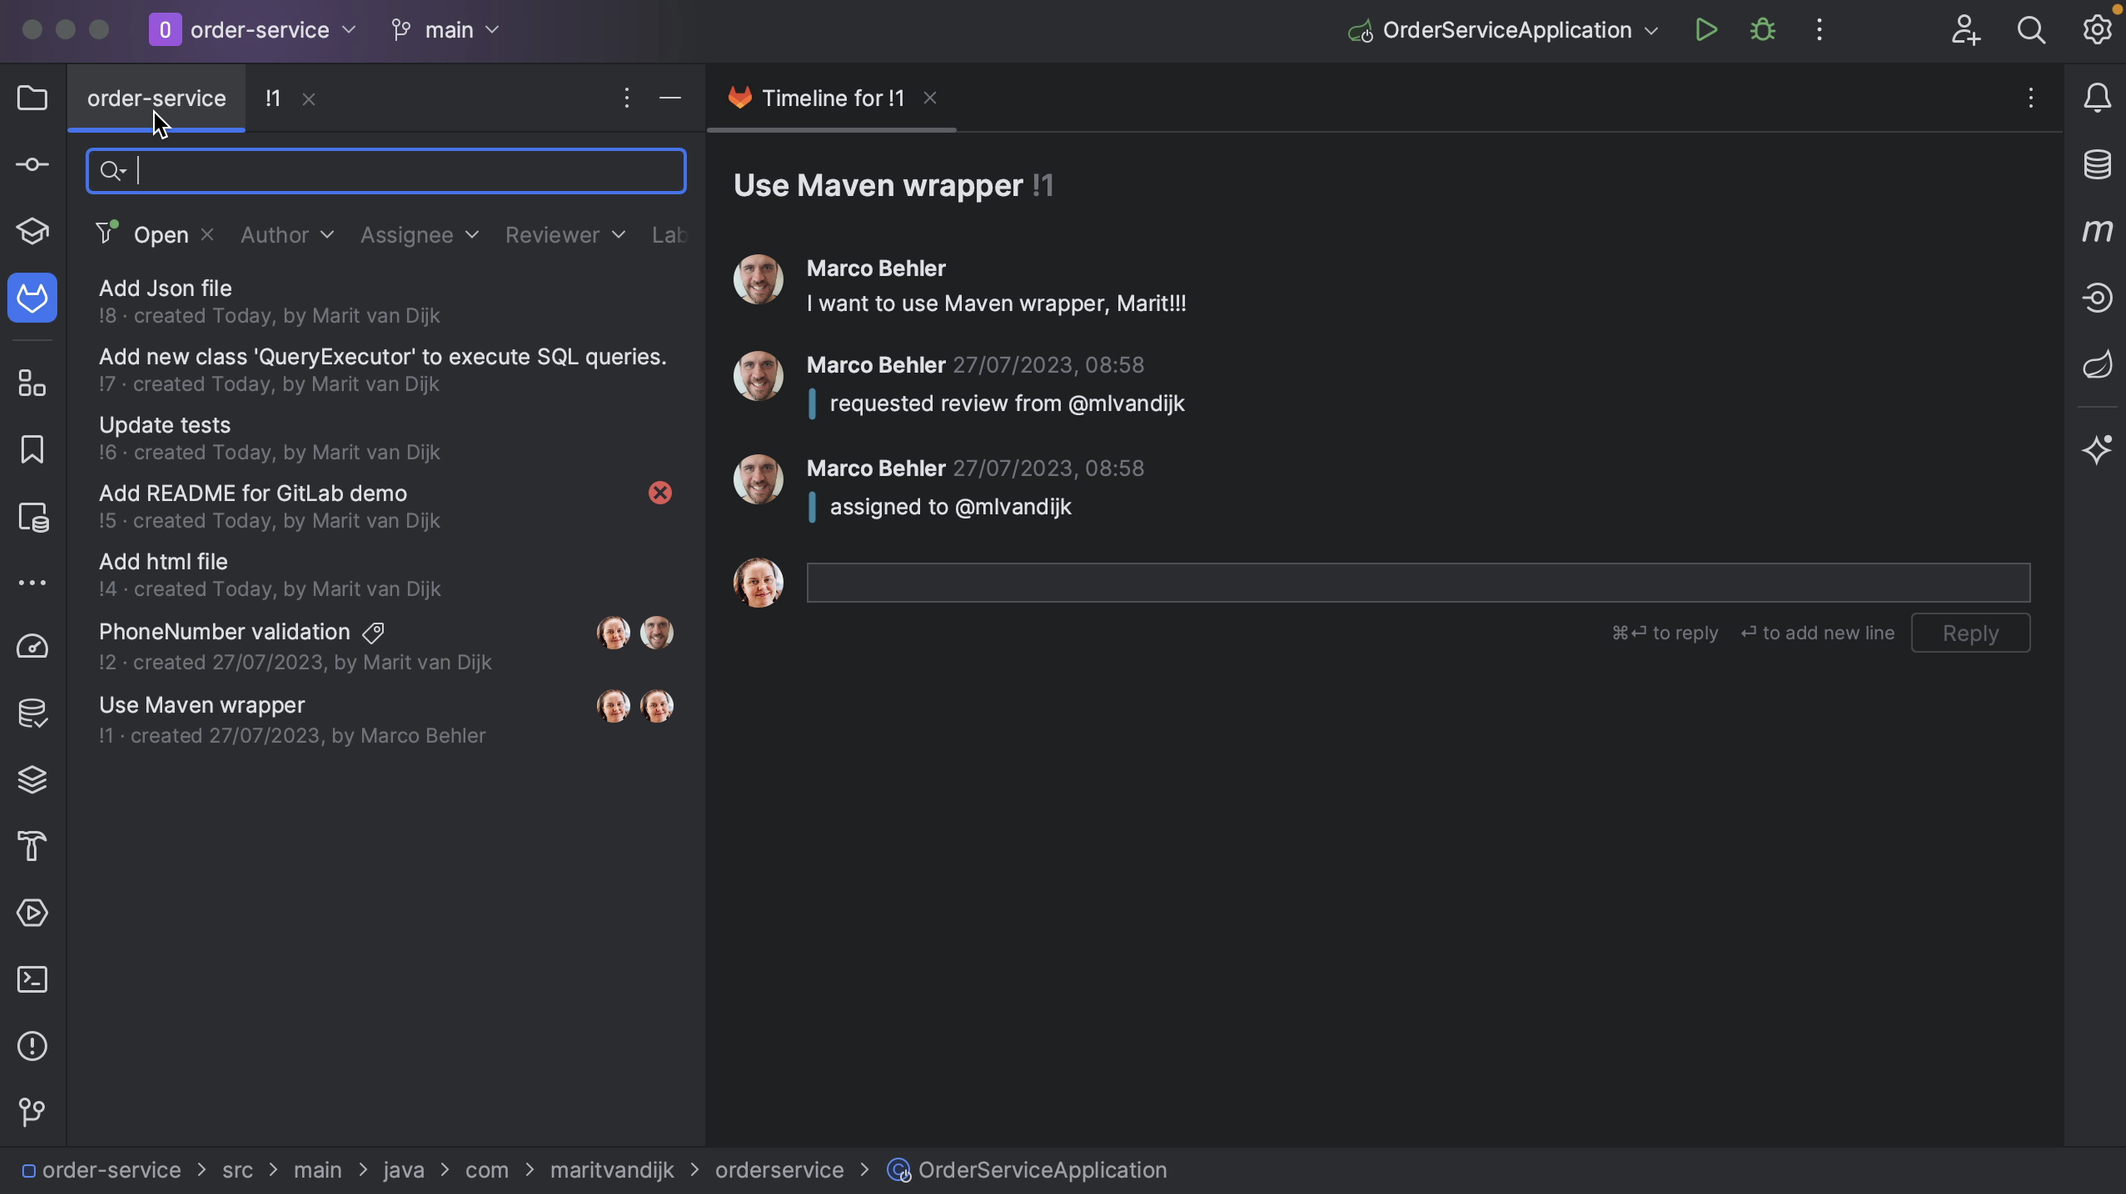
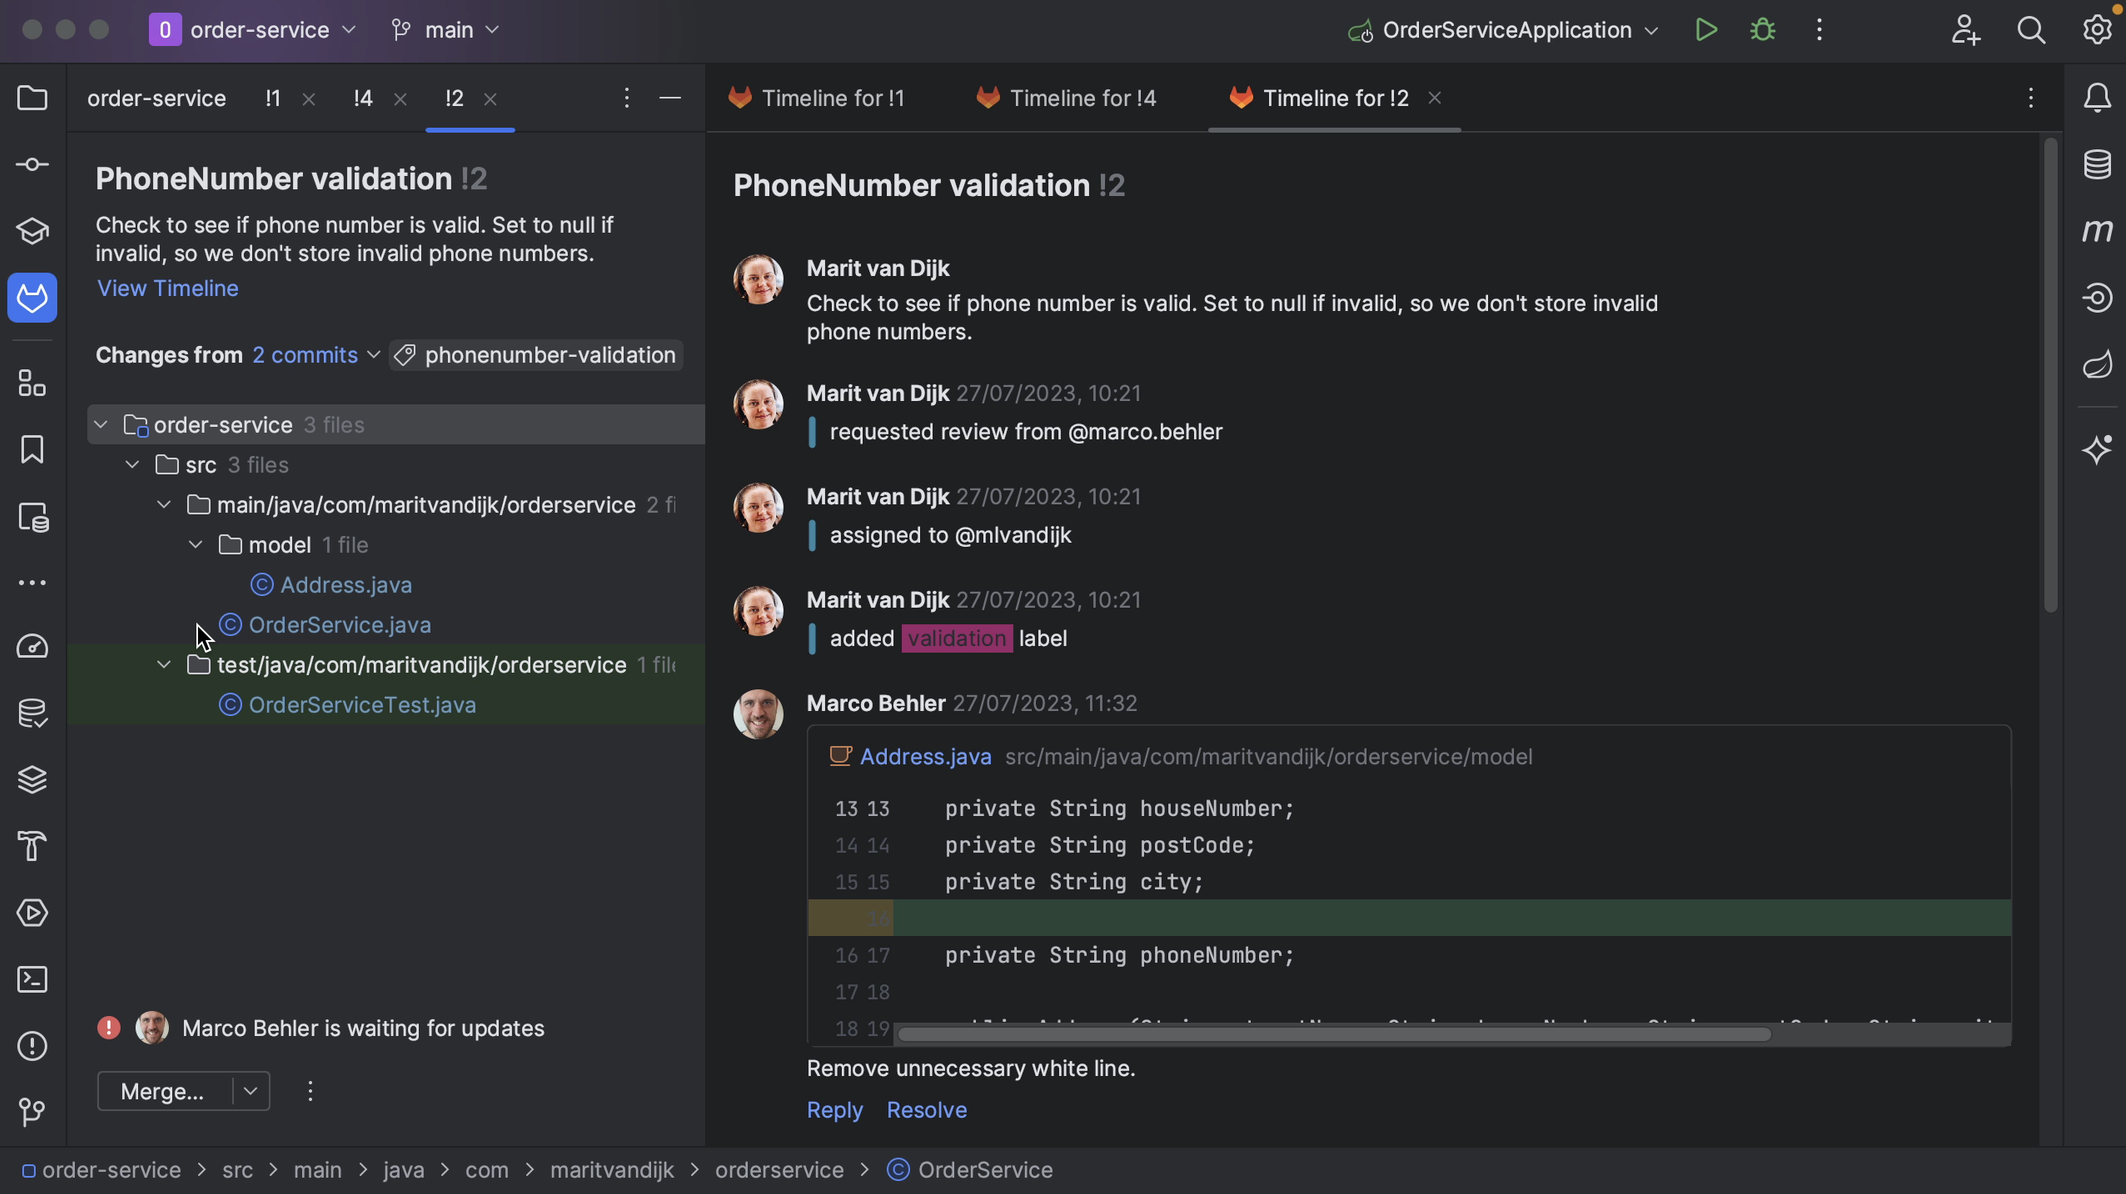
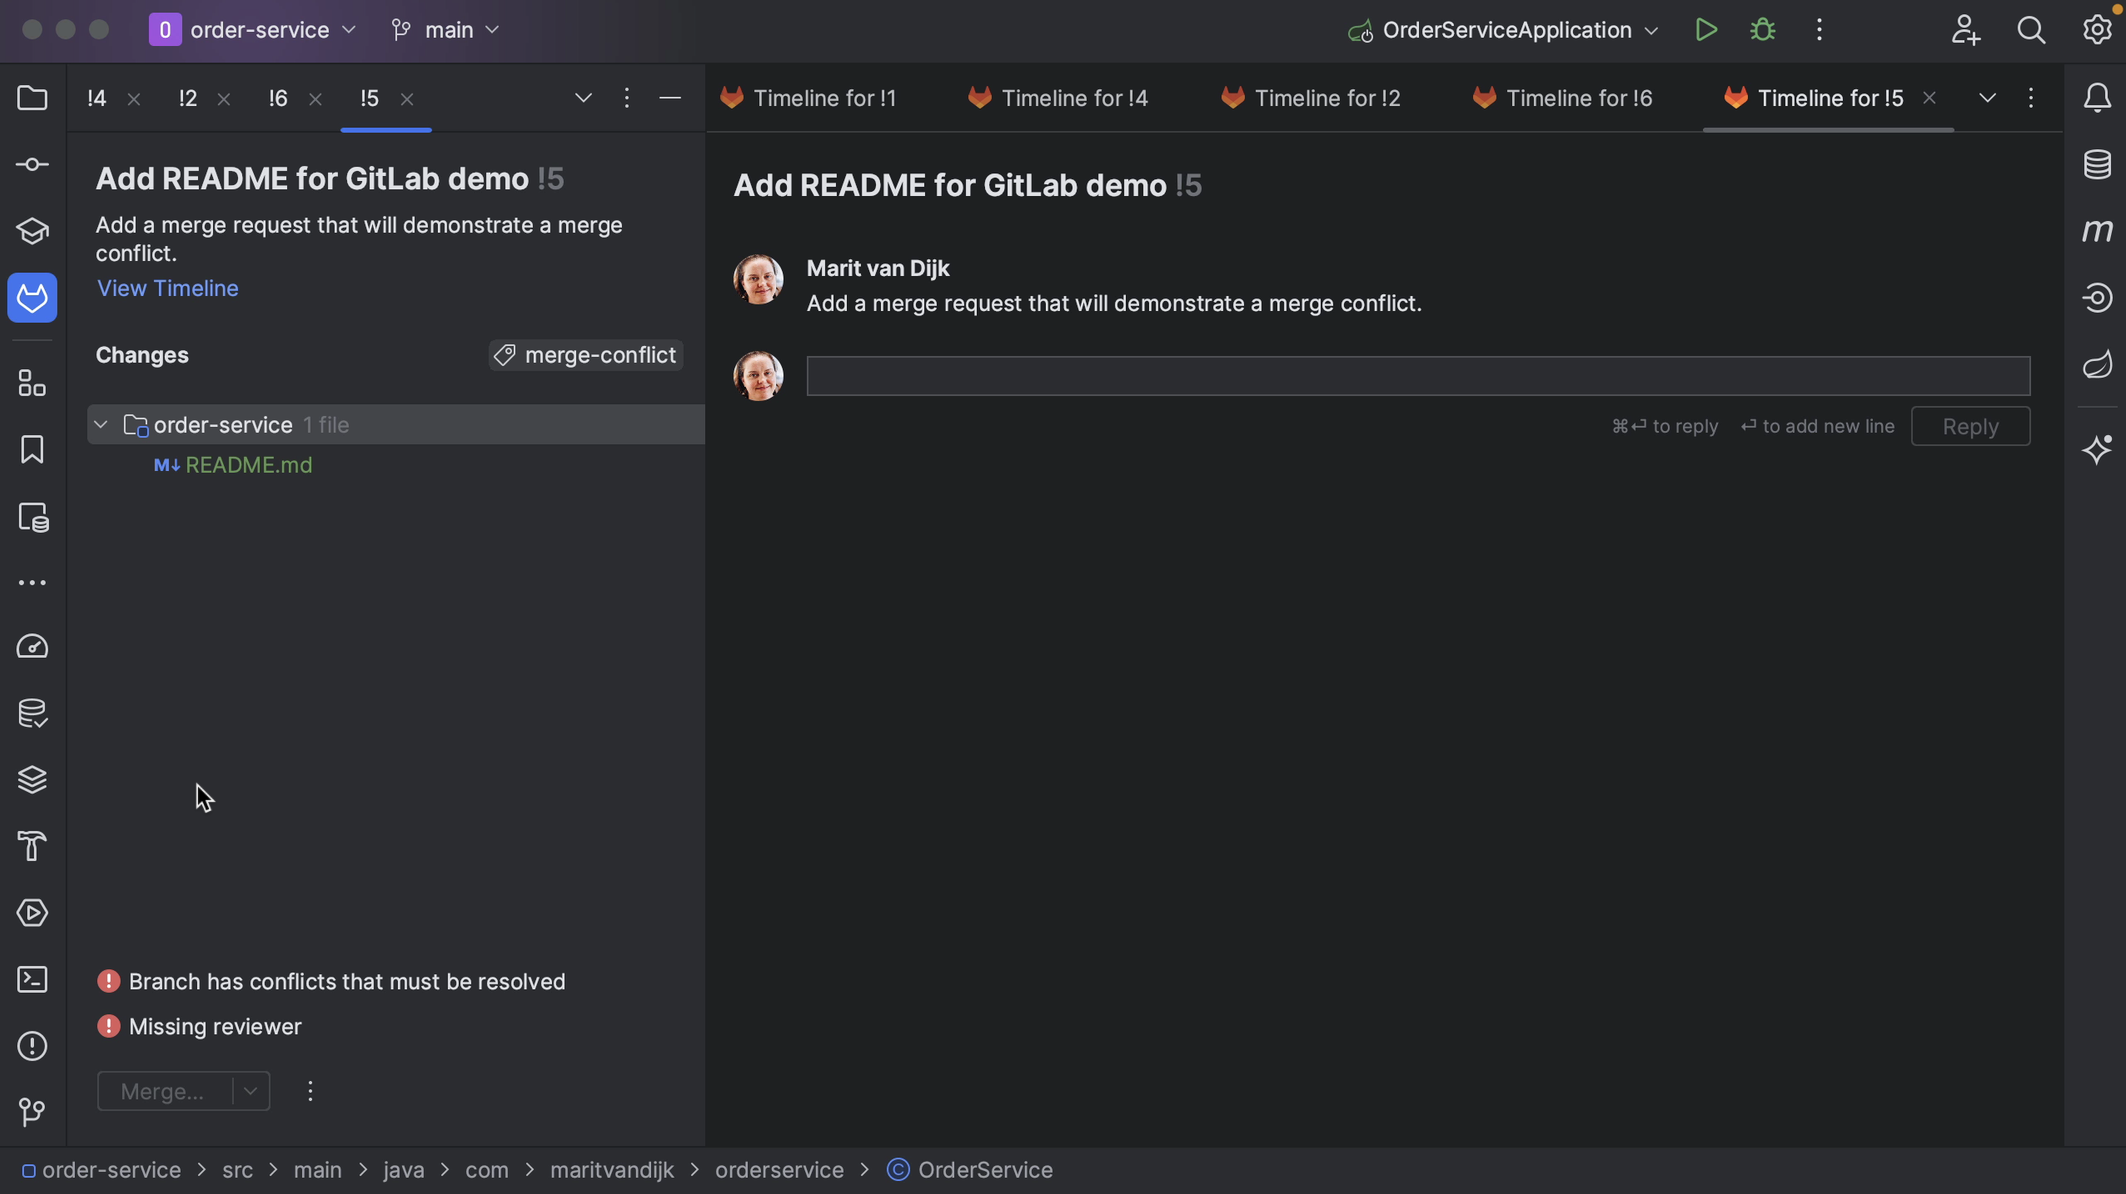
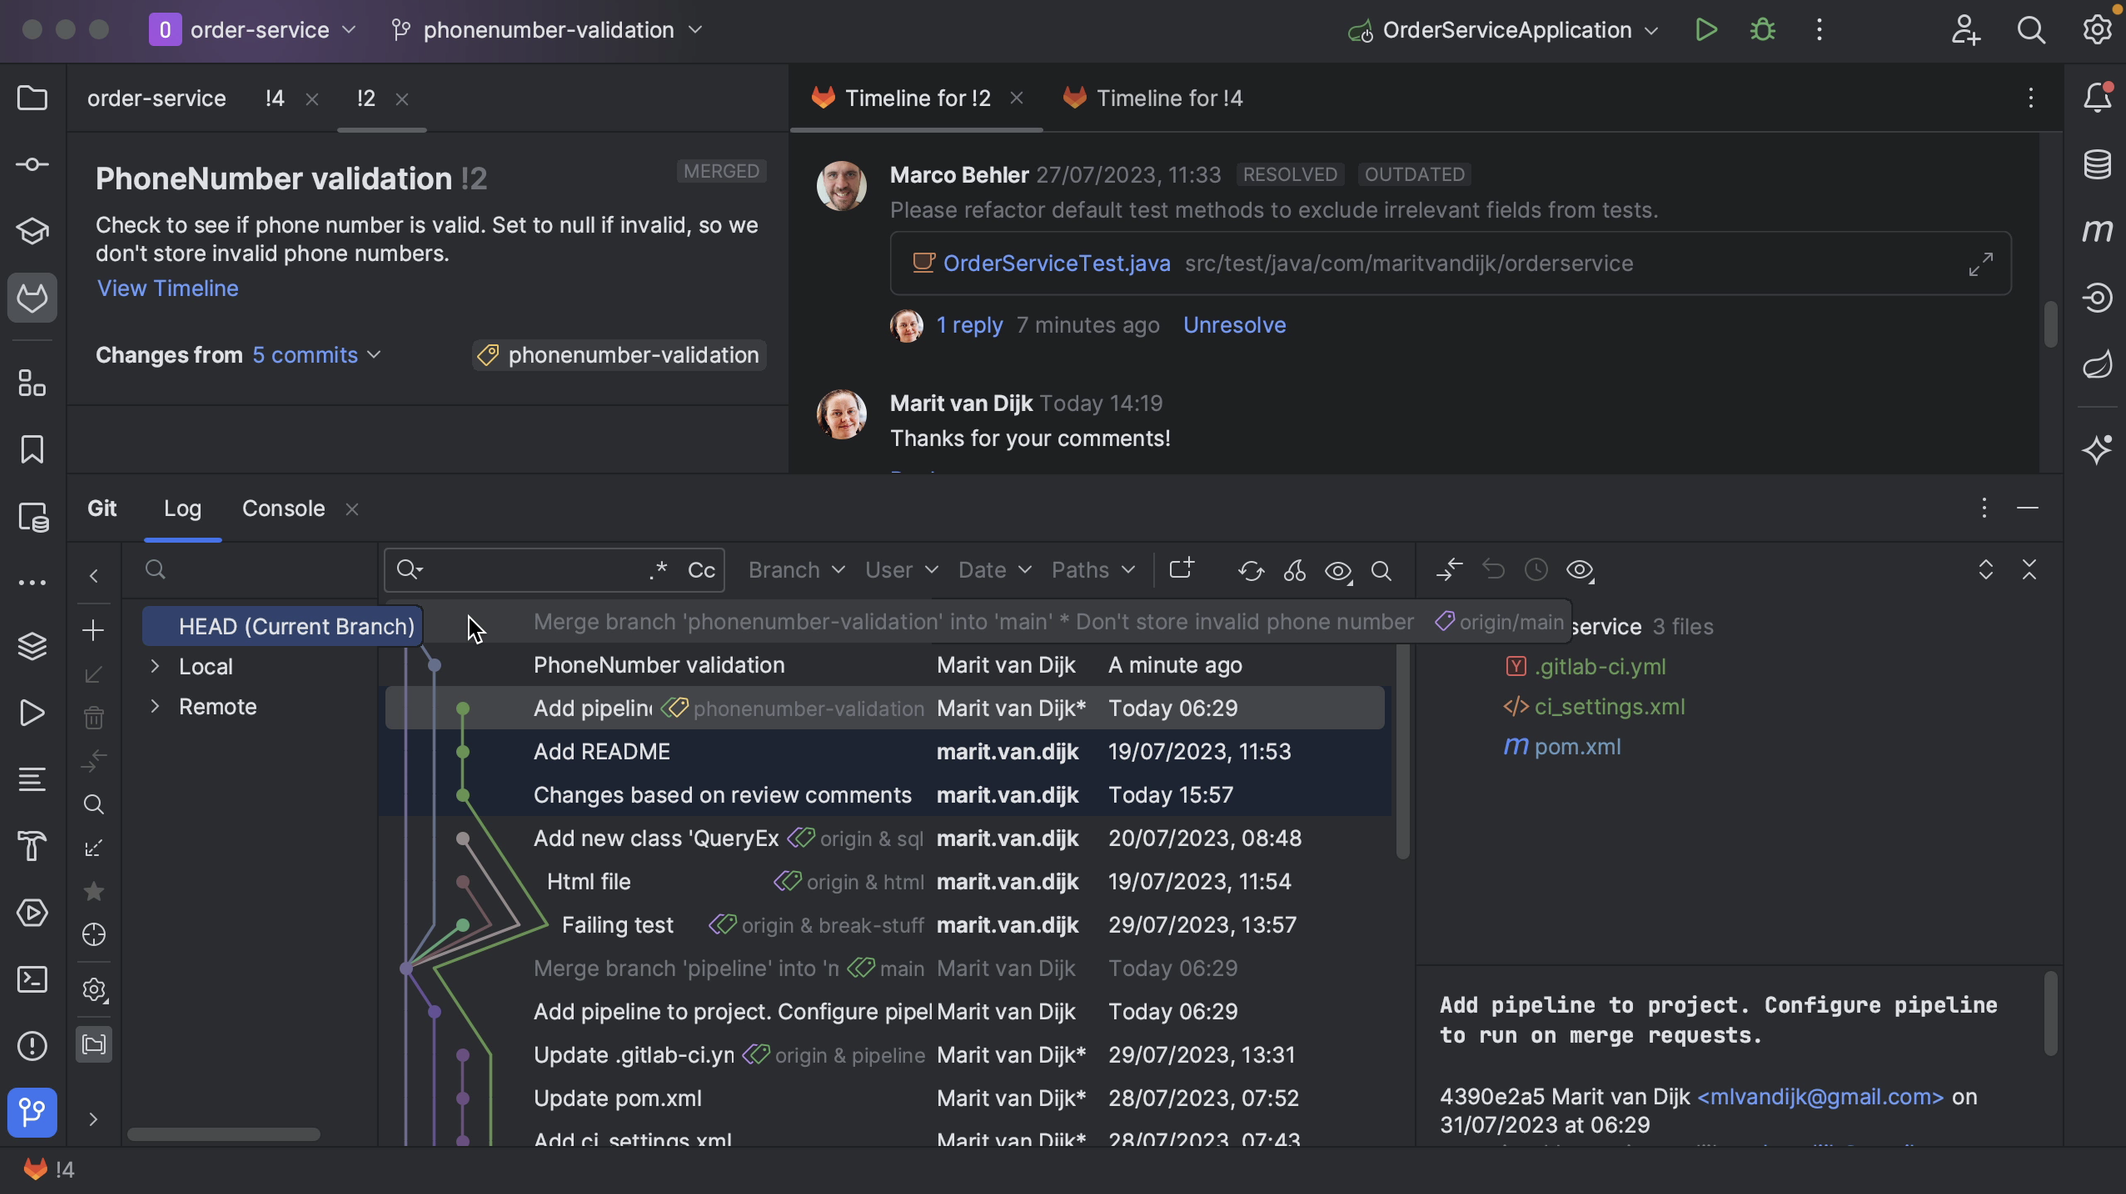
We can see the files that have been changed in the Merge Request in the bottom left window, and the timeline in the main editor pane.
We can also select a file to see the diff as well as the comments for that file. We can go back to the timeline by clicking View Timeline.
The timeline shows the same information as the GitLab Merge Request activity page. The timeline shows activity on the Merge Request, including comments and other status changes in the main editor pane. If there are inline comments on the code, we can see them here.
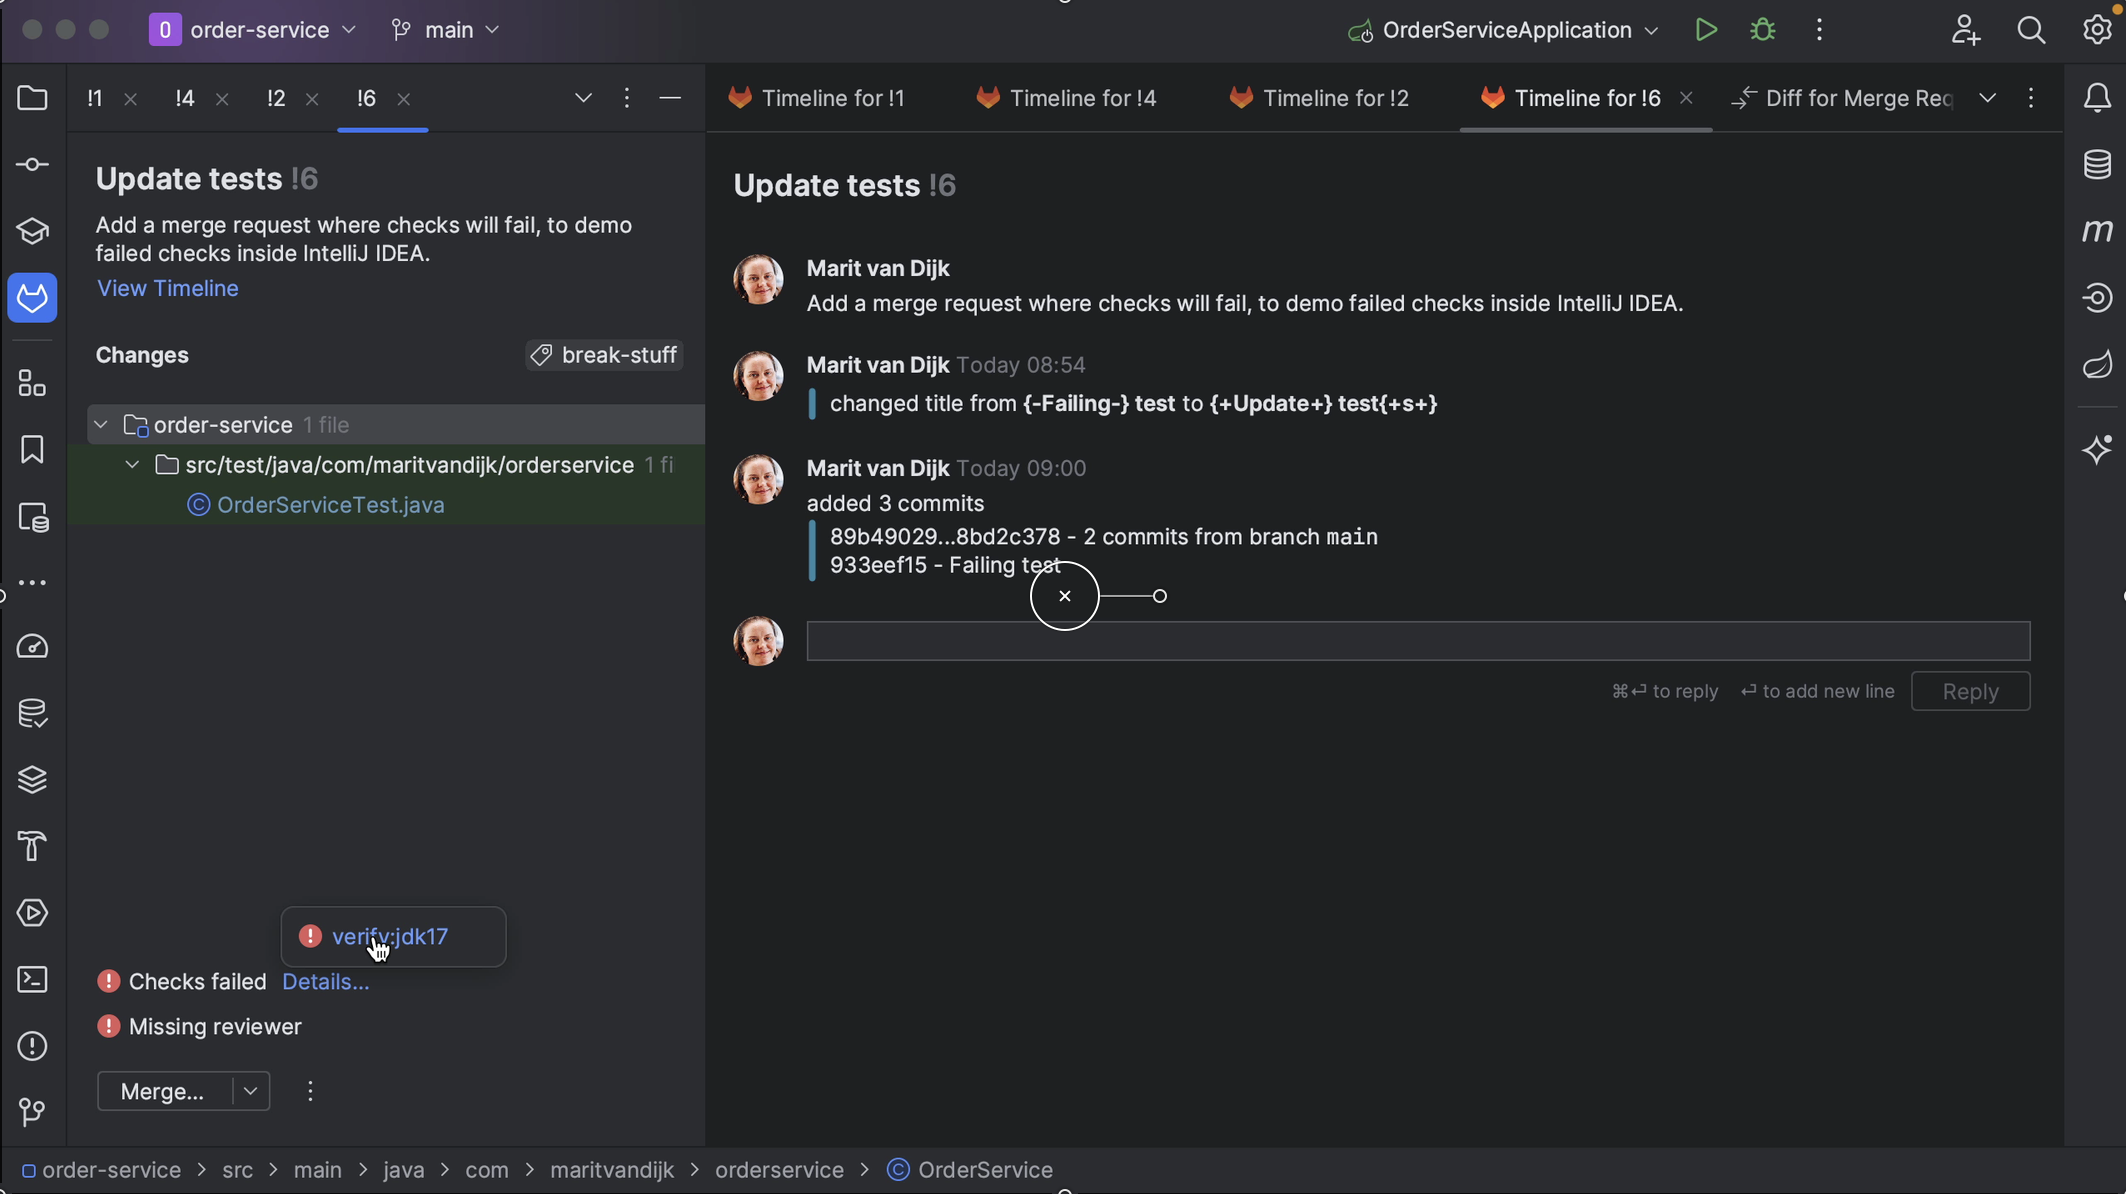
It also shows the result of any checks that were run. We can go to the details to see which checks failed, and even click them to go straight to the failing check on GitLab, so we can look at the details.
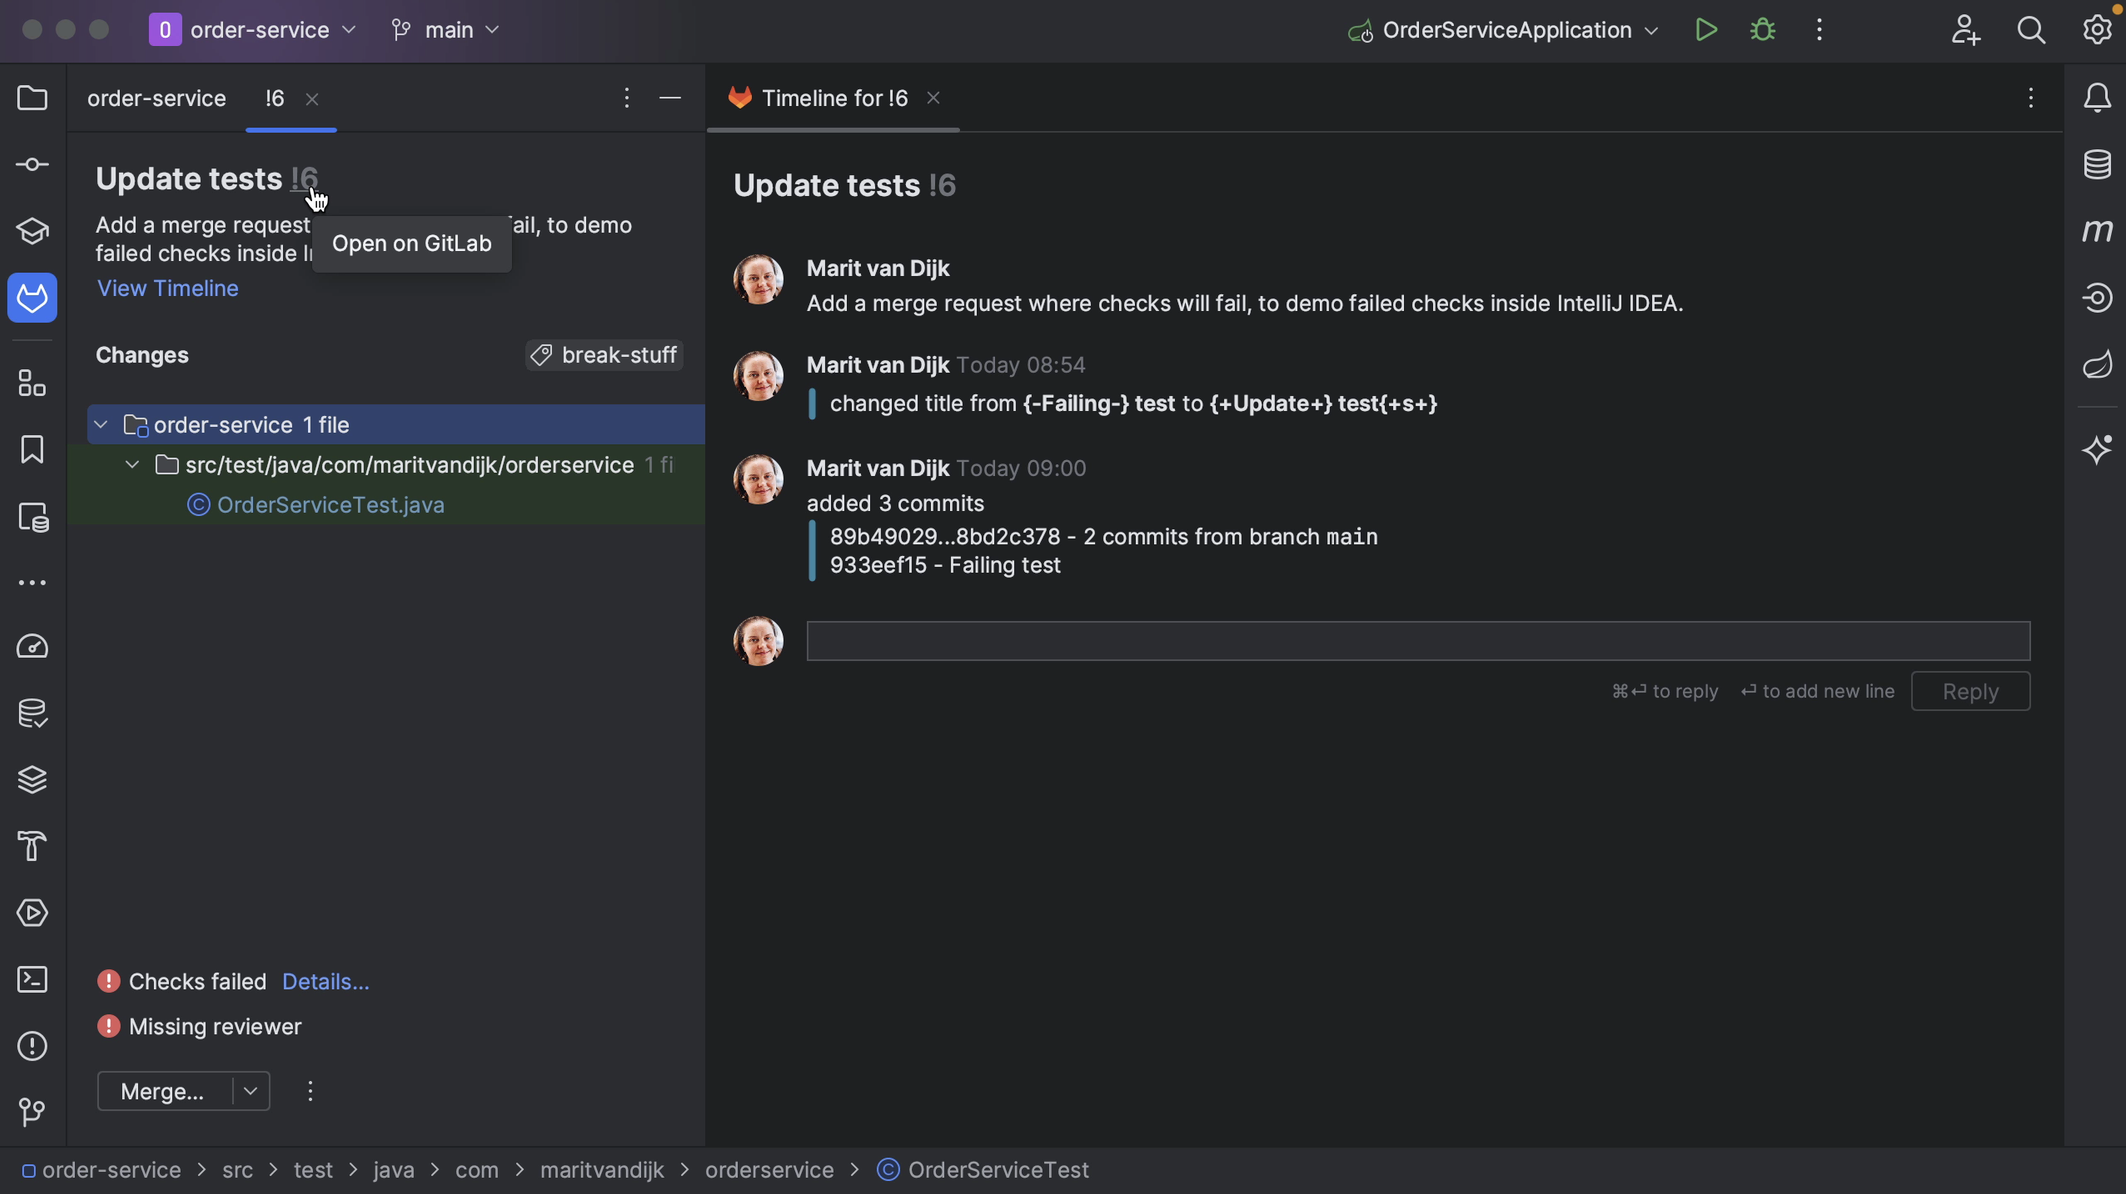
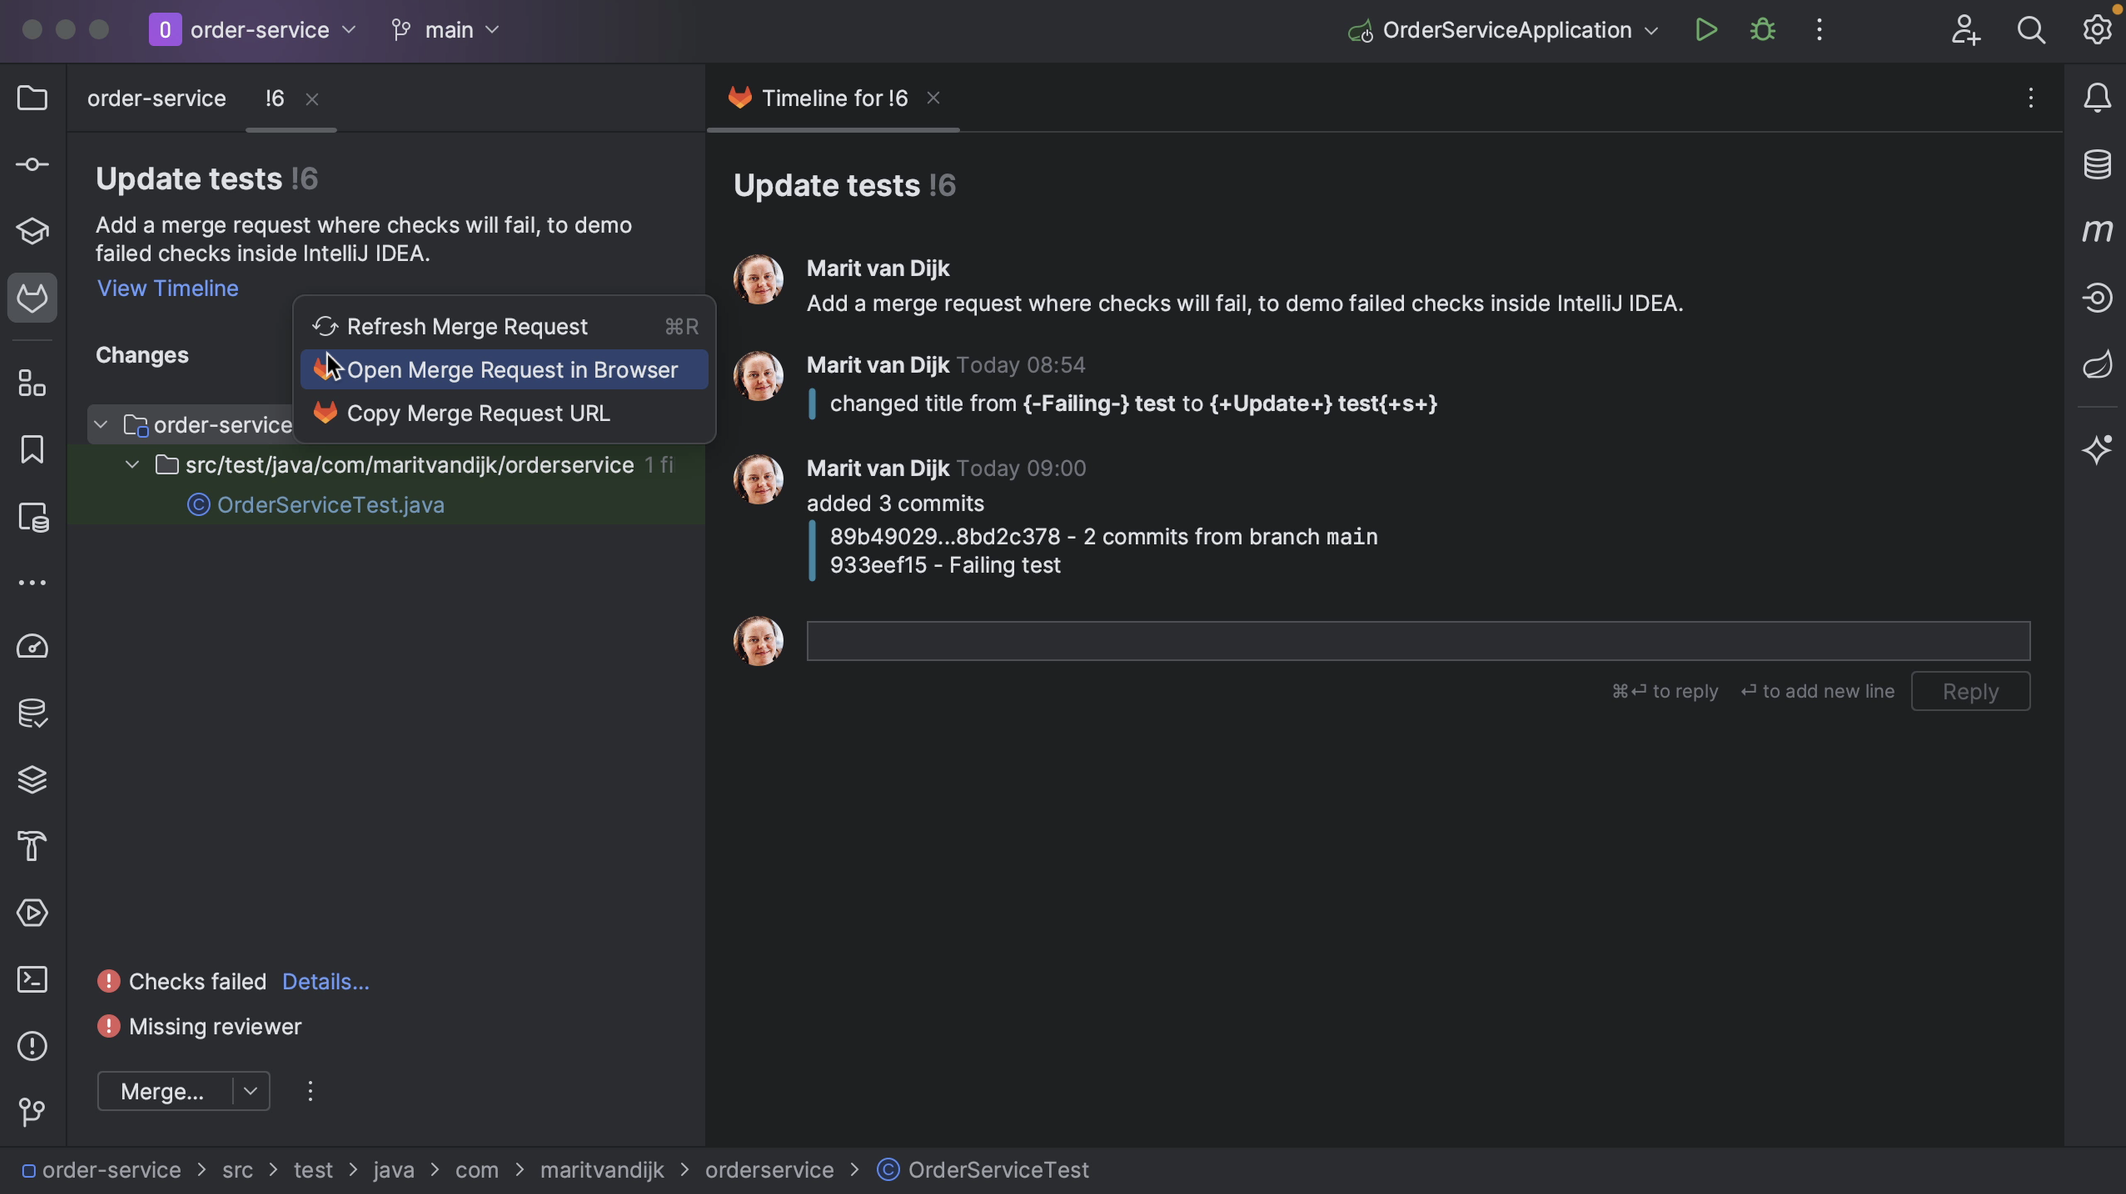
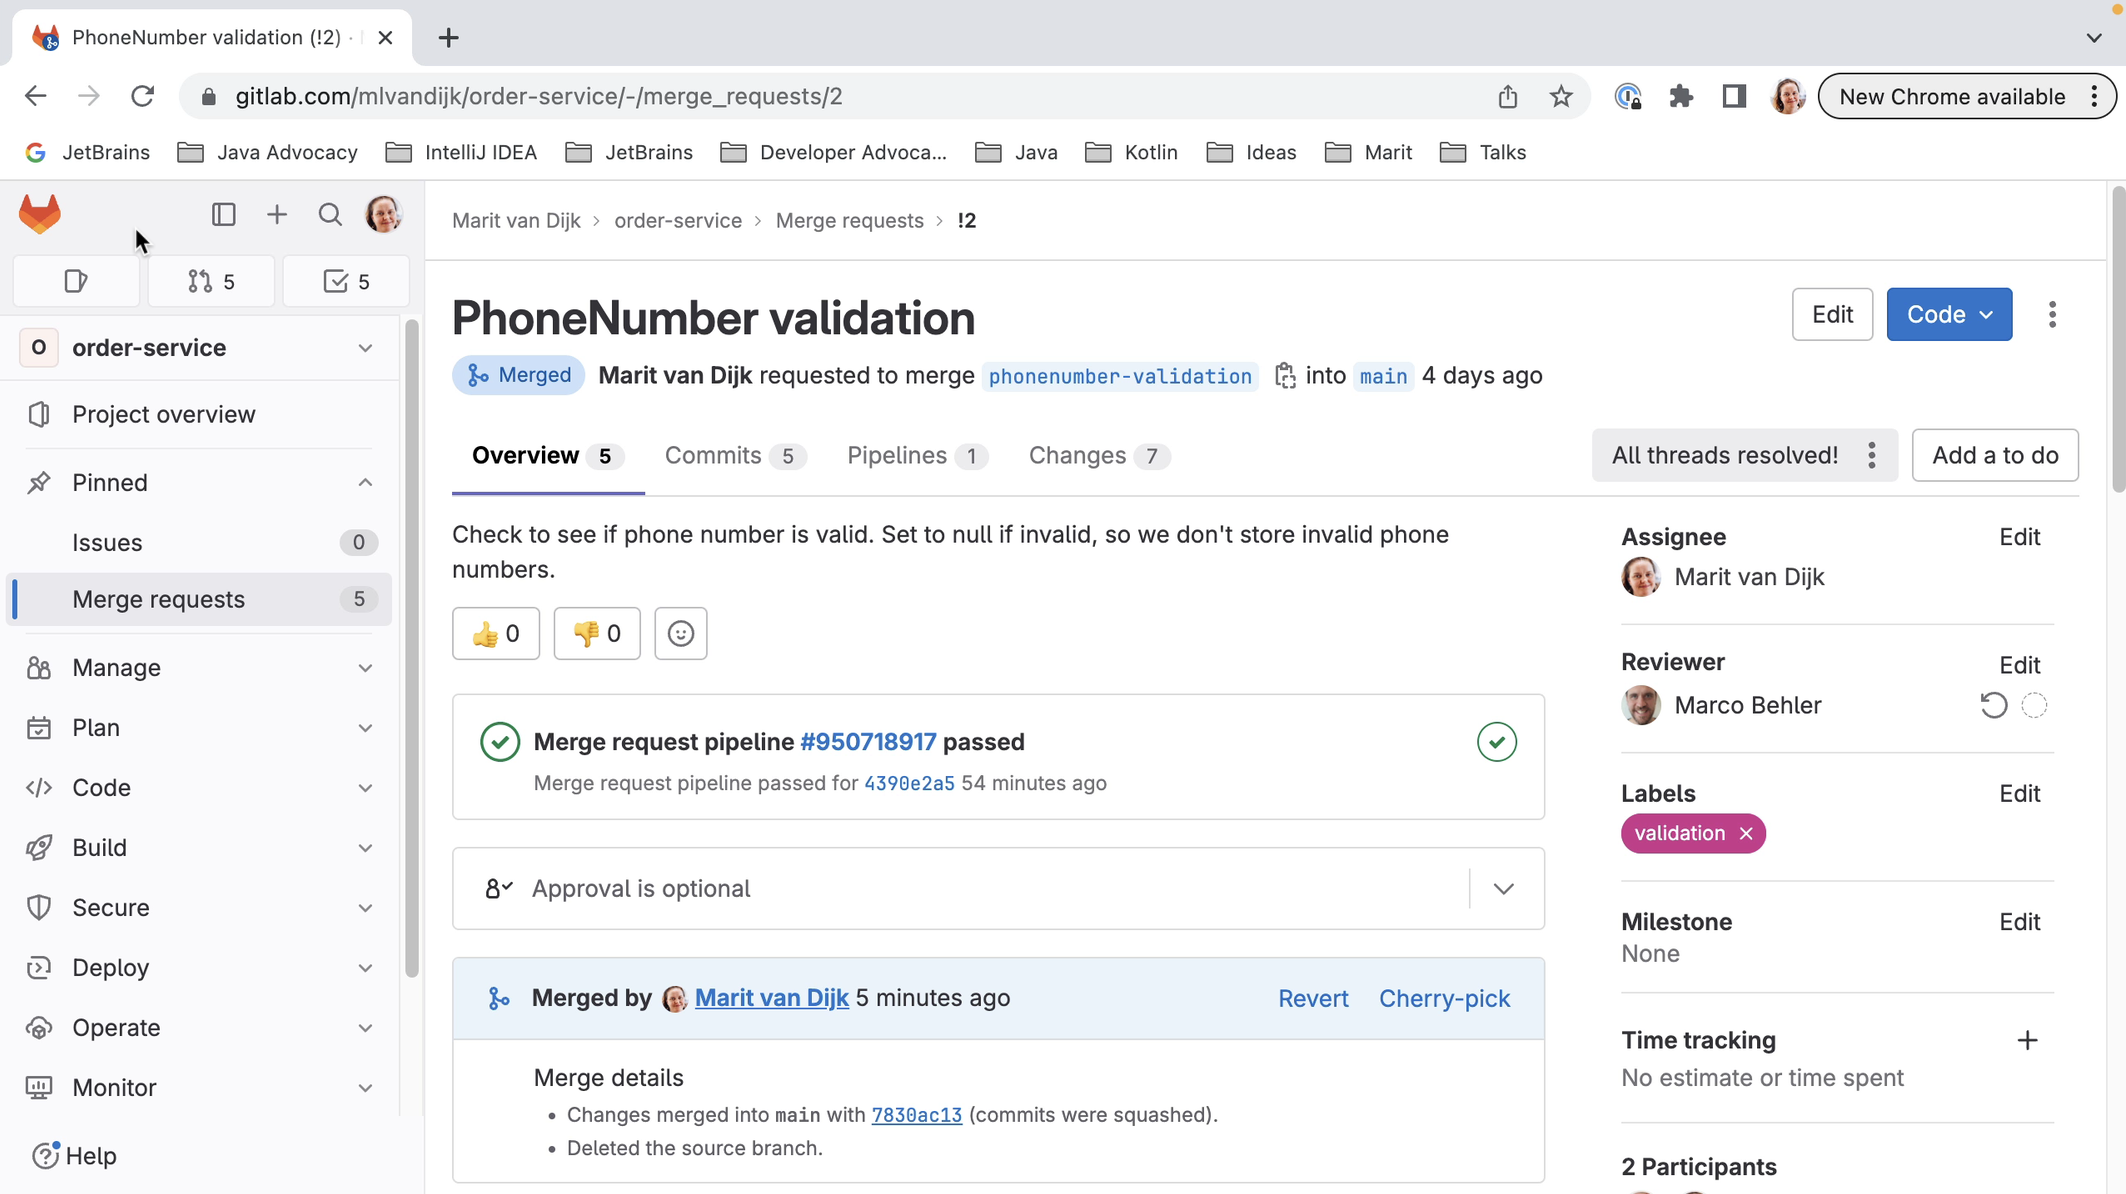
We can open the Merge Request in our browser in several ways. We can right-click the Merge Request number and select Open in Browser. Alternatively, we can open the Merge Request in our browser by right-clicking it, either when it’s already open, or in the list of Merge Requests and selecting Open Merge Request in Browser.
IntelliJ IDEA also shows if there are any conflicts, so we know if this request is safe to merge or not.
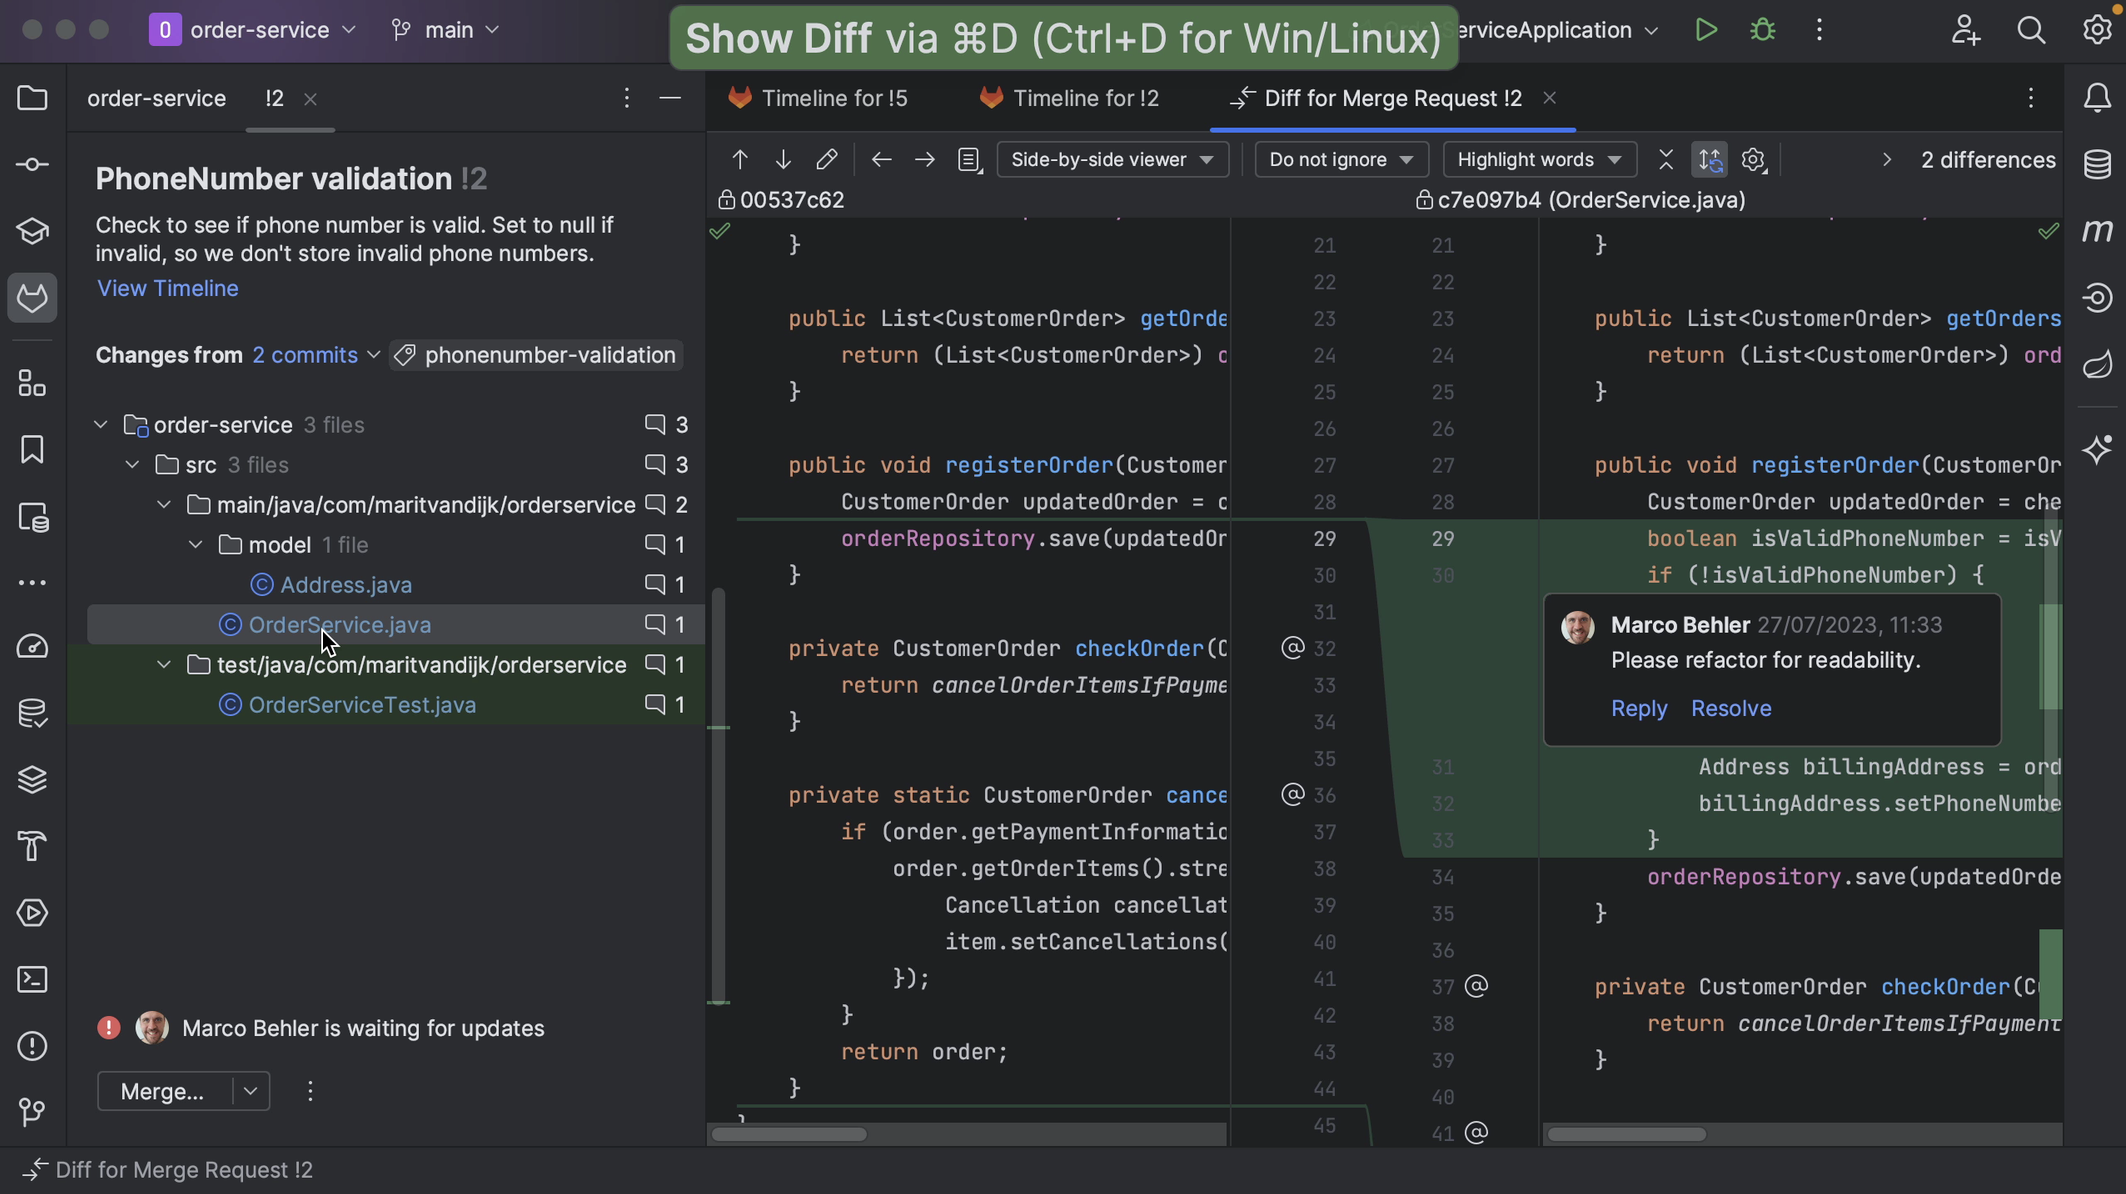
We can open any of the files that make up the Merge Request, and IntelliJ IDEA will show them in the diff viewer, so we can have a closer look at the changes that make up the Merge Request. Inline comments will be displayed in the diff view too. Alternatively, we can open the diff view by selecting the file and using the shortcut for Show Diff (⌘D on macOS | Ctrl+D on Windows/Linux).
If the Merge Request contains changes to multiple files, we can navigate between those files. We can do so using the arrows at the top of the diff viewer, or using the shortcuts to Compare Next File (⌃⇧→ on macOS | Alt+→ on Windows/Linux) or Compare Previous File (⌃⇧← on macOS |Alt+← on Windows/Linux).
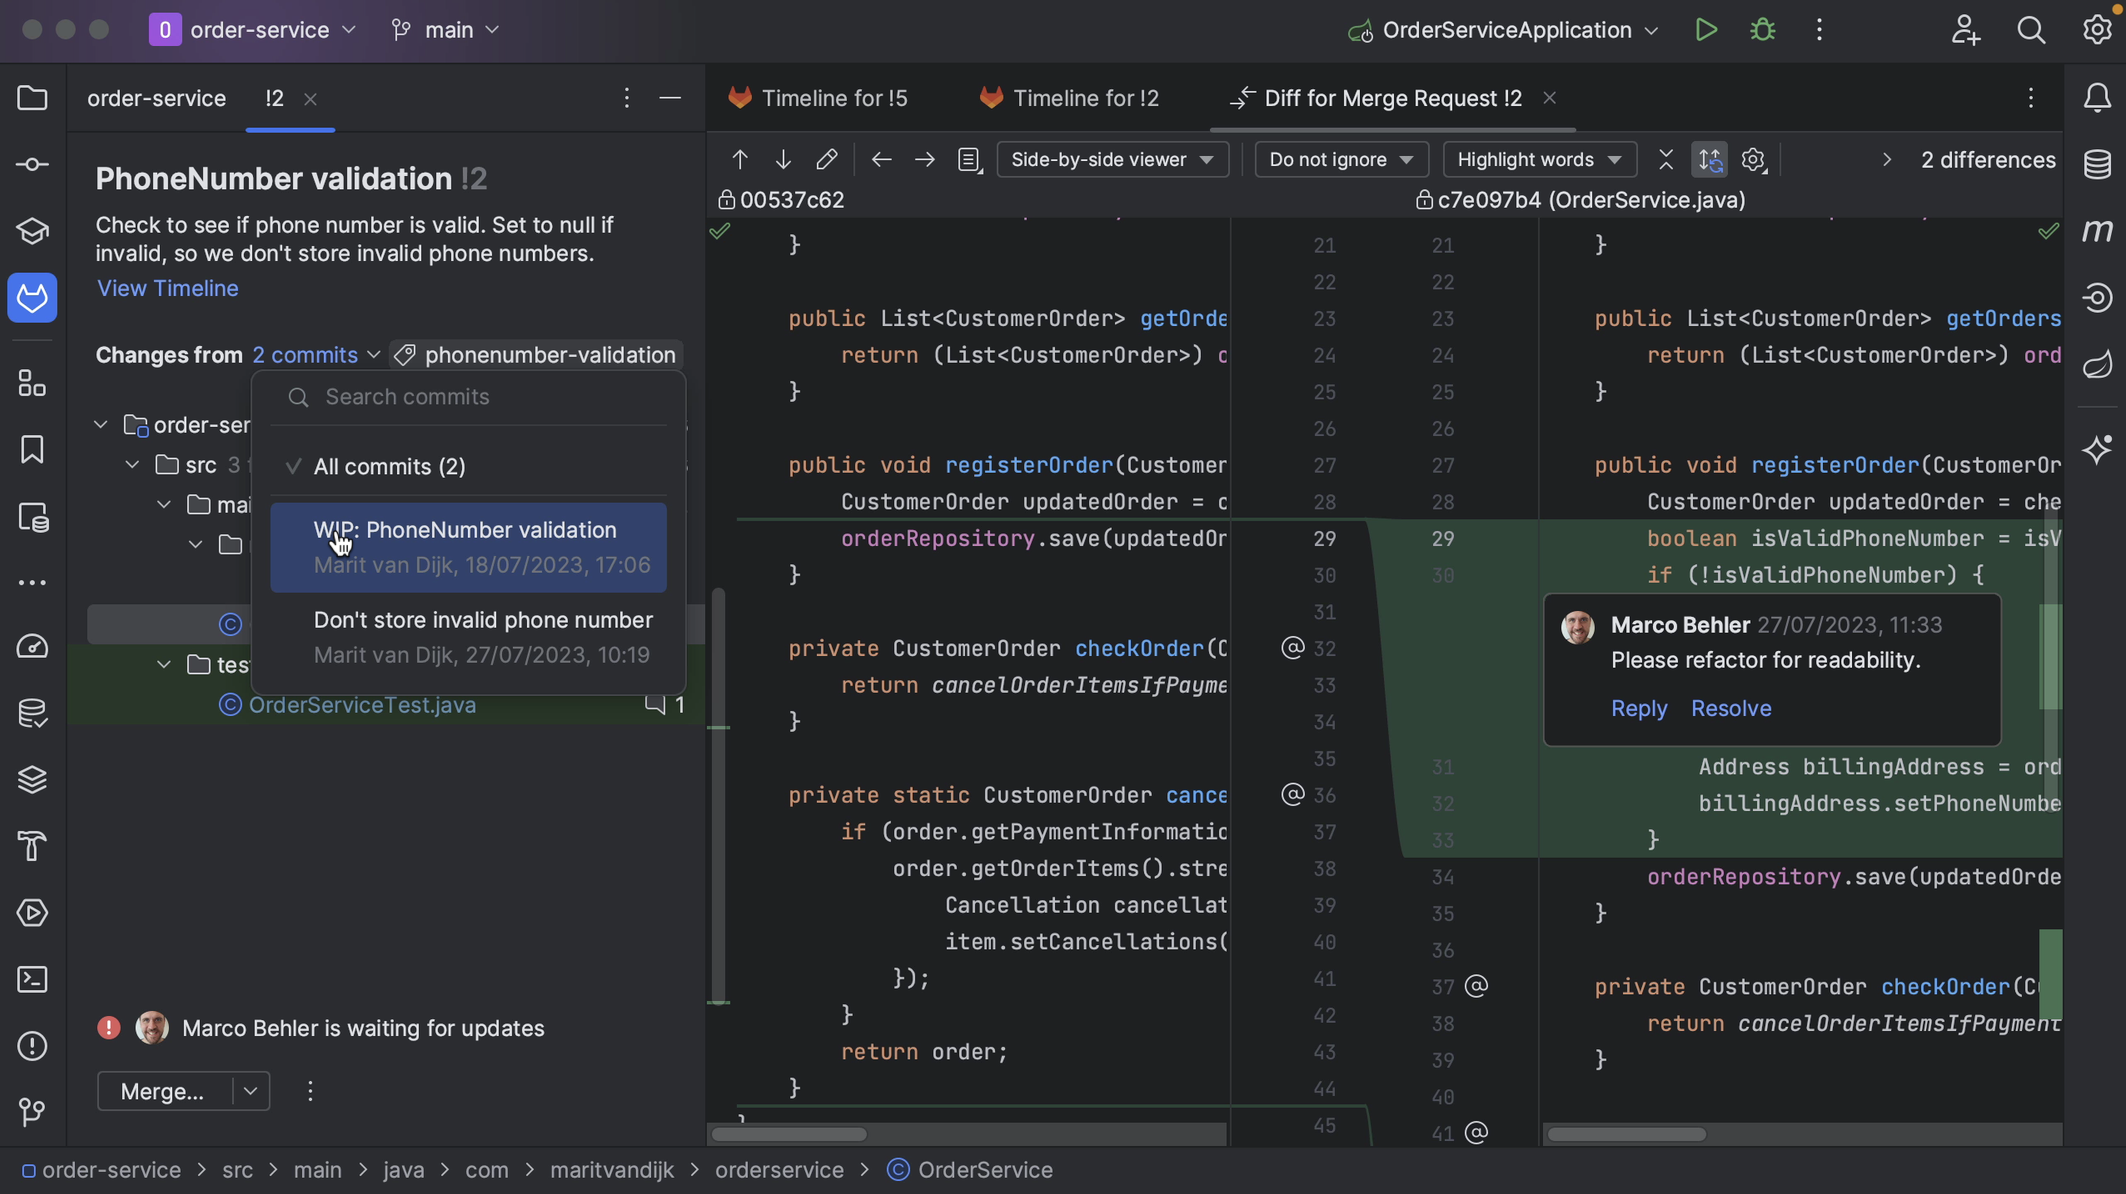
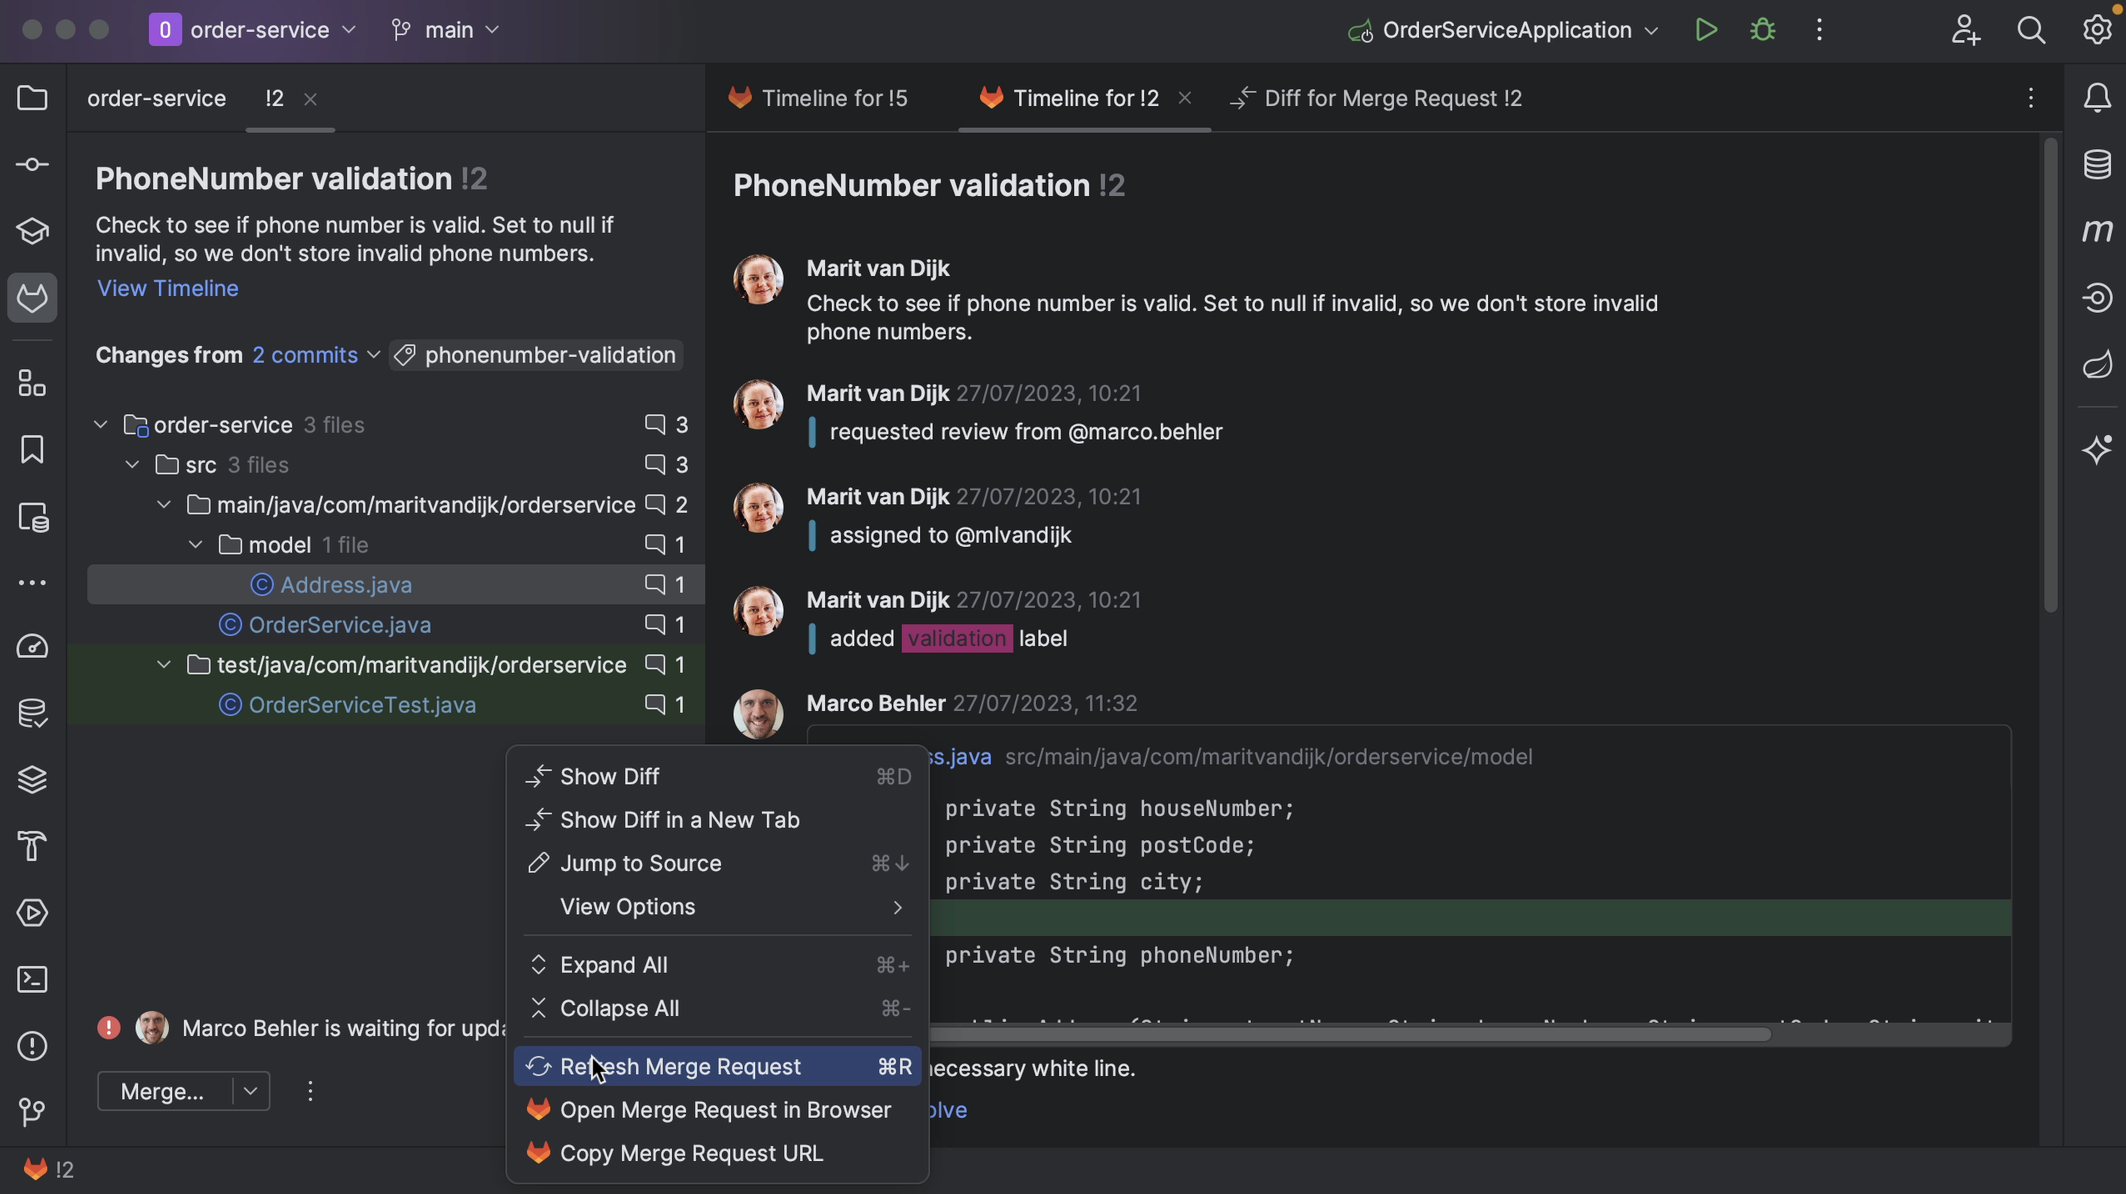
If the Merge Request consists of multiple commits, we can see the individual commits in the Changes from dropdown list. We can look at the changes for an individual commit if we want.
We can also see the number of comments for the Merge Request, and for each file.
We can Hide All Windows (⇧⌘F12 on macOS | Ctrl+Shift+F12 on Windows/Linux) to focus on the diff. We can Restore Windows using the same shortcut.
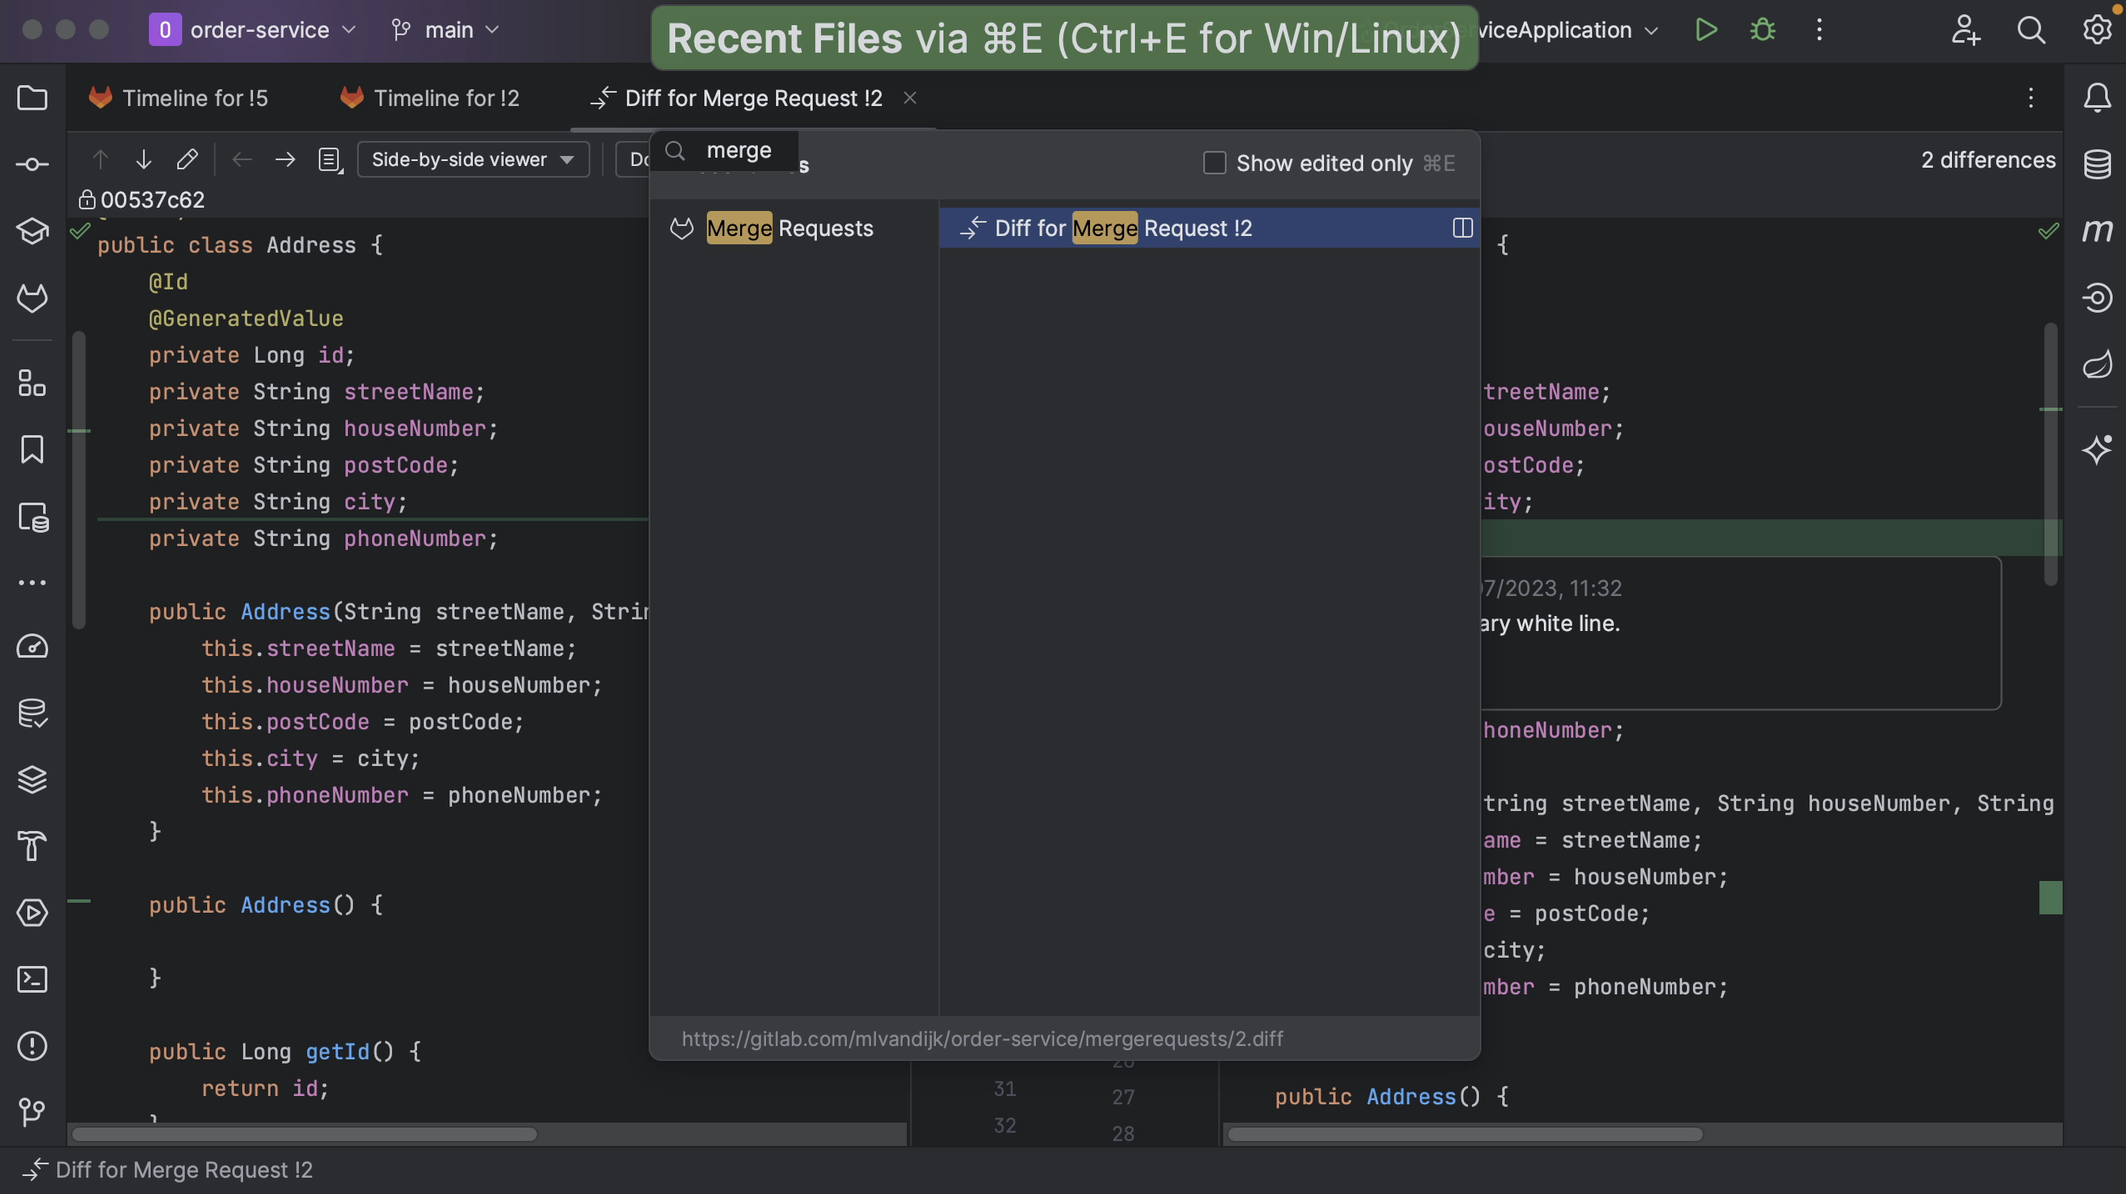
Alternatively, we can reopen the Merge Requests window by opening the Recent Files dialog (⌘ E on macOS | Ctrl+E on Windows/Linux), which also lets us open up any of the Tool Windows. Here we can search for “merge” to find the Merge Request tool window.
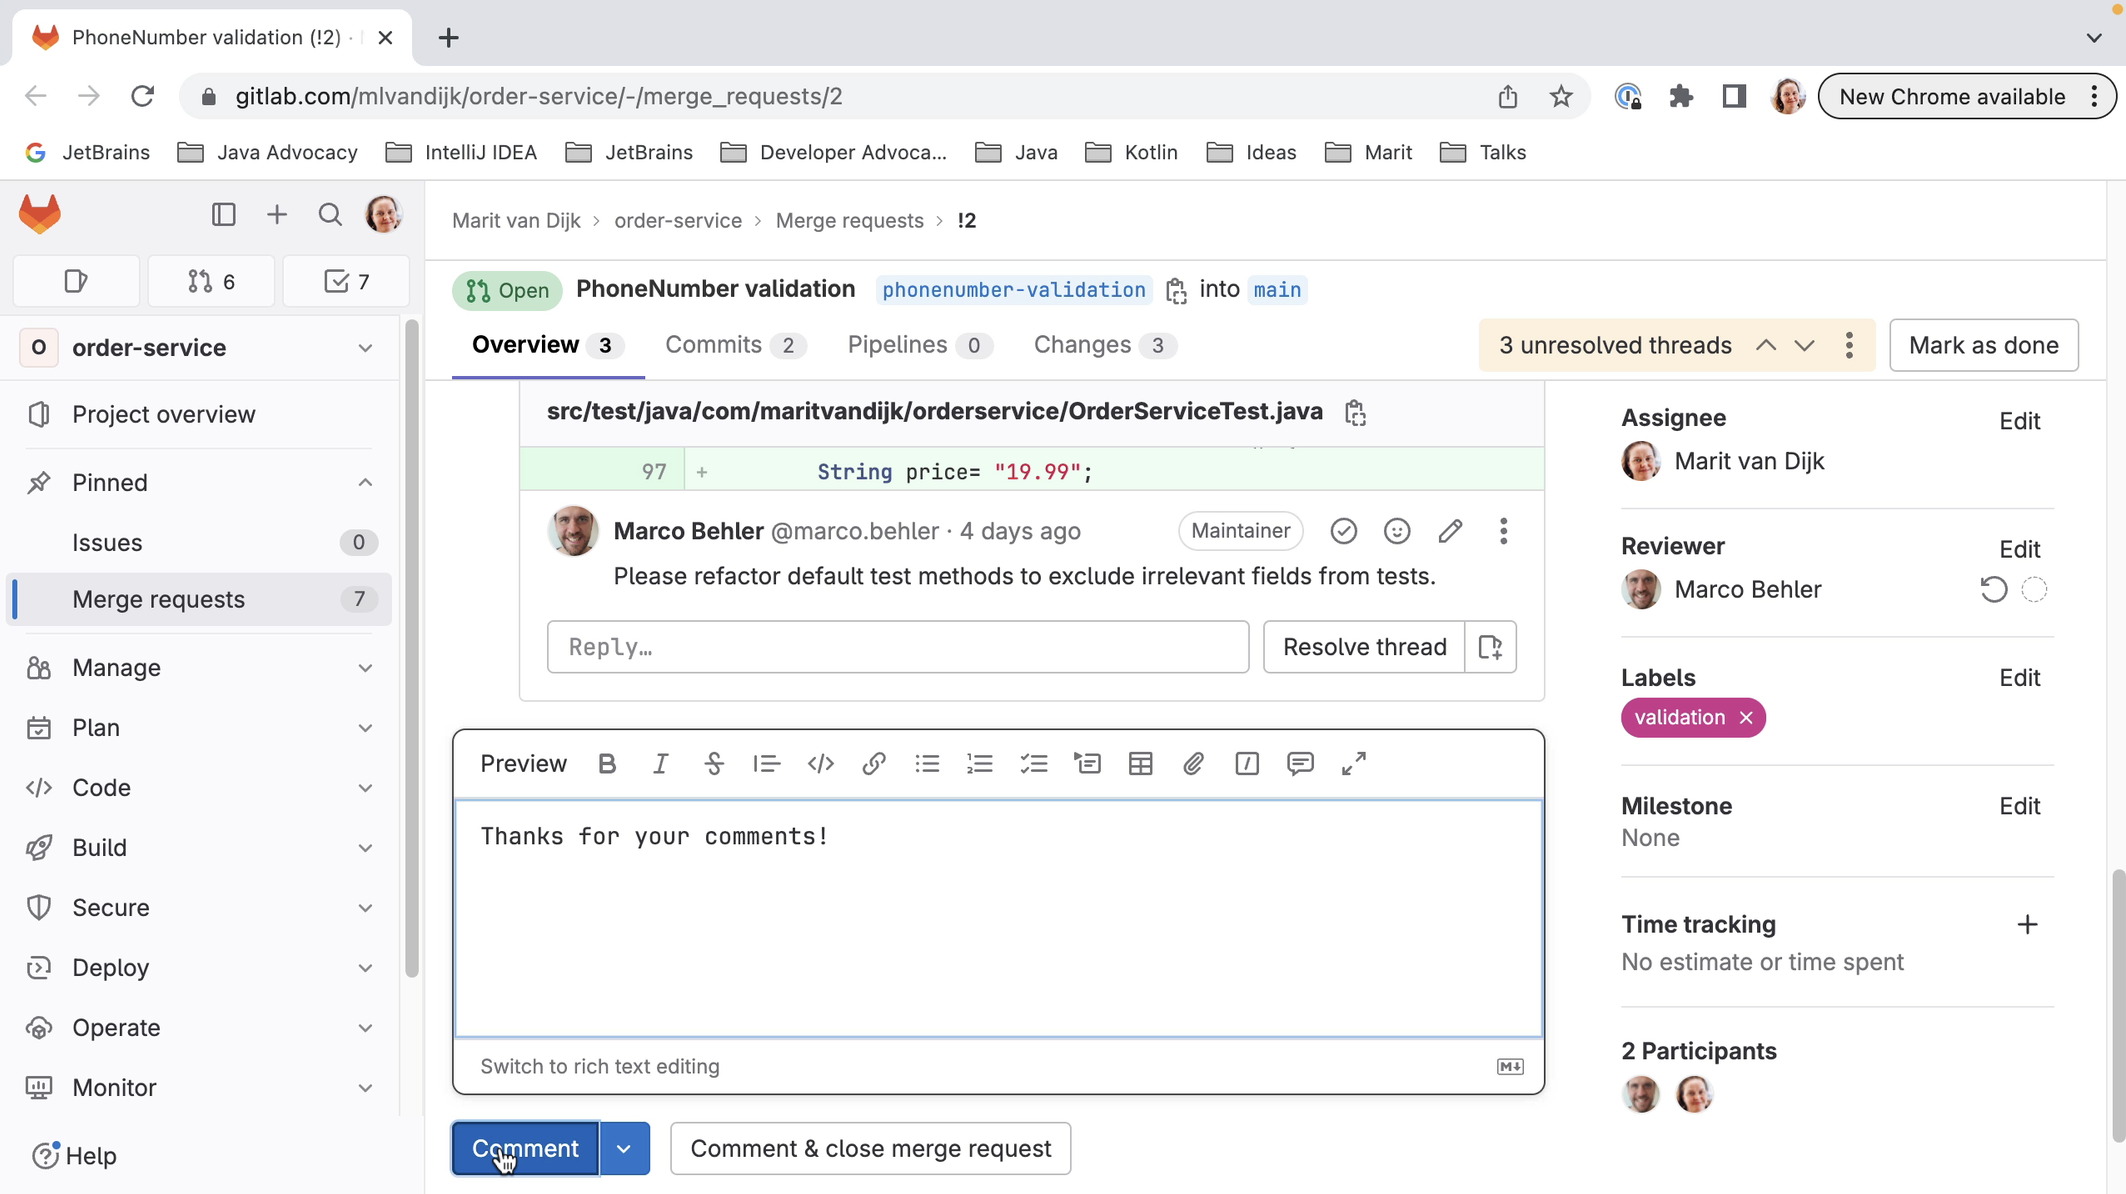
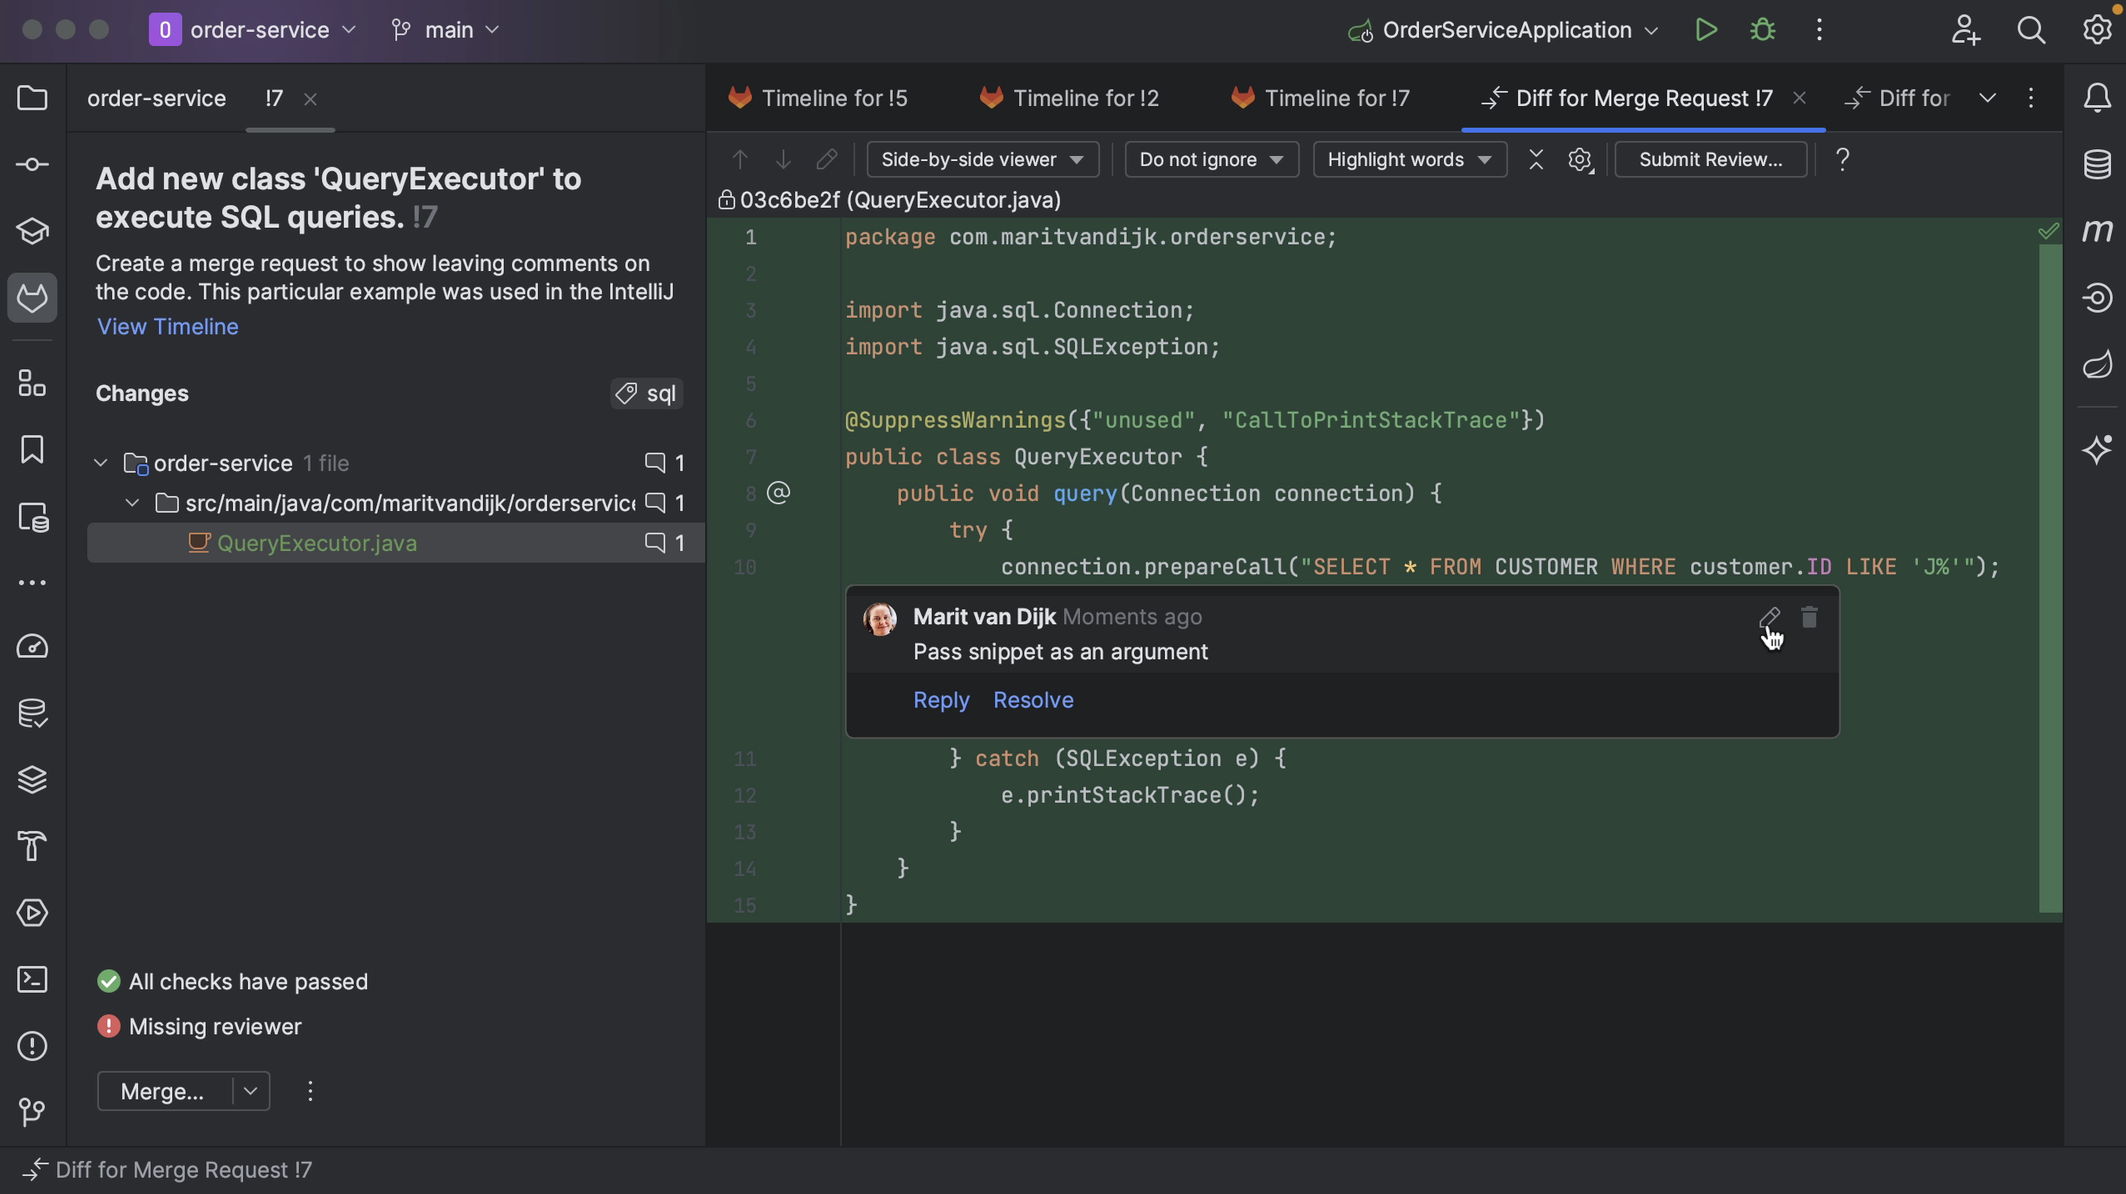
Adding comments from GitLab and IntelliJ IDEA
Let’s look at comments on our Merge Request.
We can add comments to the GitLab conversation. Comments on this page are comments that apply to the Merge Request as a whole, and not a specific piece of code. We can see these comments inside IntelliJ IDEA too. We might need to refresh our Merge Request window, either using the shortcut to Refresh Reviews (⌘R on macOS | Ctrl+F5 on Windows/Linux) or by right-clicking the Merge Request window and selecting Refresh Merge Request.
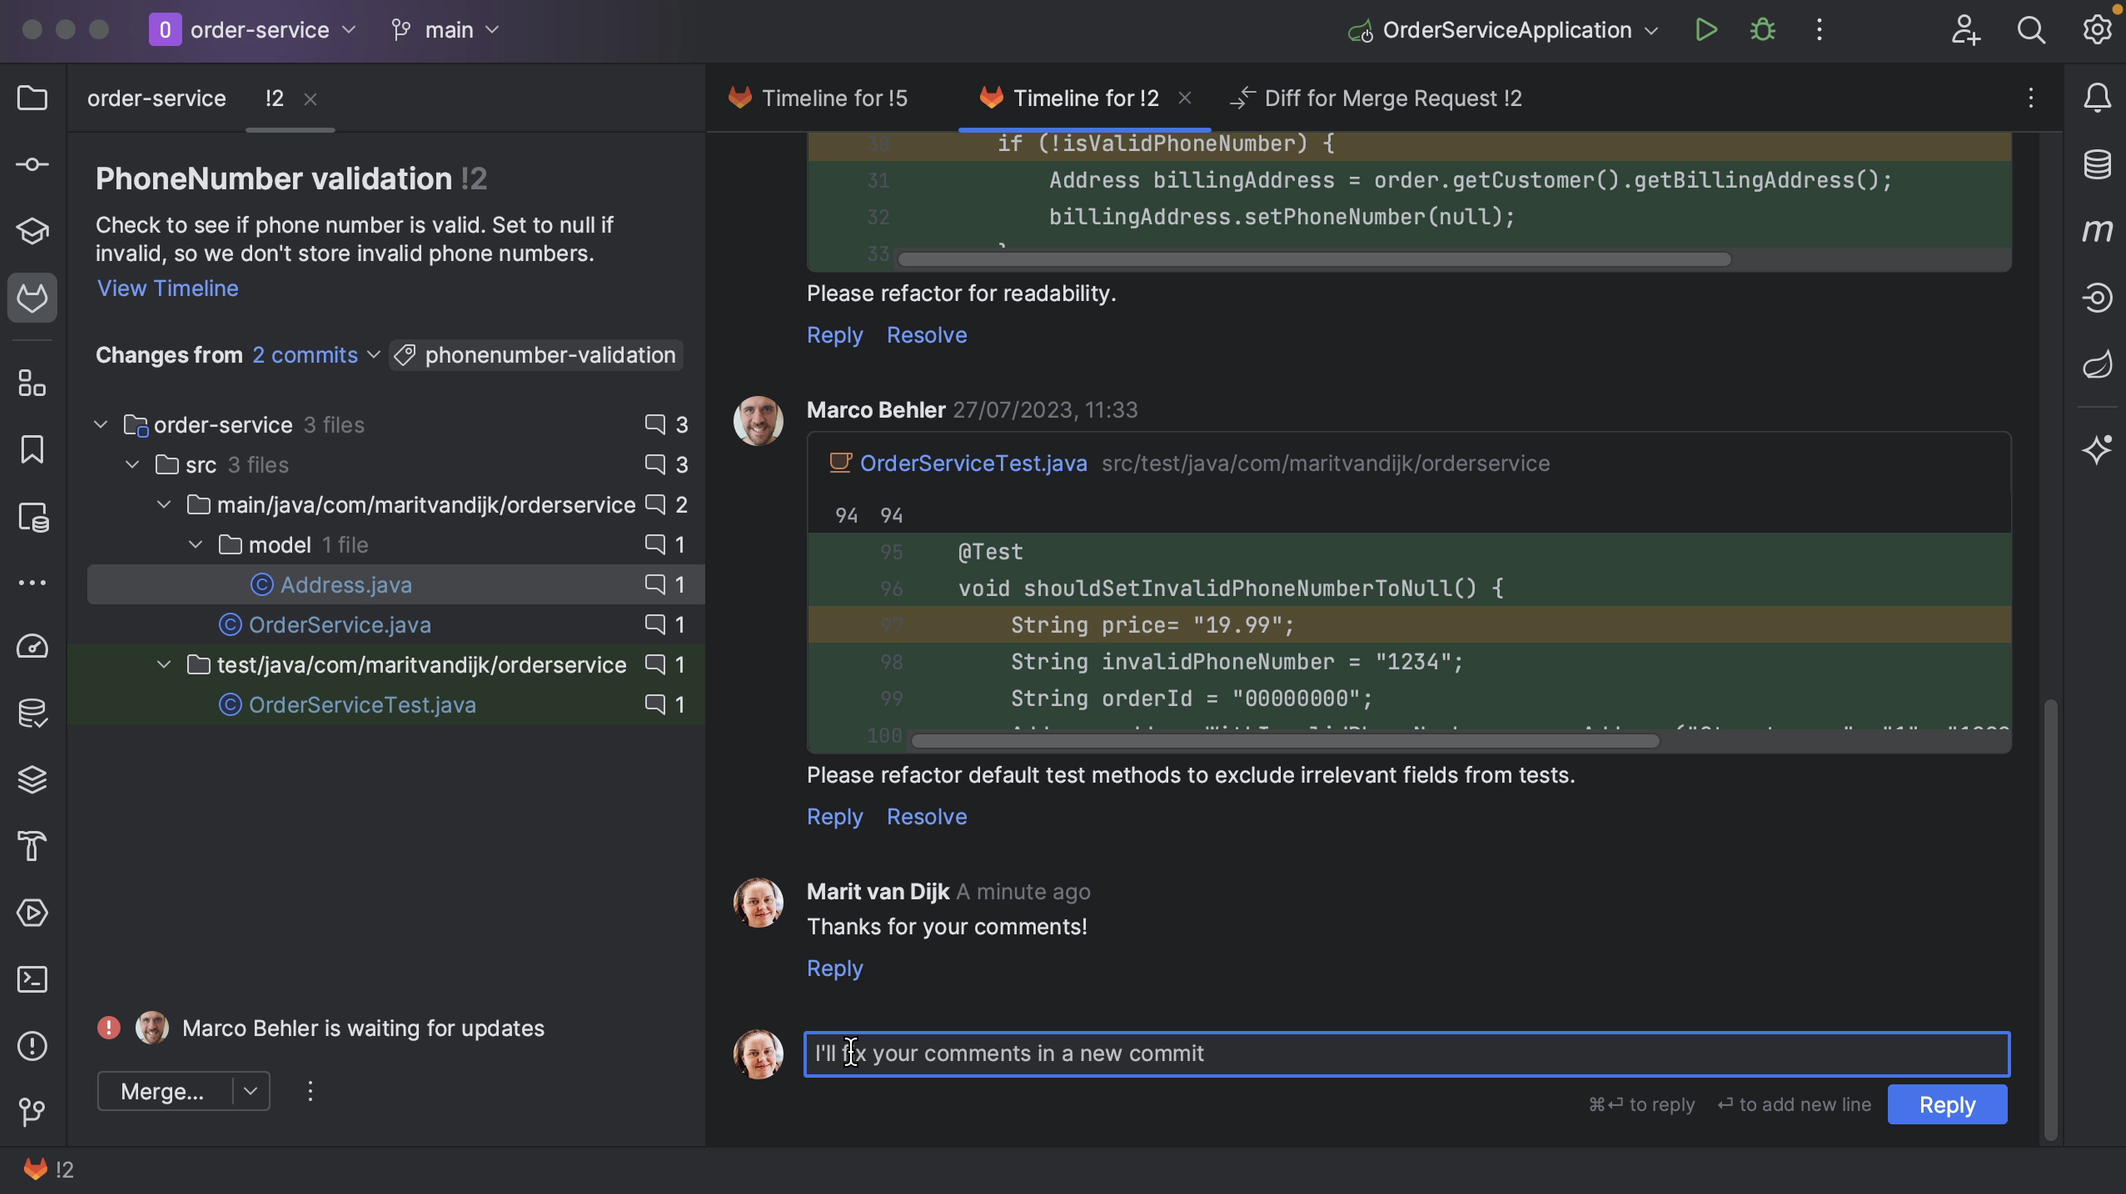
We can also add comments from inside IntelliJ IDEA. We can place high-level comments, like the comment we just placed from GitLab.
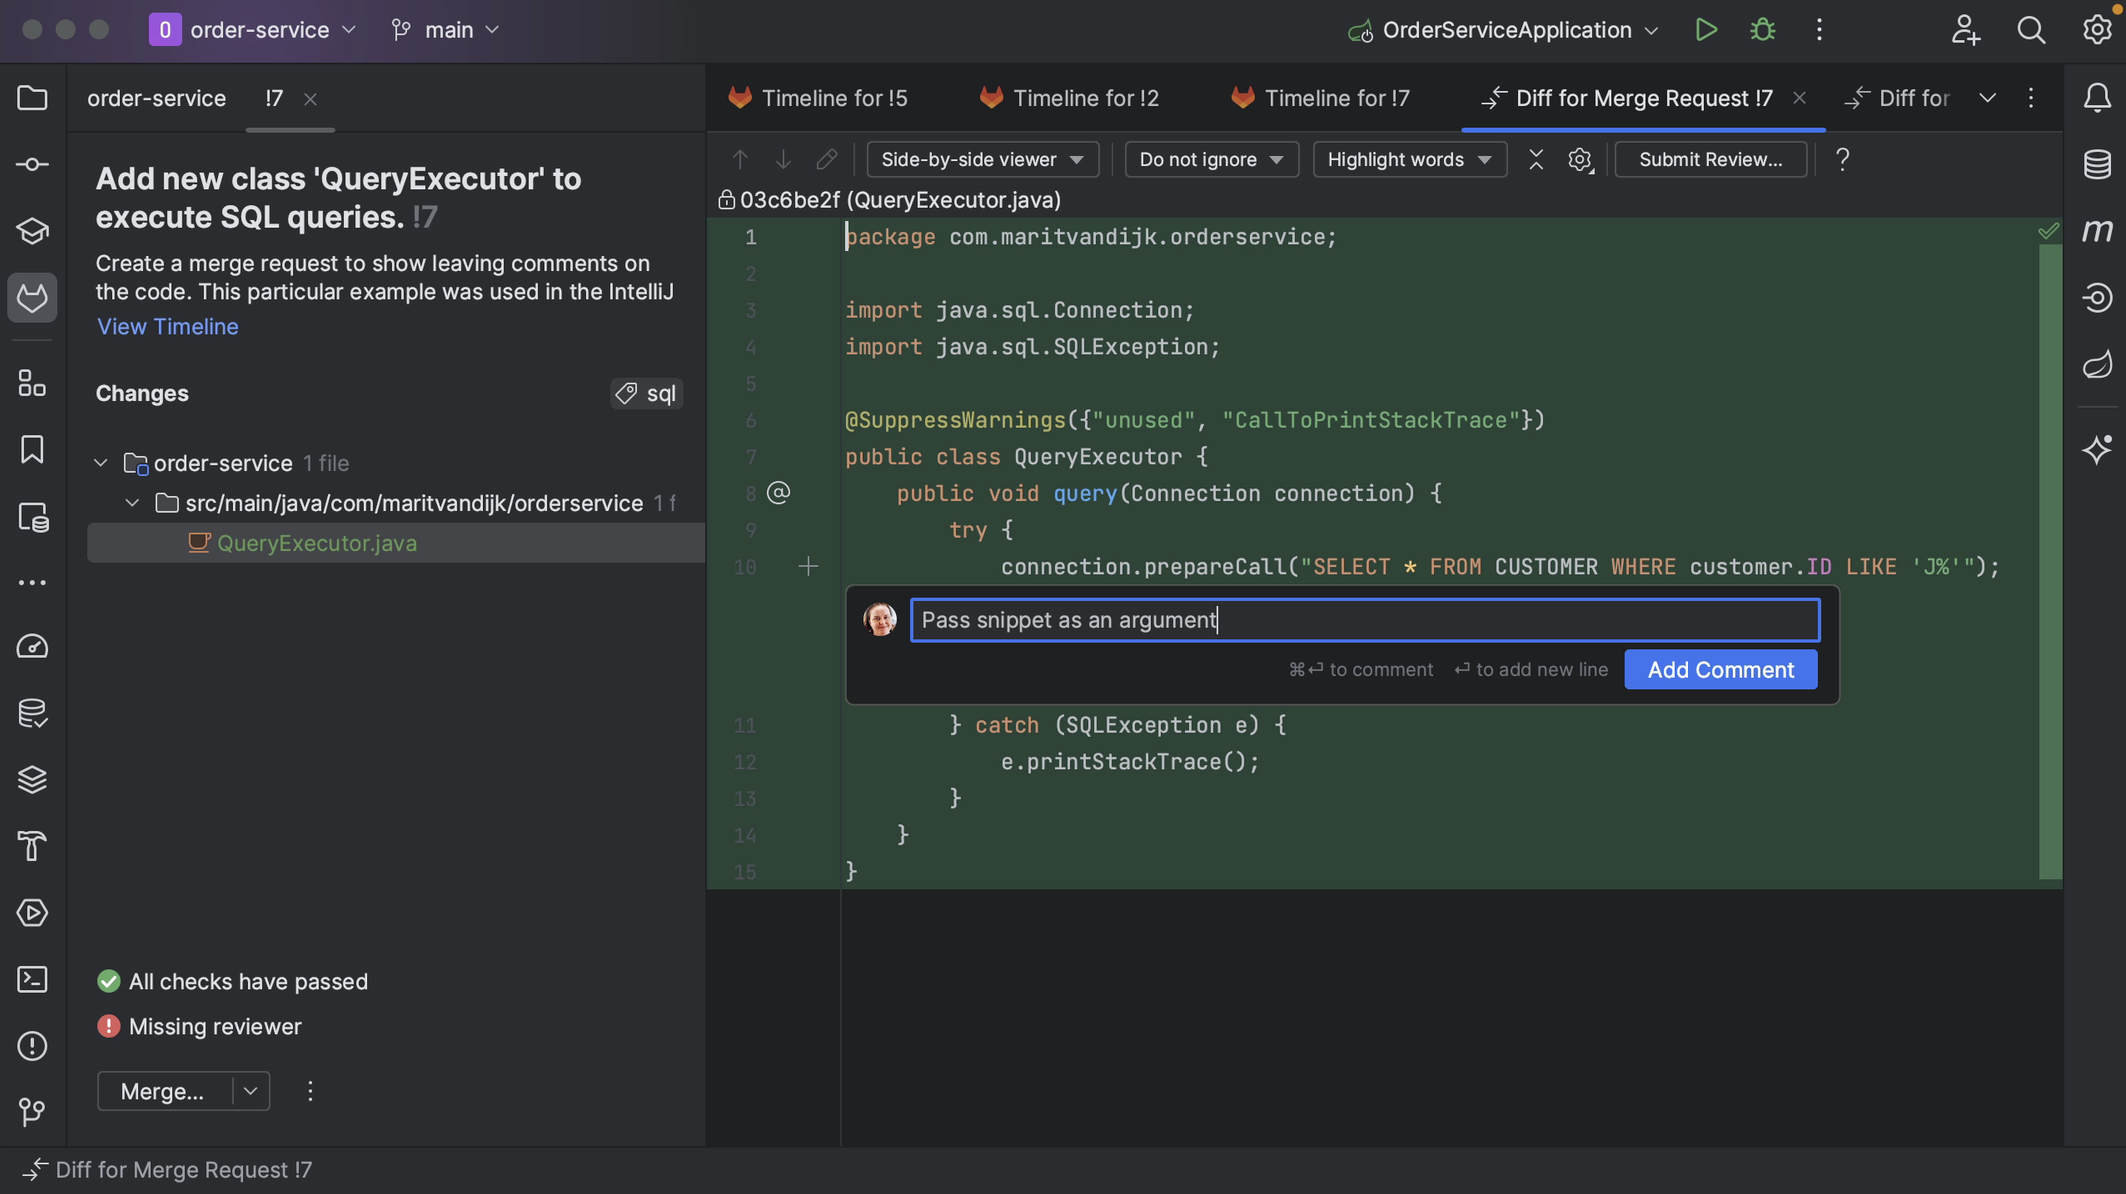
We might also want to add comments on particular parts of the code. We can do so from inside IntelliJ IDEA by clicking on the plus in the gutter of the diff viewer. For example, let’s add a comment to the current Merge Request.
We can edit or delete comments. We can also reply to comments or resolve a comment that is no longer relevant, for example, if the code has been updated in line with the comment.
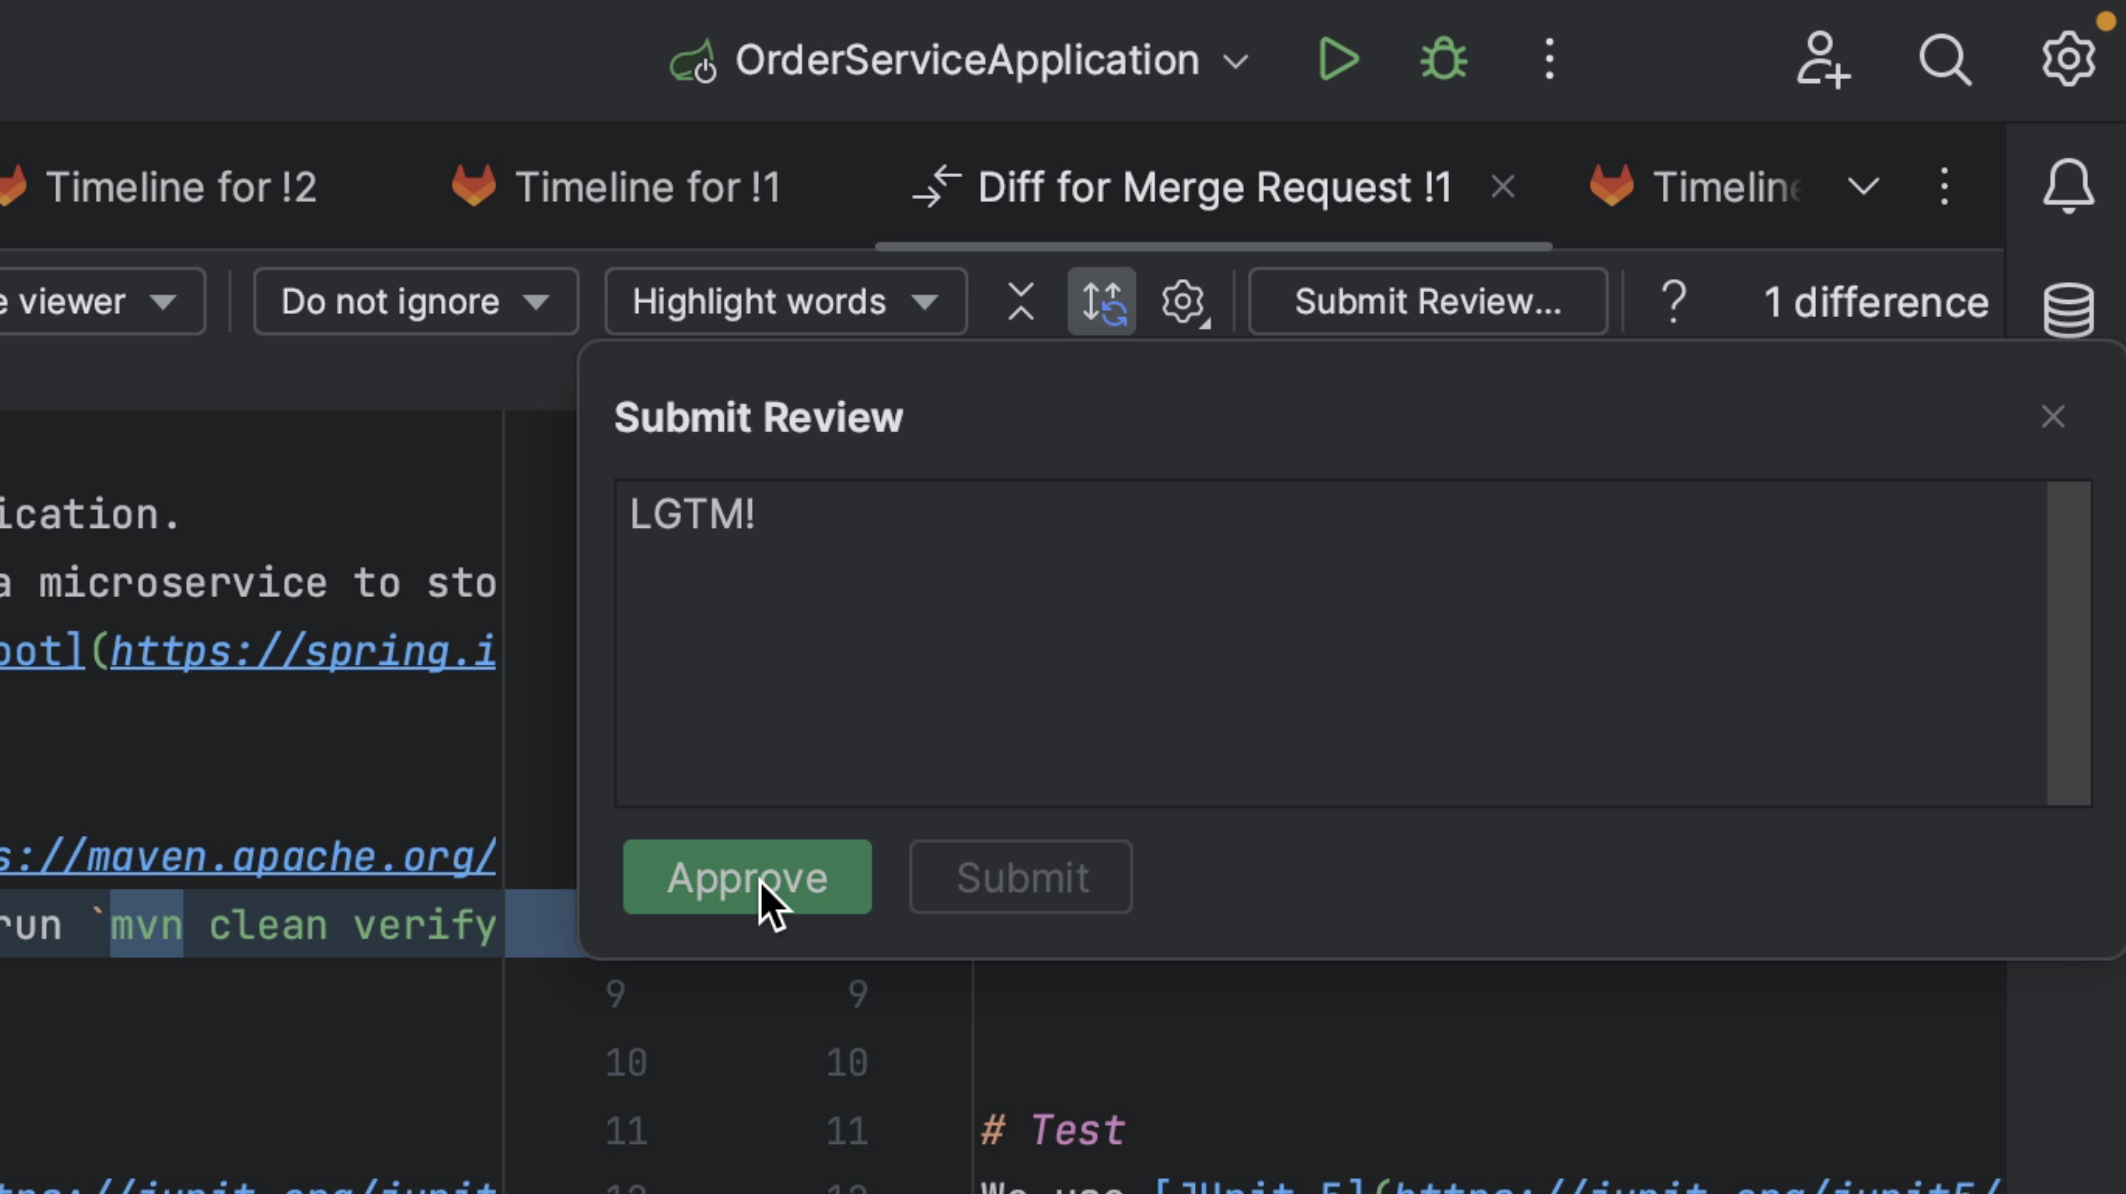
From the diff viewer, we can submit our review and approve the Merge Request if we think it’s ready to be merged.
Reviewing GitLab Merge Requests inside IntelliJ IDEA
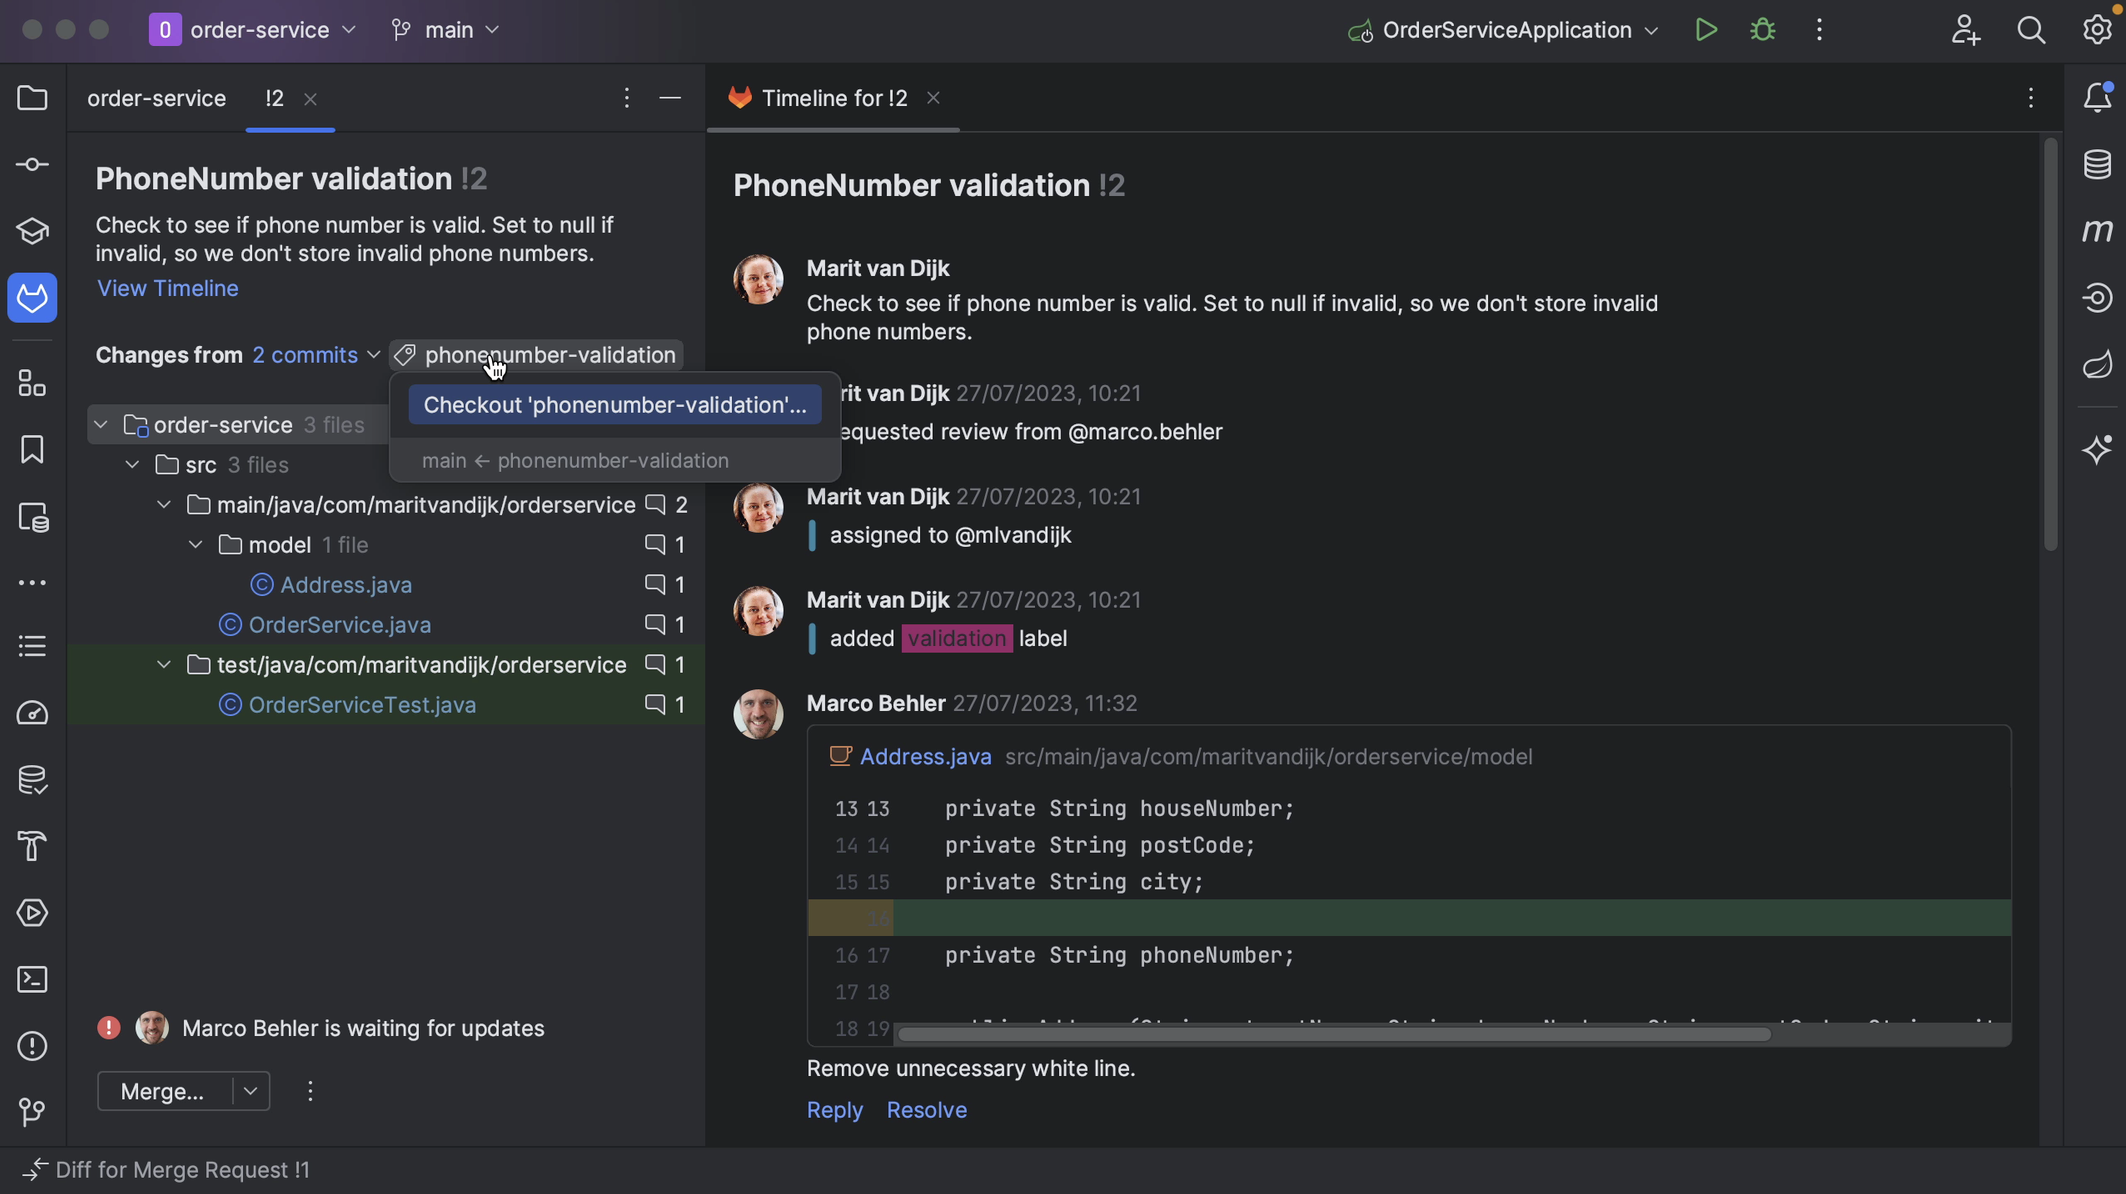
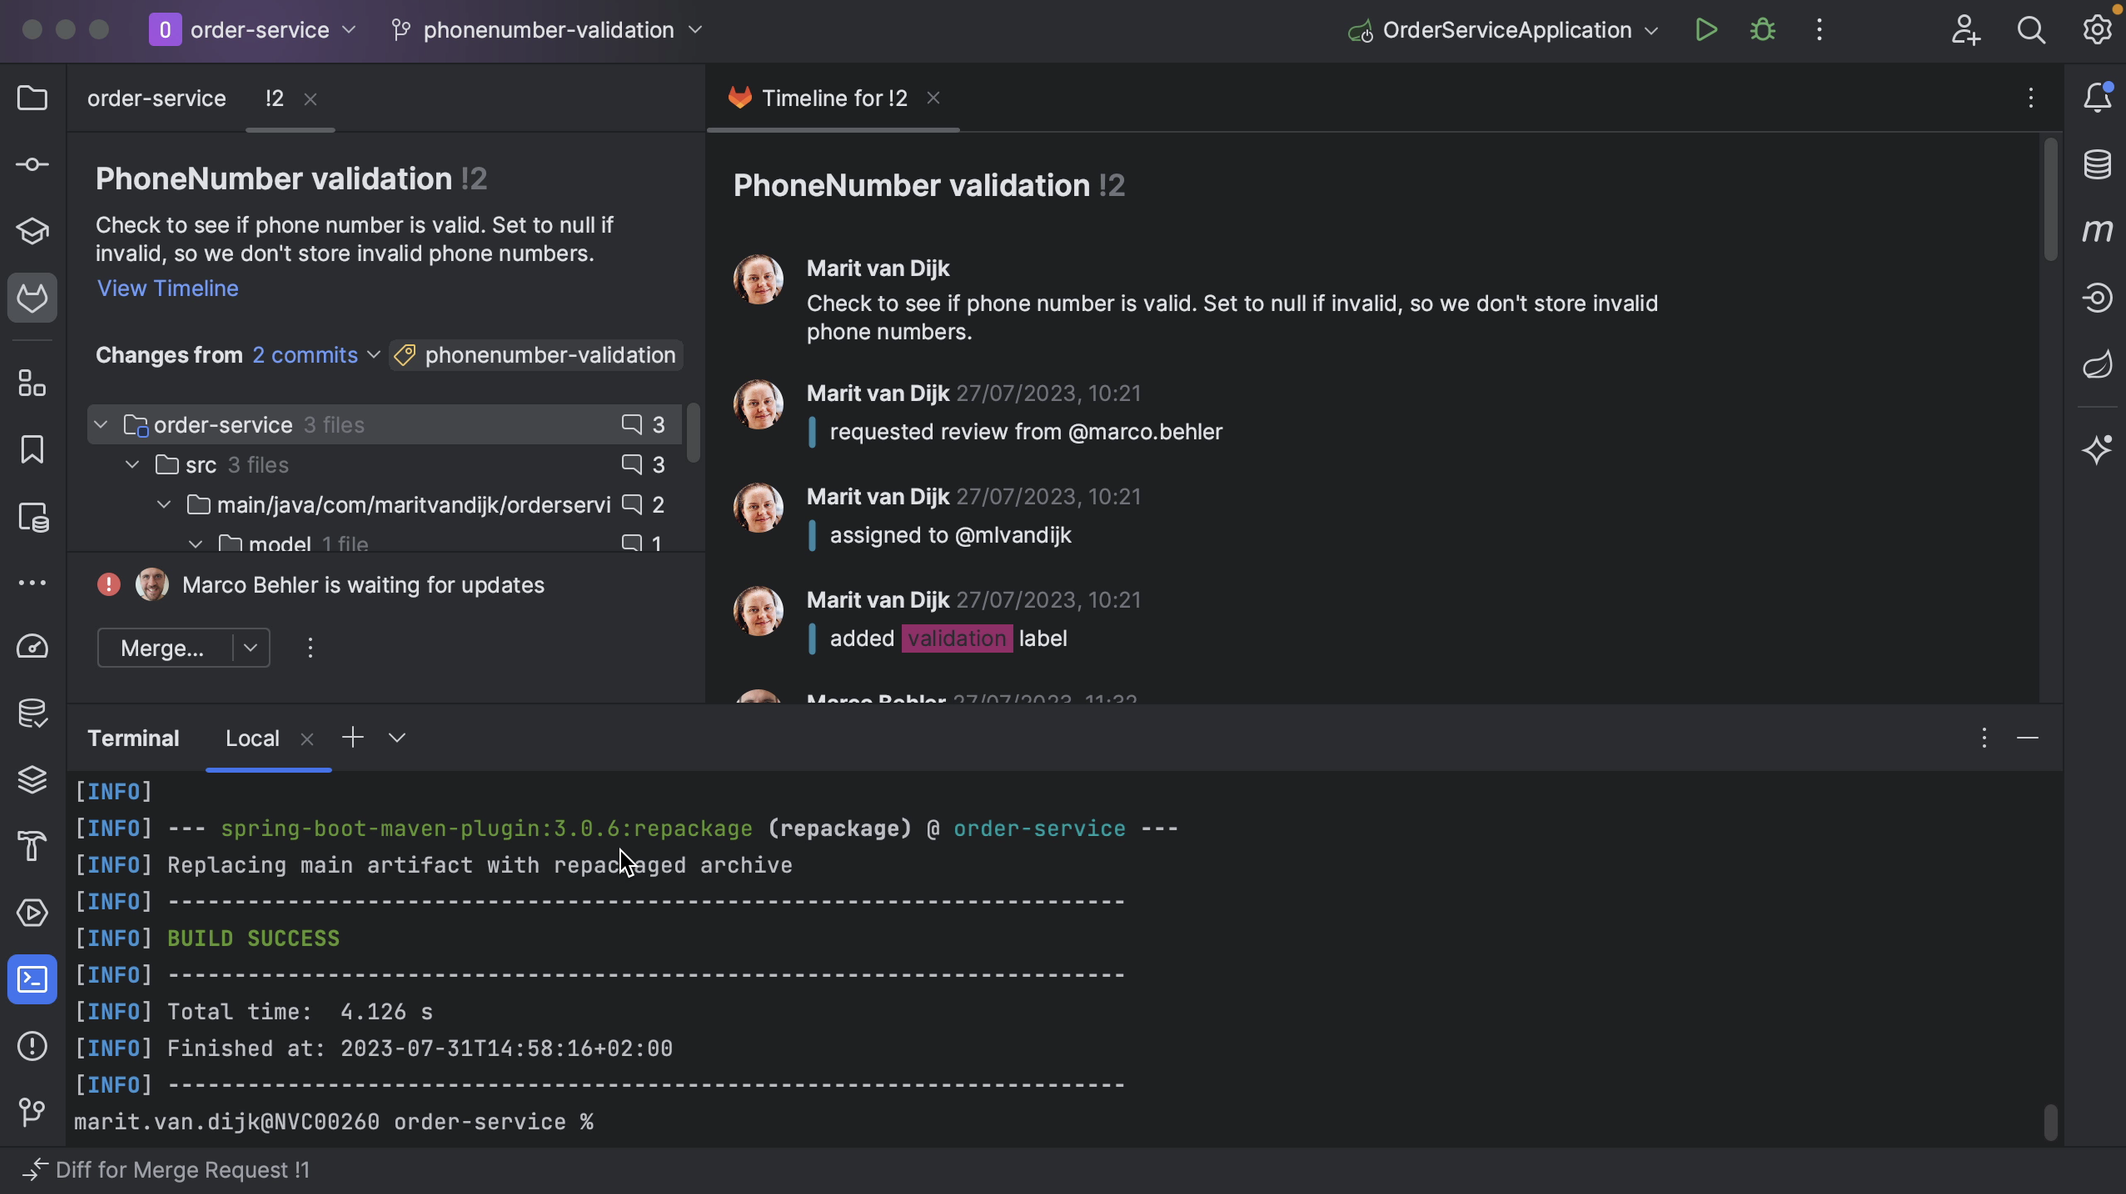
One feature that’s really helpful when we’re reviewing a Merge Request is that we can check out the code that is in the Merge Request. In this project, I’m currently on the main branch. Let’s check out the branch for this Merge Request.
With the branch checked out locally, we can navigate the code related to this Merge Request. This lets us not only look at the code, but also make sure that the project still builds and tests pass. We can potentially make changes too.
Finally, let’s look at how to finish off the Merge Request.
If a Merge Request is no longer relevant, and we’re not going to take the changes that went into the Merge Request, we can close it. We can do so by clicking the three dots at the bottom left of the Merge Request tool window and selecting Close Merge Request.
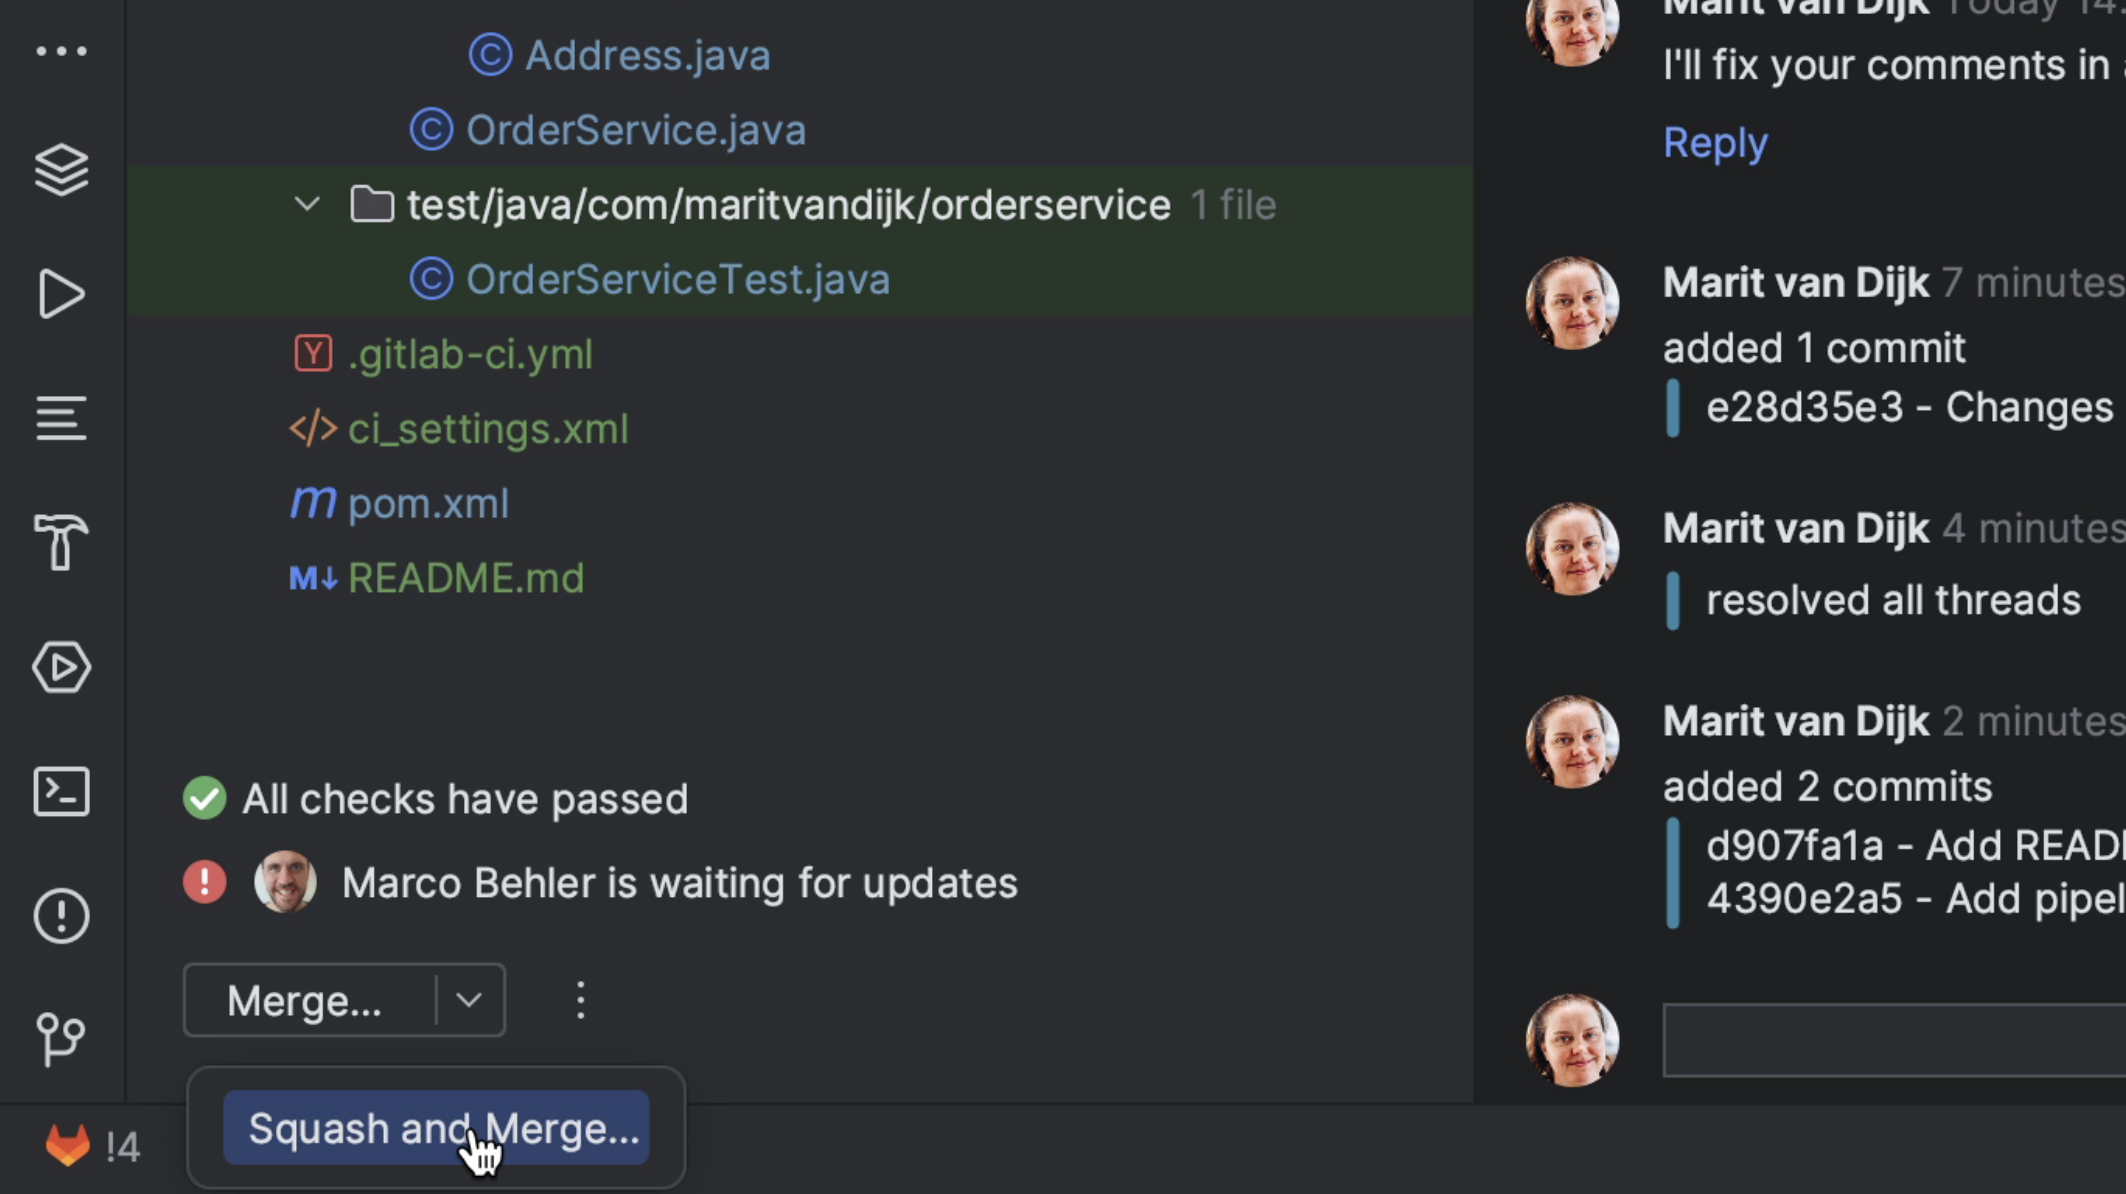
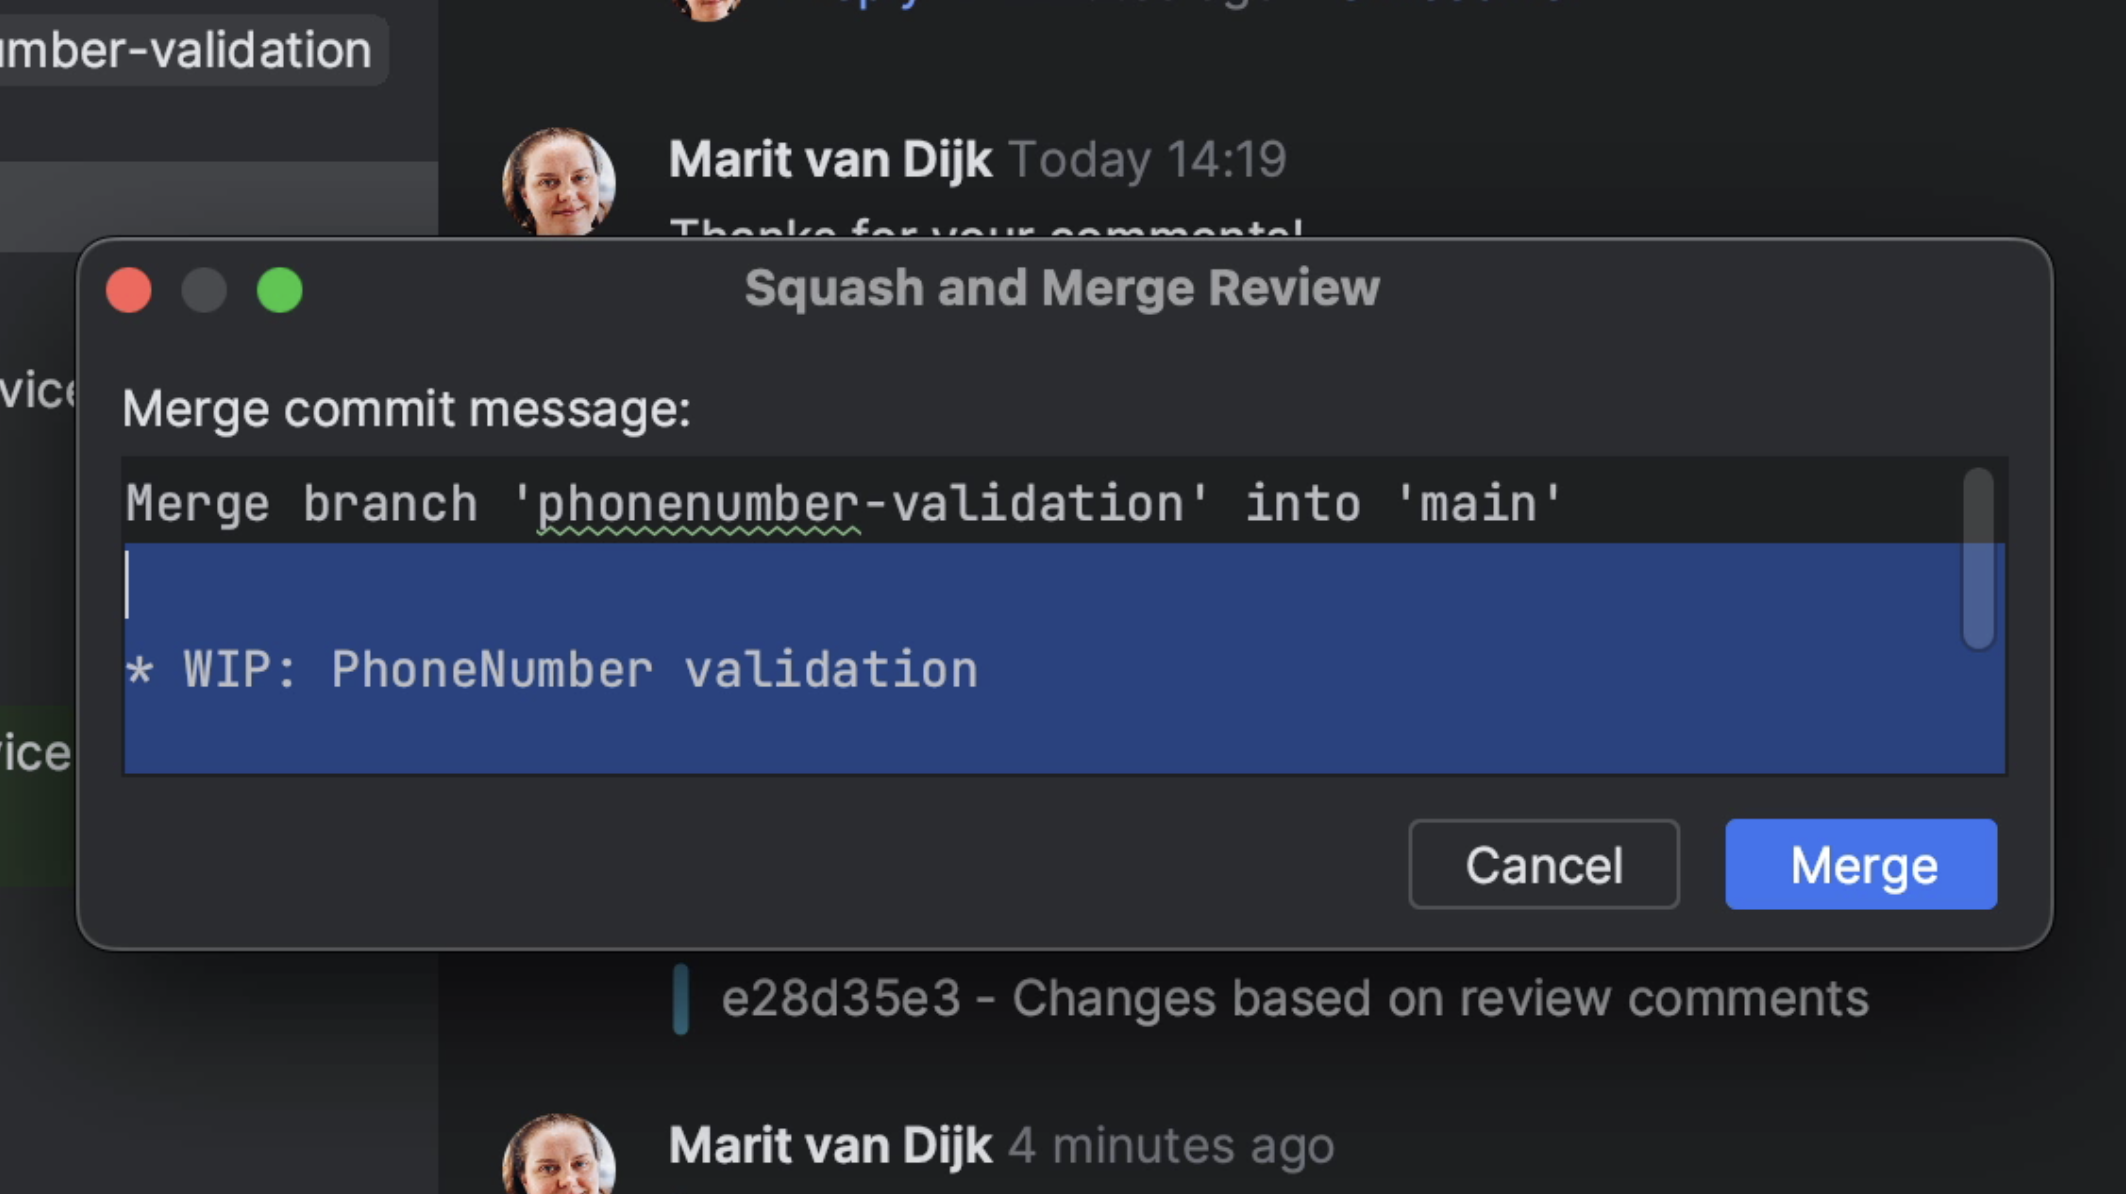
If the Merge Request is ready, meaning all the checks have passed, questions have been answered and requested changes to the code have been made, we can merge it. We can do so by clicking the Merge button at the bottom left of the Merge Request window. We also have the option to Squash and Merge, meaning all commits will be combined into a single commit when merging. We can add our own commit message for the merge, or edit the default one if we want to.
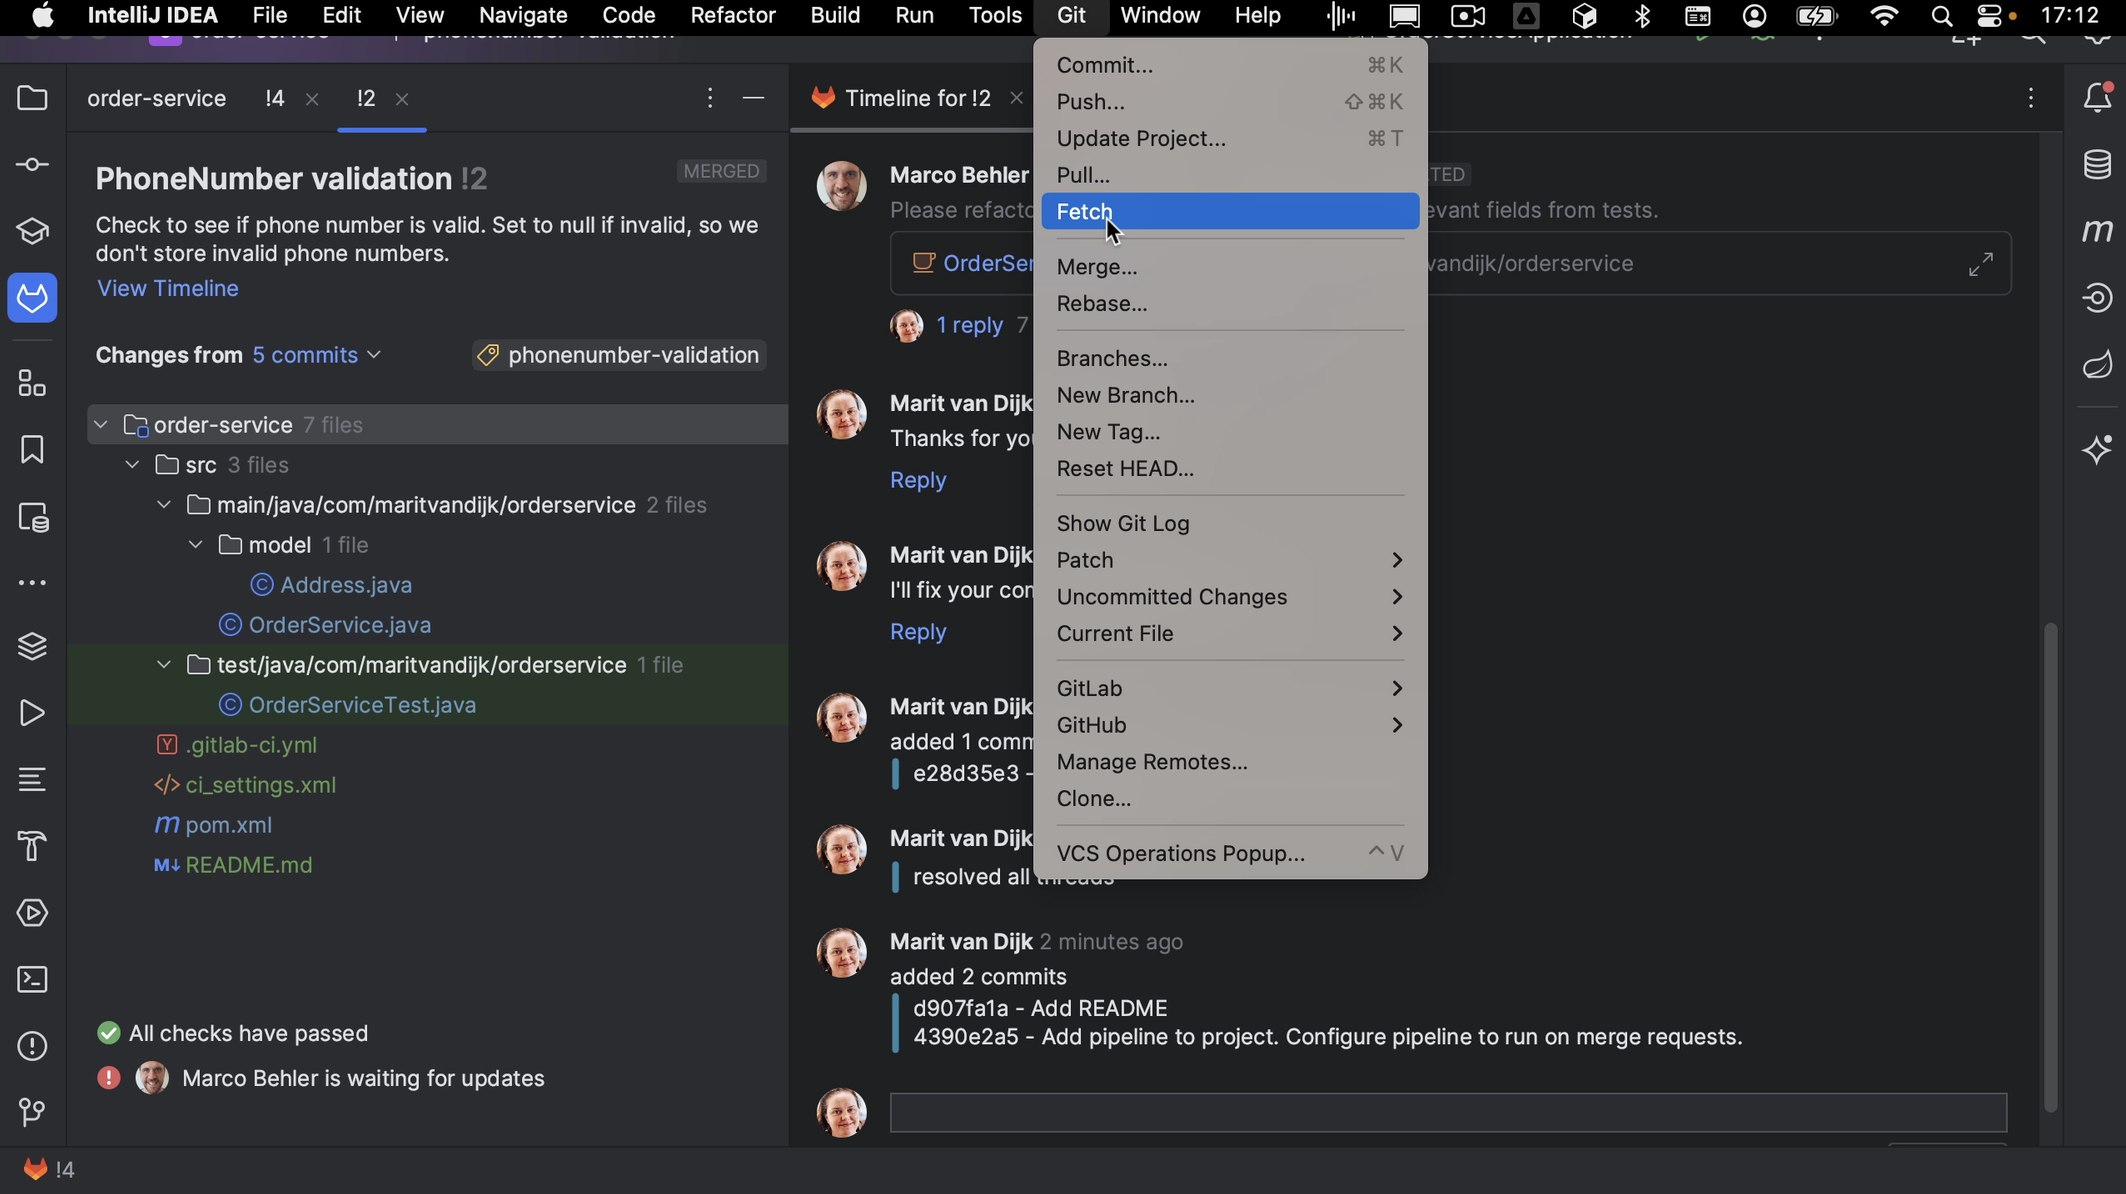
The Merge Request will be merged, and if we do a Fetch we can see the updated branches for this repository.
We can see in our browser that the Merge Request has been closed.
Summary and shortcuts
As we’ve seen, we can work with GitLab Merge Requests right inside IntelliJ IDEA. We can see all Merge Requests on a project, filter them or search for a specific Merge Request, perform a code review and add comments, see whether checks have passed and there are no merge conflicts, checkout the branch to run it locally, submit our review and approve the Merge Request, and merge (or close) the Merge Request all from inside our IDE.
IntelliJ IDEA Shortcuts Used
Here are the IntelliJ IDEA shortcuts that we used.
Used to determine whether a user is included in an A / B or Multivariate test.
18 months
_ga
ID used to identify users
2 years
_gali
Used by Google Analytics to determine which links on a page are being clicked
30 seconds
_ga_
ID used to identify users
2 years
_gid
ID used to identify users for 24 hours after last activity
24 hours
_gat
Used to monitor number of Google Analytics server requests when using Google Tag Manager
1 minute
_gac_
Contains information related to marketing campaigns of the user. These are shared with Google AdWords / Google Ads when the Google Ads and Google Analytics accounts are linked together.
90 days
__utma
ID used to identify users and sessions
2 years after last activity
__utmt
Used to monitor number of Google Analytics server requests
10 minutes
__utmb
Used to distinguish new sessions and visits. This cookie is set when the GA.js javascript library is loaded and there is no existing __utmb cookie. The cookie is updated every time data is sent to the Google Analytics server.
30 minutes after last activity
__utmc
Used only with old Urchin versions of Google Analytics and not with GA.js. Was used to distinguish between new sessions and visits at the end of a session.
End of session (browser)
__utmz
Contains information about the traffic source or campaign that directed user to the website. The cookie is set when the GA.js javascript is loaded and updated when data is sent to the Google Anaytics server
6 months after last activity
__utmv
Contains custom information set by the web developer via the _setCustomVar method in Google Analytics. This cookie is updated every time new data is sent to the Google Analytics server.