Tips for reading code

As developers, we read code more than we write it. When adding new features or fixing bugs, we first need to understand existing code, so we can make the right changes in the right place.

When reading code inside the IDE, IntelliJ IDEA helps us to read and understand code by providing helpful features like syntax highlighting and inlay hints. But there are more features to help us understand a piece of code.

Formatting

We don’t read code like we do text, from start to finish. Code doesn’t run linearly! We scan code to get a feel for the shape, and to find the part we’re interested in.

IntelliJ IDEA will take care of formatting the code while we’re writing code. If we encounter code that is not properly formatted, we can have IntelliJ IDEA reformat the code for us. In the file you want to reformat, use the shortcut ⌘⌥L on macOS or Ctrl+Alt+L on Windows/Linux.

Reformat code

We can restructure the code by moving code blocks around to match our mental model, preferred style or coding conventions.

Move Statement Up and Down

Structure

There are several ways to get a quick overview of a piece of code. For example, we can collapse the code, so we only see the names of methods and not their implementation. This can help us find the specific code we are looking for more quickly. We can then expand that particular section.

Collapse and Expand code

Note that we can still search the code when it is collapsed, and if needed the relevant section will expand.

Search collapsed code

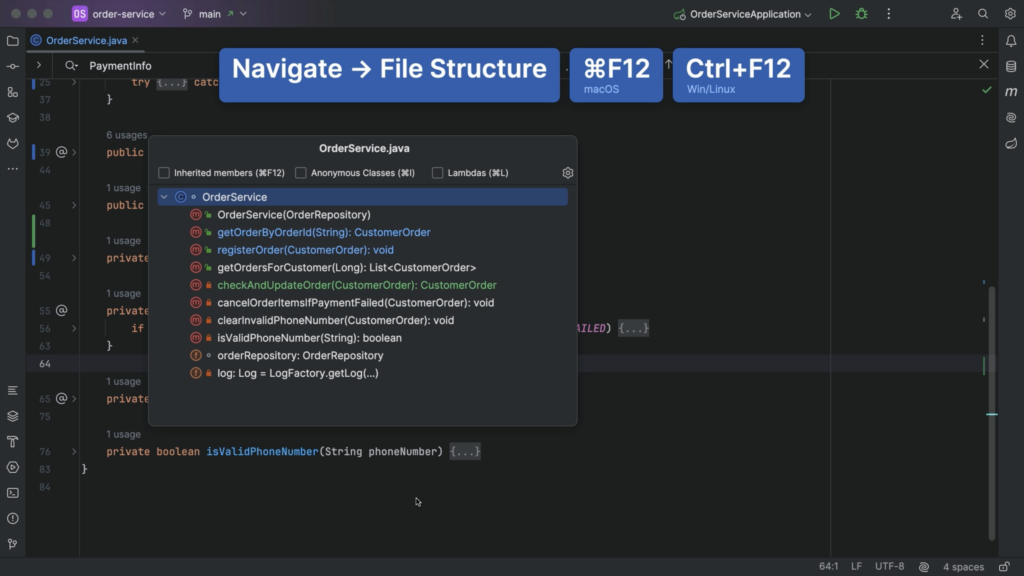
Alternatively, we can look at the File Structure for a file using ⌘ F12 on macOS or Ctrl+F12 on Windows/Linux. We can navigate to the section of the code we’re interested in from here.

File Structure

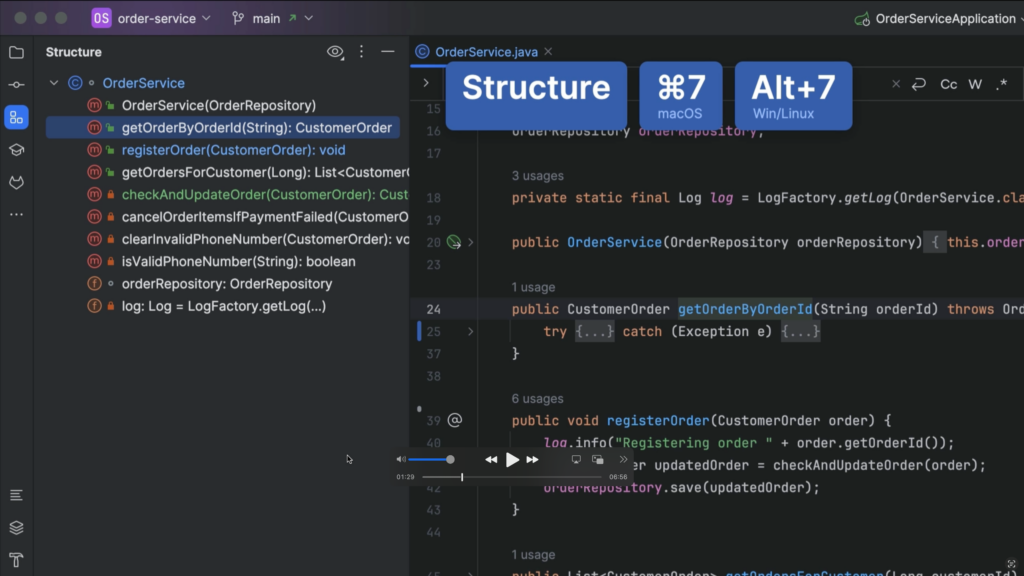
We can get the same information by opening the Structure tool window, using ⌘ 7 on macOS or Alt+7 on Windows/Linux.

Structure tool window

Searching

We can search the code for specific names of variables, methods, or Strings, for example a log message. IntelliJ IDEA will highlight the results of your search in the file.

We can also search for other occurrences from the editor. For example, we can select this variable name, and press ⌘F on macOS or Ctrl+F on Windows/Linux to search for the selected string. IntelliJ IDEA will place the selected string into the search field and highlight all occurrences in the file.

Find String in File

Additional hints: Quick Documentation & Type Information

We can also ask for additional hints from our IDE. For example, we might want more information about a particular class or method that is used in the code we are looking at, but defined elsewhere in the codebase. We can navigate to other locations in the code base, and back again, but we might end up getting lost in a large code base. Even though we can ask IntelliJ IDEA to locate a file in the project structure, jumping around too much can get overwhelming.

Select in: Project tool window

Instead, we can use Quick Documentation (F1 on macOS or Ctrl+Q on Windows/Linux) to pull up the information we need in our current location.

Quick Documentation

We can also pull up Type Information using ⌃⇧P on macOS or  Ctrl+Shift+P on Windows/Linux  if we’re unsure of what type is returned by a particular method.

Type Information

Reader mode

Code might contain comments that explain the code. We can toggle to reader mode in the editor using ^⌥Q (on macOS) or Ctrl+Alt+Q (on Windows/Linux). Right-click the icon in the gutter to select Render All Doc Comments if you want all comments to show in reader mode.

Toggle rendered mode

Testing and debugging

To understand intended behavior of the code, we can look at the tests in the code base. To look at the code and its tests side by side, right-click the tab and select Split and Move Right.

Split and Move Right

We can run a test (or our application) through the debugger to actually see how the code is executed. First, we need to place a breakpoint at the location in the code we’re interested in. Click the gutter next to the line of code where you want to place the breakpoint, or use ⌘ F8 on macOS or Ctrl+F8 on Windows/Linux to toggle the breakpoint.

Next, we run our test (or application) using the Debug option. Execution will stop at the breakpoint, so we can investigate the state of our application. Once code execution stops at the breakpoint, we can see current values of variables and objects. 

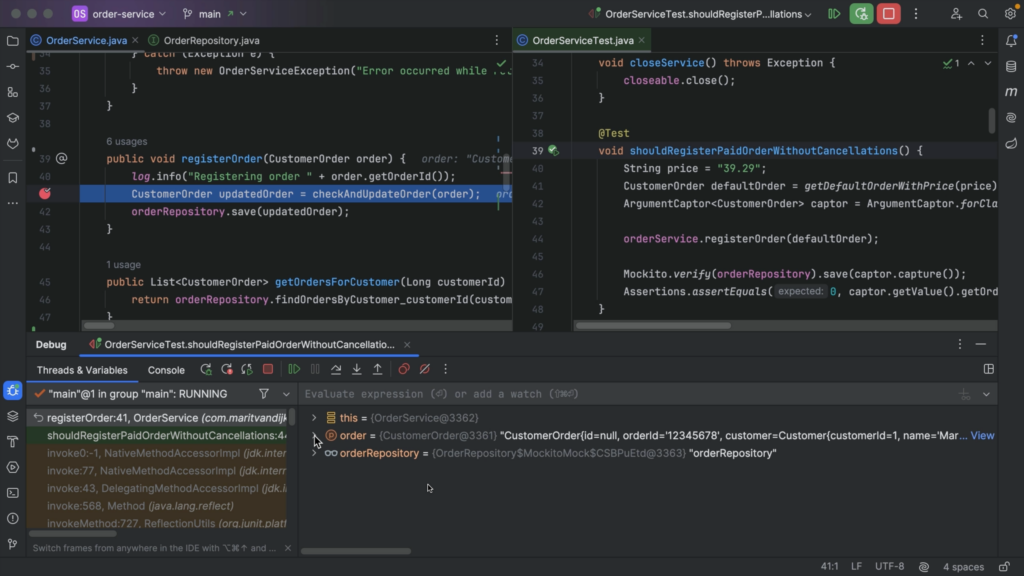
We can also evaluate an expression, to see its current value and look at more details. We can even change the expressions to evaluate different results. 

Evaluate Expression

We can continue execution by either stepping into (F7) a line to see what happens inside a called method or stepping over (F8) a line to go to the next line even if a method is called, depending on what we’re interested in. Finally, we can resume the program, using the shortcut ⌥⌘R on macOS or F9 on Windows/Linux, to finish the execution of the test (or continue execution of the application).

Step into, step over, resume.

If there is no test that exercises the piece of code you are interested in, you might want to add one. This can also help you verify any assumptions you might have about the code.

Refactoring for understanding

While trying to understand the code, you may want to perform small refactorings, like renaming a variable or method (using the shortcut ⇧F6 on macOS or Shift+F6 on Windows/Linux), extracting a method and giving it a meaningful name (using the shortcut ⌥⌘M on macOS or Ctrl+Alt+M on Windows/Linux), or refactor the code to a style you are more familiar with to make it easier for you to read and understand the code.

Refactor code style

Playing with the code can help you verify your assumptions and improve your understanding. Remember though, that these changes are not meant to be committed! Revert them when you’re done.

Revert changes

Version control (Git) history

We might be interested in when the code was last changed and why. We can find out by looking at the history in our version control system. If we are using Git, we can click the gutter to enable Annotate with Git Blame. Or, if you don’t like using the mouse, you can open the VCS Popup using ⌃V on macOS or Alt+` on Windows/Linux and enable or disable this option from there.

VCS Popup

In the gutter, we can now see when a line was last changed and by whom. We can hover over this information to see the commit this change was a part of and its corresponding commit message. Or we can click a line in the gutter to open the Git tool window, with the selected commit highlighted. Here, we can see the commit, its commit message and which files were changed. We can open the diff of the files to see exactly what was changed.

JetBrains AI Assistant

If you are using JetBrains AI Assistant, you can ask AI Assistant to explain the commit to you.

Explain Commit

JetBrains AI Assistant is an additional service available in IntelliJ IDEA from version 2023.3. It has several features that can help us understand our code. For example, we can ask AI Assistant to explain code, write documentation, or generate unit tests.

AI Actions

If we use the AI action Explain code without selecting any code, the entire file is selected and AI Assistant opens a chat window where it will explain the code in this file. Alternatively, we can select a specific piece of code, like a method, and perform the same action to get an explanation of that section of code.

Explain Code

We can write documentation for a class or method. Note that our cursor needs to be in the class or method for this to work. We can’t write documentation for a blank line.

Write Documentation

And of course, we can ask AI Assistant questions in the chat. For example, to explain the project.

Explain Project

Keep in mind that even if you use AI Assistant to write code for you, you’ll still need to be able to read code! You’ll need to evaluate the code provided, and understand whether that is the code you want.

Conclusion

In this tutorial we’ve looked at the many ways IntelliJ IDEA can help you read and understand code. Hopefully these tips for reading code will have you reading code like a pro.

Links

Benefits of joining a Code Reading Club

Several months ago I heard or read about Code Reading Club for the first time. It might have been a tweet by Felienne Hermans, or it might have been in her excellent book The Programmer’s Brain, but I was intrigued. As a developer, I’ve often wondered what would be the best way to familiarise myself with a new codebase, or the best way to really understand what a specific piece of code does. Of course, I’ve learned several techniques over time, but the idea to deliberately practice reading code? Brilliant! So imagine my surprise when my friend Lisi Hocke reached out to ask me if I would be interested in joining her Code Reading Club. Well, yes!!

Online tooling

The club consists of several members in different countries and even different time zones and takes place online. We decided on a day and time that works for us, and use collaborative tools like Miro or Jamboard for our sessions.
This means everyone needs to make sure to have the code sample printed, or have a digital copy they can annotate with a digital tool. (And no, this is not supposed to be an IDE or editor with syntax highlighting, as part of the exercises is to look at the structure of the code.)

Exercises

All of our sessions so far have used the same exercises, using a different code sample (in a different language) each time. The exercises are taken from the starter kit.

The first session was very well prepared with a Miro board that contained everything we needed for the online session. The board contained the exercises, the code example and (where needed) space for us to place virtual post-its with our comments.

Introduction

We started our first session with a round of introductions, since not everyone in the group knew each other. We try to repeat that when new people join, as unfortunately not everyone is able to join every session.

Setting the scene

We start each session writing down what we are looking forward to or are excited about, as well as what we are worried or confused about. In the first session these comments were more about our expectations for the Code Reading Club in general.

For example, people mentioned they were excited about the following:

  • Getting used to thinking through problems with unfamiliar tools & languages
  • Understanding how others think about programming
  • Taking advantage of our different experiences to learn more about code
  • Looking forward to learning – both about code and about new people
  • Some people also mentioned specific goals like getting better at code reviews, or improving their coding skills (from reading to writing).

In the next sessions the comments were sometimes more about how we were feeling (from being tired at the end of a long week, to being happy to see each other again) and about our progress in the club (for example, learning from each other, or fearful we’re not picking it up as quickly as we would like). What I love is that people feel safe in the group to share how they feel. And everyone is excited to learn with and from each other, and is supportive of each other.

First glance

The first exercise in code reading is called “First glance”. It literally asks to take a quick (1 minute) look at the code and note the first thing(s) you notice about it, and why. We’ve found that different people notice different things, for example things they are familiar with or confused about.
Some people focus on which language it is, or which programming constructs they recognise, while others focus on naming, whether or not there are comments or even import statements.

What’s also interesting is to talk about why these are the first things you noticed. Do you read the code from top to bottom like you would a piece of text in natural language (like this blog post), or do you scan the code and look at the blocks of code first, before looking at details? Do you focus on known or unknown concepts? All of these are opportunities to learn from each other and look at code differently next time.

Code structure

The next exercise is to examine the structure of the code, or rather its components or elements. We mark the variables, functions/methods, and object instances. It can be very interesting to identify these in a “foreign” programming language! We also draw connections between these elements in the code; for example, linking where a variable is used throughout the code, or a method call to a method.
This exercise is intended specifically to look at the structure of the code, and not its purpose. This turns out to be very hard, especially for people who really like to understand what’s going on! (Don’t worry, we’ll get there!)

Content

Next, we each identify the 5 most important lines of code. We notice that not everybody chooses the same lines, so we also discuss why people chose those lines in particular and learn from each other’s insights. For example, we don’t always have the same understanding of the meaning of “important”; does it mean important for the code to execute, or to understand what the code does? If the former, you might choose a main method as an important line of code. If the latter, you might choose a comment. Other people look at which lines are important for the control flow, or which lines are important to determine what to test (since some of the team members have a testing background).

Summary

The last exercise is to summarize the purpose of the code, or to describe what you think the code does to the best of your ability. It is interesting to see whether people have the same understanding of the code or not, but more interesting to see which information they use to get there. What strategies do they use to come to that particular understanding of the code? Which information in the code do they use? Or which knowledge of a particular language or concept? Often there is a lot of tacit knowledge involved. It can be really helpful to notice yourself making implicit assumptions and to make those explicit, not just for yourself but also for others to learn from.
This can also be a good time to explain where the code came from. It might help determine whether you think you’ve understood the code correctly. Although to me the point of the exercise is not to “get it right”, this can be hard for some people, so it can be helpful for the host of the session to provide some context.

Reflect

Finally, we reflect on the session and what we feel went well or could be improved for next time. One thing we noticed in the first few sessions was that we had to make sure we all had the code ready to annotate it (either printed or in some tool).
Some positive notes were on the structure of the sessions in getting to the meaning of the code, someone who had the opportunity to explain a programming concept or language feature to others, learning with and from each other. Someone commented that having context would help understand the code; they found not knowing frustrating. Someone else said “next time, can we read good code?” which was followed up by someone else who said that since reading an unfamiliar language is hard enough, we should have well structured examples. And while I understand those comments, the hard truth is that unfortunately we have to be able to read code that might be poorly written / structured, so in my opinion it’s good to practice that.

Conclusion

Overall, I really love our Code Reading Club. It is interesting to me to practice reading unfamiliar code and to deliberately practice that skill. But what’s even more interesting is to learn from everybody’s different perspectives, the different interpretations and conclusions based on different backgrounds and knowledge. What is clear or obvious to one person might not be to someone else. Hopefully that insight will translate into code we write in the future to make it clearer to others, as well as provide us with empathy and understanding for the writers of the code we read (in our club or at work). I’d highly recommend trying out a Code Reading session when you get a chance, or even to start your own Code Reading Club.