There are several reasons why you might want to move a commit to a different branch. Let’s take a look at some of them.
Committed to the wrong branch
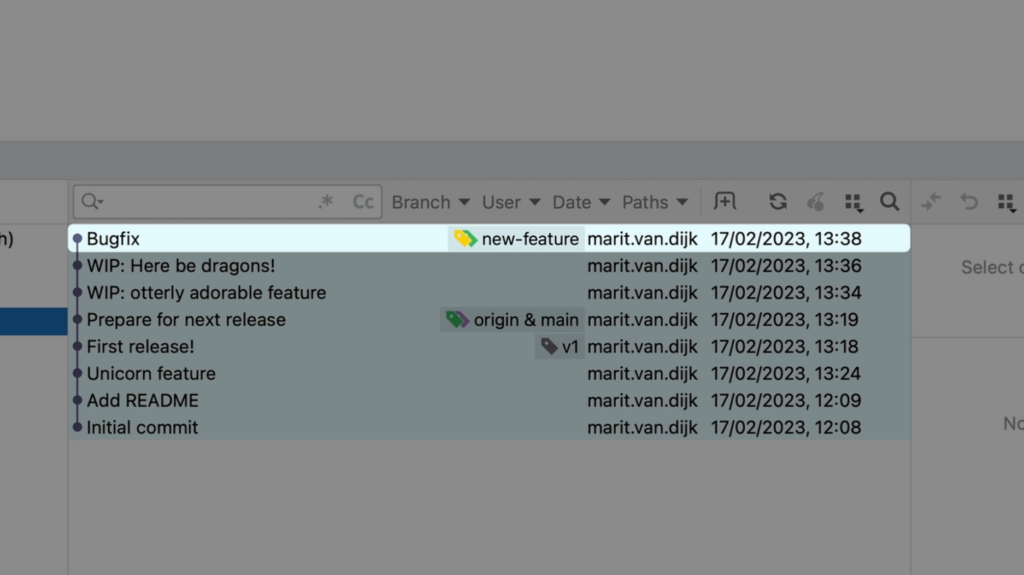
You’re working on a new feature, but an urgent bug came in. You fixed the bug and committed the fix, but oops… you forgot to create a new branch for the bugfix! Now this bugfix is on the wrong branch. How do we fix this?
Bugfix commit is on the wrong branch
Use cherry-pick to move the commit
I could redo the work, especially if it’s a small change, but … I don’t want to! Luckily, there is a better way.
We only want to move this one commit from the feature branch to a separate bugfix branch. We can do this using Git’s “cherry pick” option from IntelliJ IDEA.
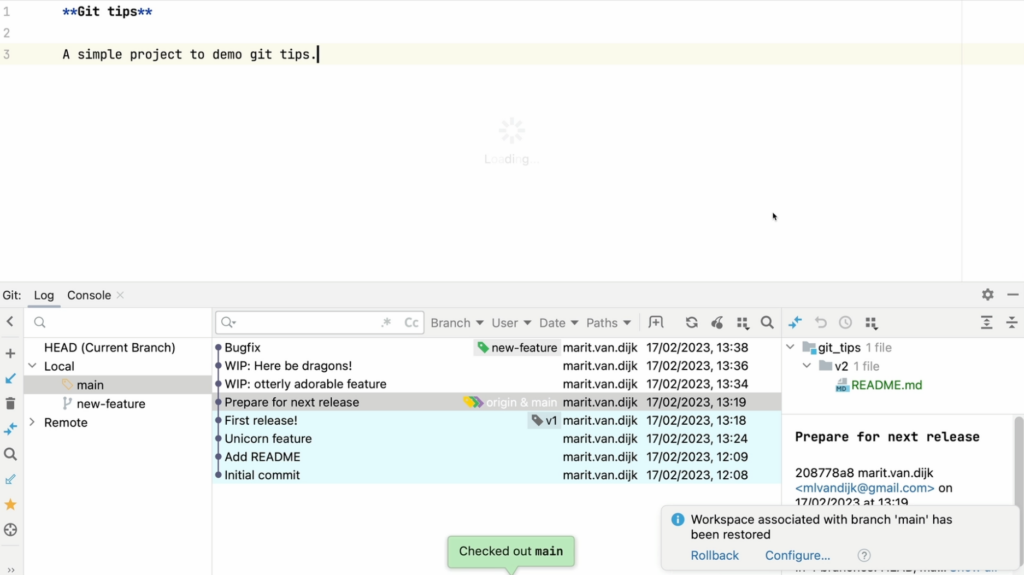
First, let’s go back to main and create the bugfix branch that we should have created in the first place.
Back on the main branch
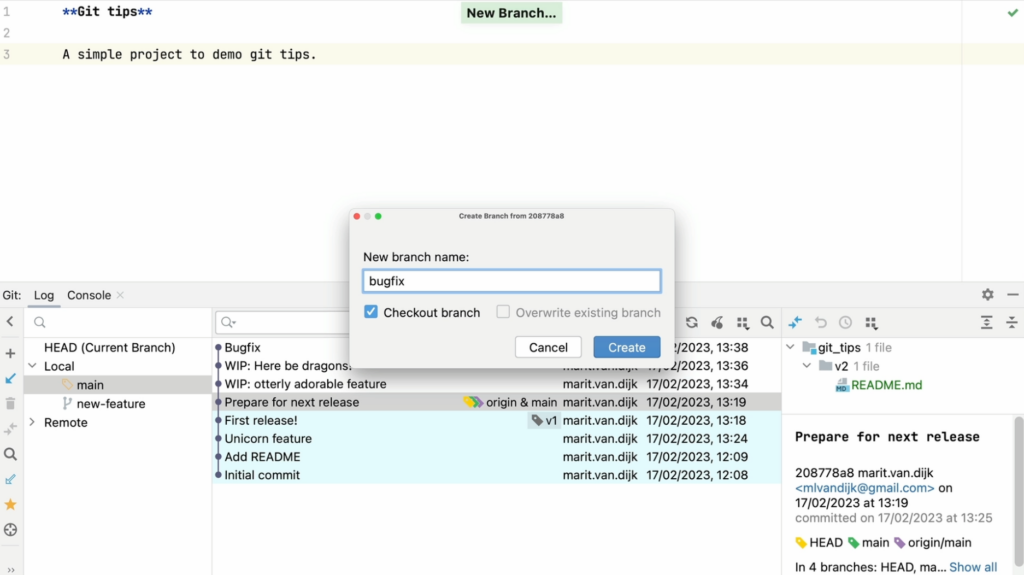
Once we’re back on the main branch, we can create a new branch named “bugfix”.
Create a new Bugfix branch
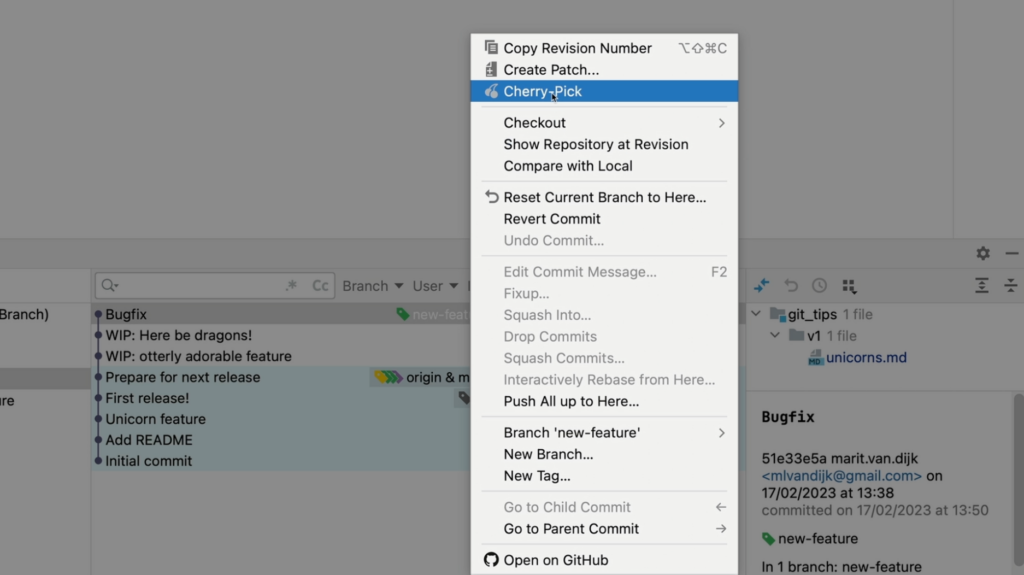
On the newly created branch, we can select the bugfix commit from the other branch and select Cherry-Pick to apply that commit to our current branch.
Cherry Pick the selected commit from the context menu
Cherry-pick from the command line
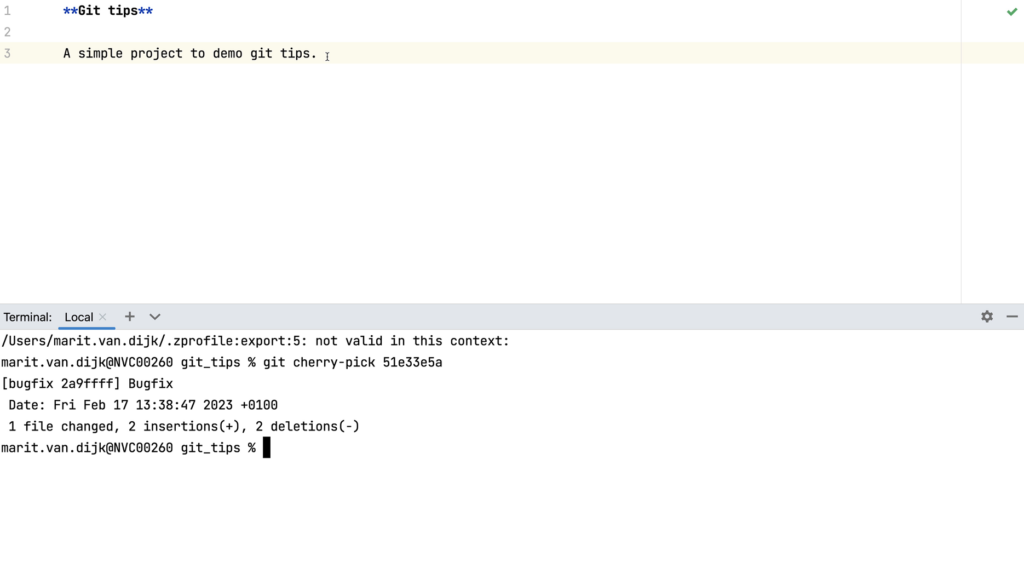
Yes, we can do this from the command linetoo, but there’s no cute cherry icon on the command line. To cherry-pick a commit from the command line, we can use the command git cherry-pick <commit hash>. We would need to find the commit hash of the commit we want to cherry-pick, which we can find for example in the Commit Details pane in the Git log window (see below).
Cherry-pick on the command line
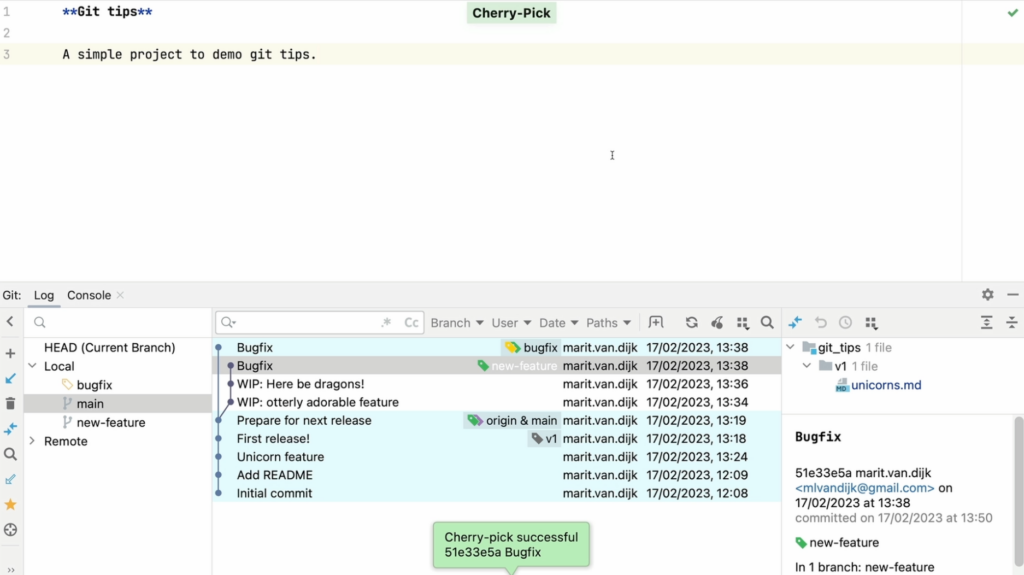
As we can see, the bugfix commit is now on the bugfix branch.
Cherry-pick successful
Other use cases for cherry-picking
Cherry picking can be useful in other situations too. Let’s take a look at some other use cases for cherry-picking.
Backporting a fix
We can also use cherry-picking to backport a fix to a previous release branch. For example, let’s move our bugfix commit also to the v1-release.
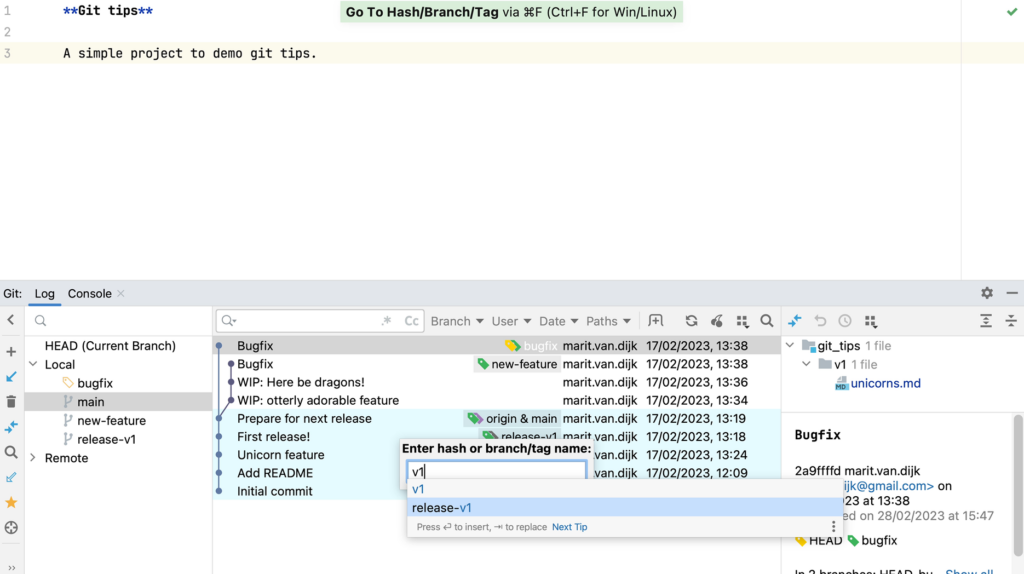
To do so, first we need to look for the last release (v1). We can search for a specific commit hash, branch or tag name in the Git log (⌘ F on Mac or Ctrl+F on Windows/Linux).
Search Git log for Hash/Branch/Tag
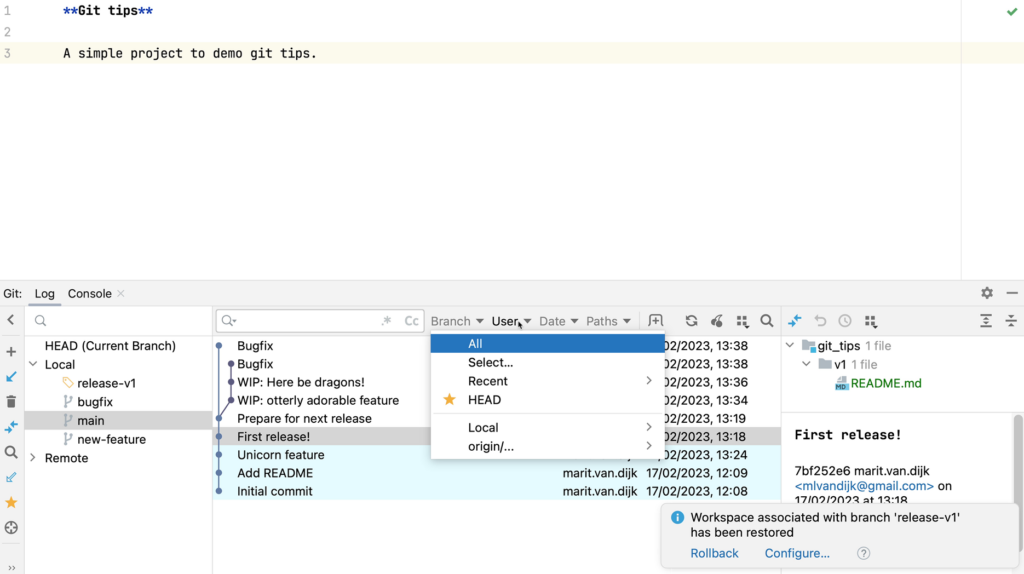
We can also filter commits in the commit log by branch, user, date or path.
Filter by branch, user, date or path
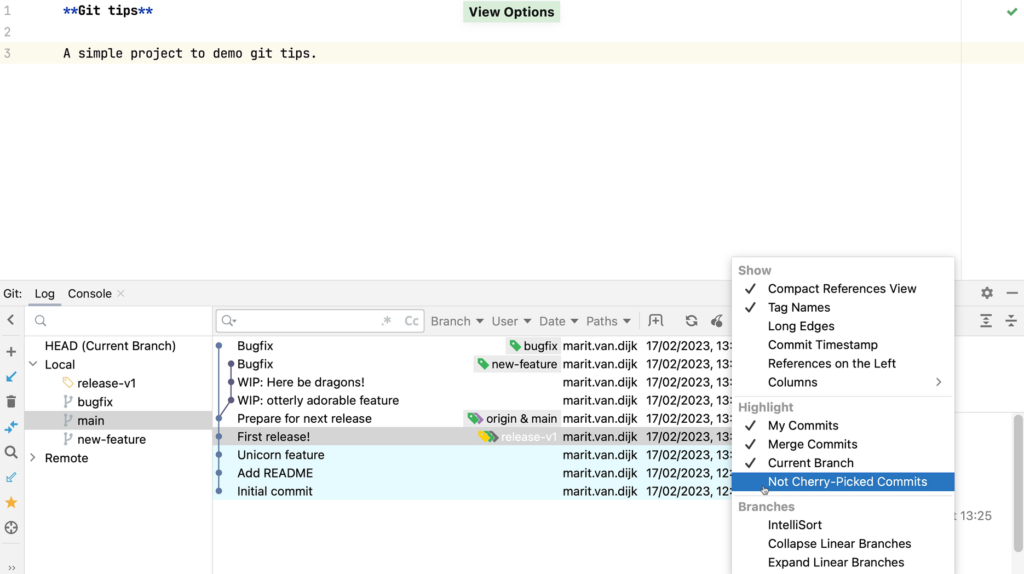
To see which commits have not yet been applied to this branch, we can click View Options and select Highlight | Not Cherry-Picked Commits. We’ll compare with the new-feature branch. Commits that have already been applied to the current branch are greyed out.
Select the Not Cherry-Picked Commits
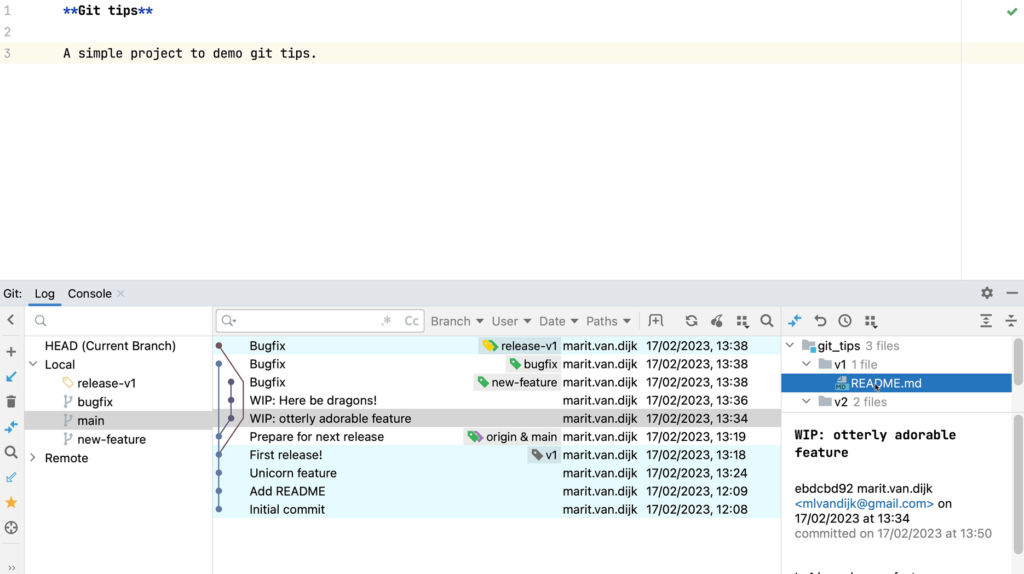
When we select a commit, we can look at the information in the Commit Details area (at the bottom right) to make sure these are the changes we want to transfer to this branch. In the Commit Details area we can see which files were changed in a particular commit. We can right-click a file and select Show Diff from the context menu to open the changes that were made to that file.
Look at the details of a commit
If we are sure these are the changes we want, we can cherry-pick them to the previous release branch.
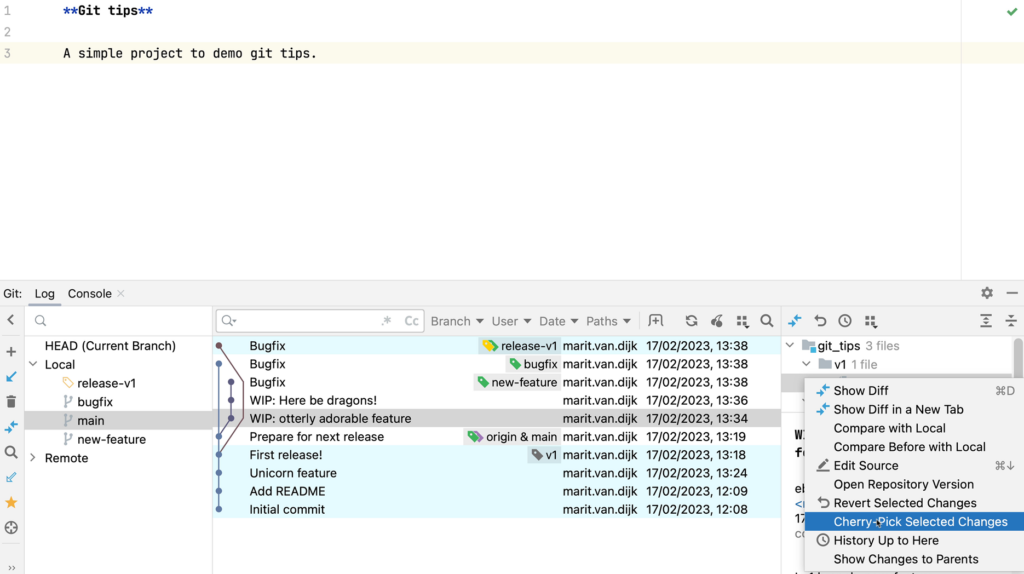
Cherry pick part of a commit
In the Commit details pane on the right, select the files containing the changes you want to apply to the target branch, right-click and select Cherry-Pick Selected Changes from the context menu.
Cherry-Pick Selected Changes
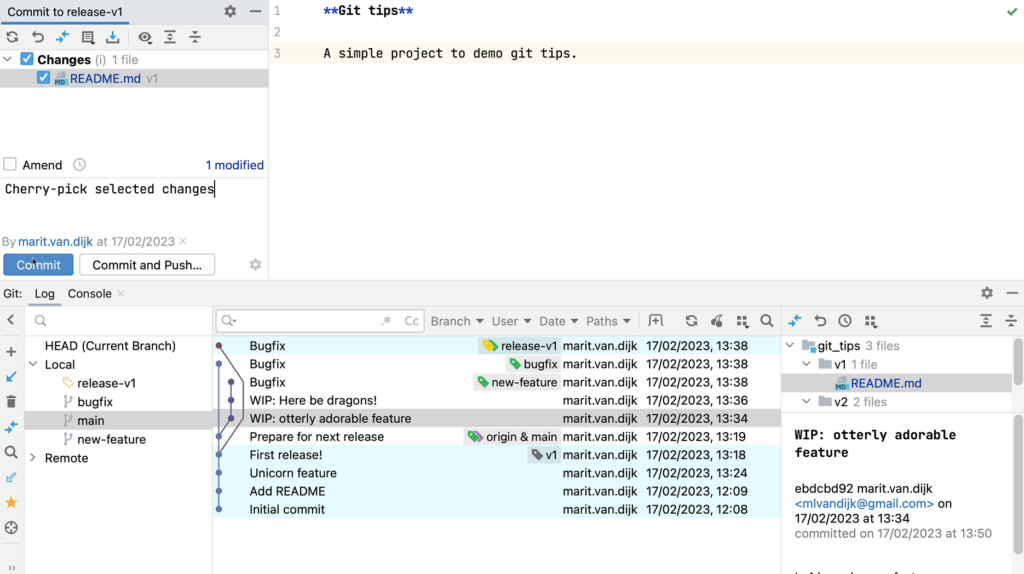
The cherry picked changes are transferred to the change list and we can commit them from there.
Partial commit added to the Change List to be committed
Dealing with conflicts
So far, cherry picking went smoothly because there are no conflicting changes. What if there are conflicts?!
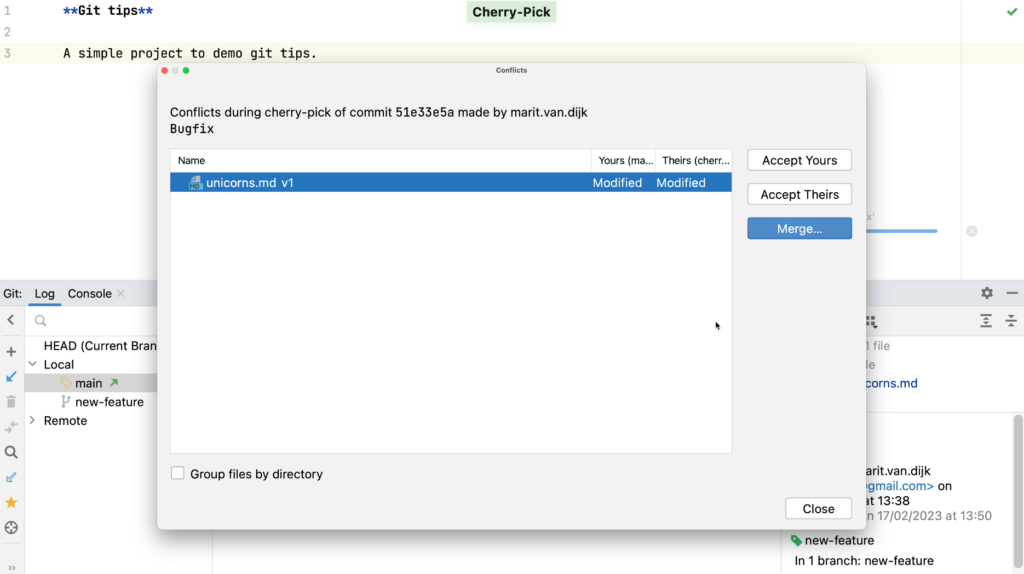
When we cherry-pick a commit that has conflicts with our current branch, the Merge Conflicts dialog opens.
Merge Conflict
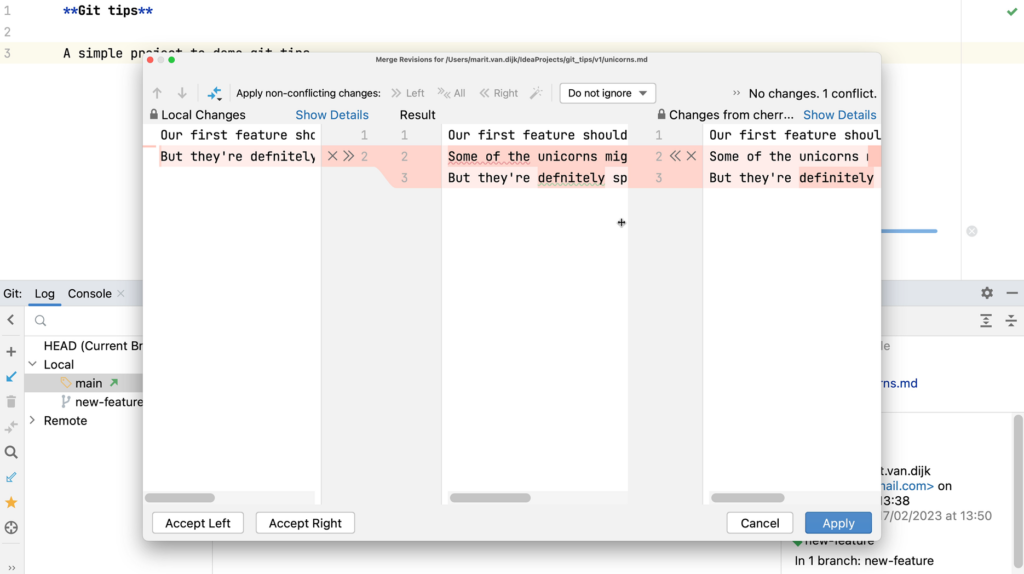
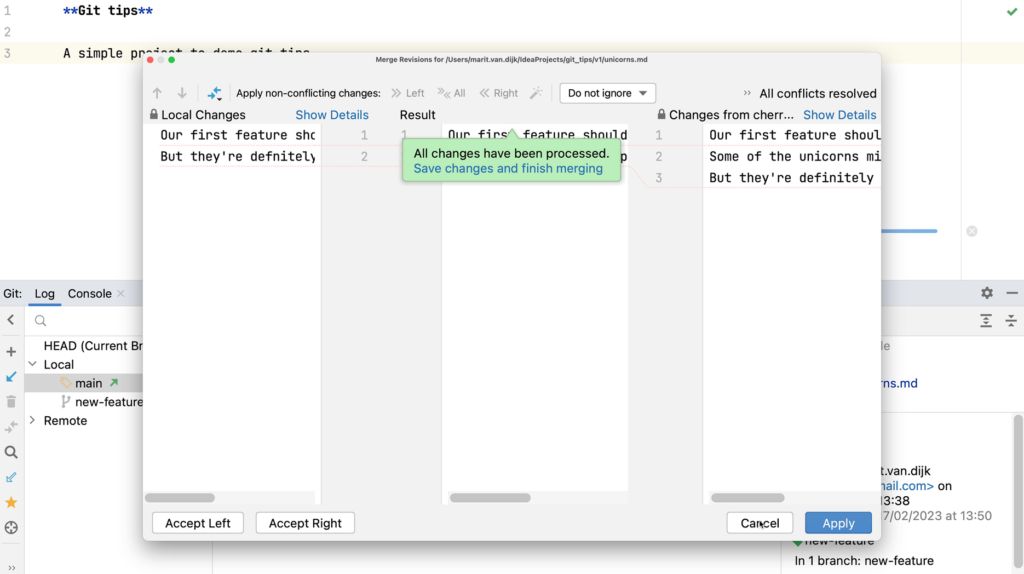
We can resolve the merge conflicts here. We want to keep some changes, and reject others.
Merge Conflicts dialogMerge conflicts have been resolved
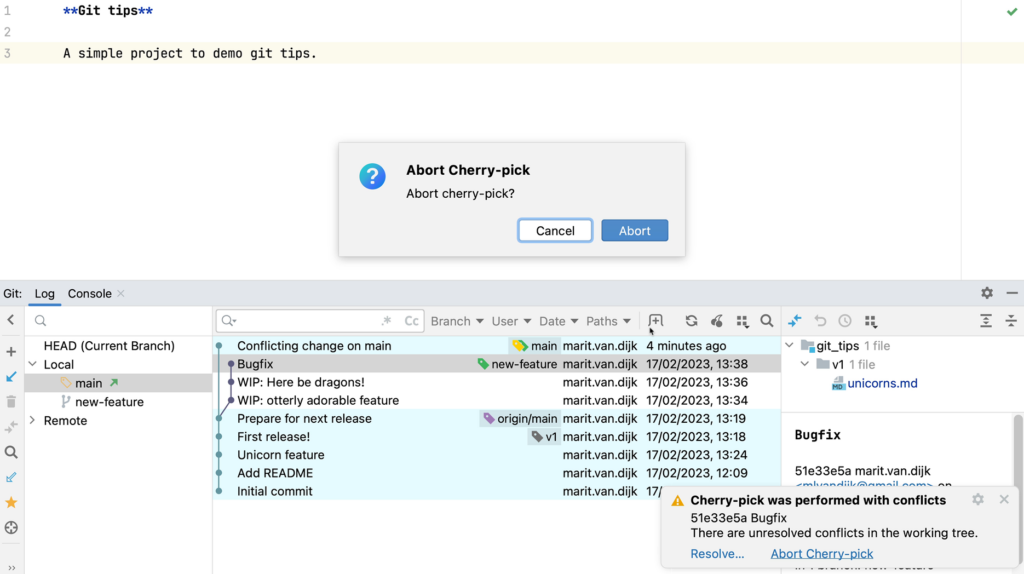
If you’re not able to resolve the merge conflicts, you can also abort the cherry pick.
Abort Cherry-pick
Continue after cherry-picking
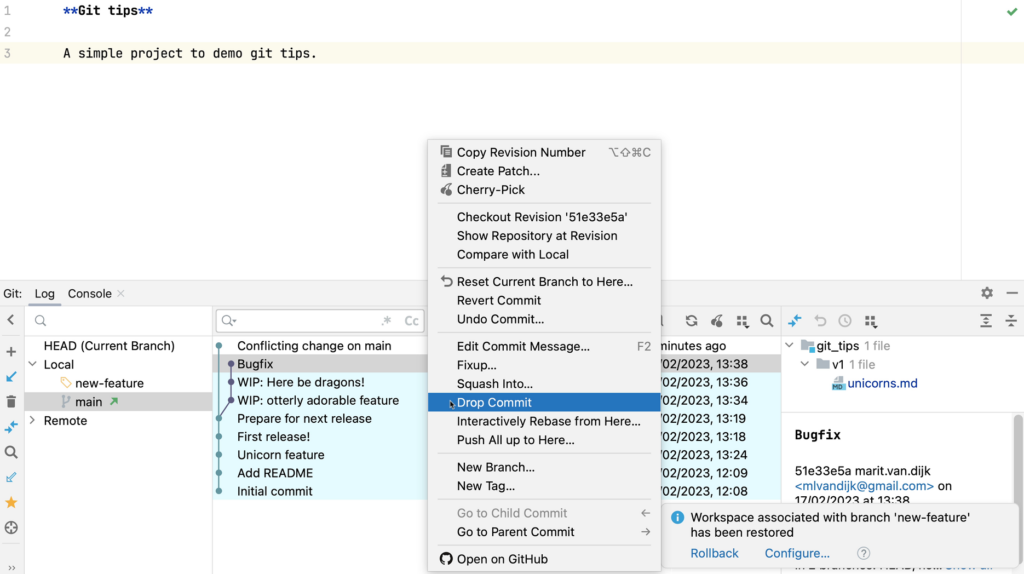
Once we’re done cherry-picking, we can go back to the “feature” branch. Since we haven’t pushed these changes yet, we can remove the commit from the feature branch by selecting Drop commit.
Drop Commit
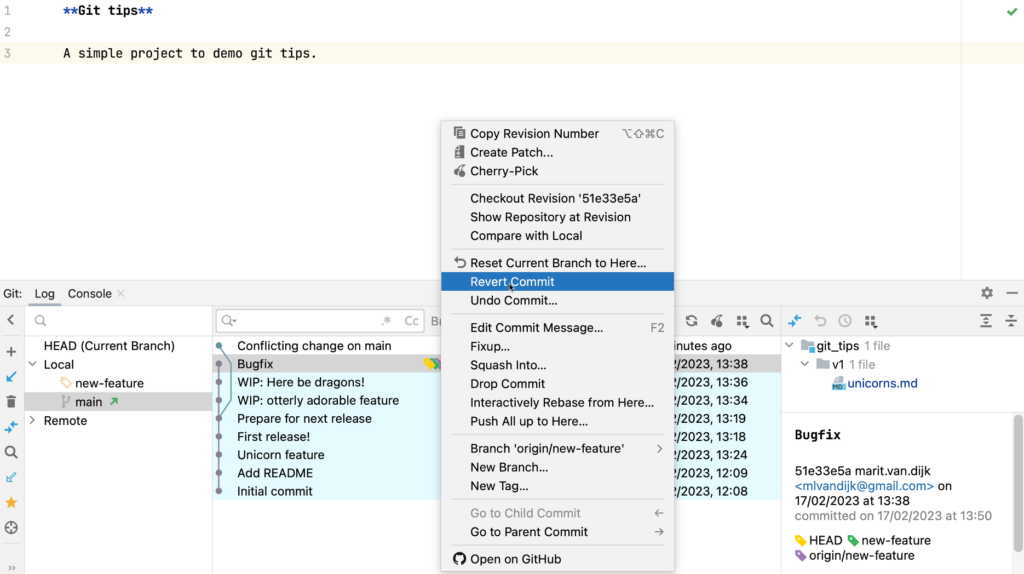
What if you have pushed the changes already? Then you might want to revert it on this branch instead. Right-click the commit and from the context menu select Revert Commit.
Revert Commit
Now we can continue working on the new feature!
Conclusion
Moving a commit to a different branch. Not nearly as scary as it sounds! Let the IDE help to turn this into a quick, low-stress task.
Cherry pick a commit to a different branch in any JetBrains IDE
Oops, you committed your code to the wrong branch… You could redo the work, but you don’t want to! Luckily, the IDE can help you move your commit to a different branch. Use Git’s cherry-pick option from your IDE to move changes over to a different branch in a quick, low-stress way.
Oops, you committed your code to the wrong branch… You could redo the work, but you don’t want to! Luckily, the IDE can help you move your commit to a different branch. Use Git’s cherry-pick option from your IDE to move changes over to a different branch in a quick, low-stress way.
Any real world Java project will likely use external dependencies. As we’ve seen over the last few years, it’s important to keep these dependencies up to date. We used to have to manually check for updates, but fortunately these days there are tools available that can help us with this. Because, let’s be honest, most developers don’t enjoy maintaining applications. We’d much rather be using cool new tools and/or language features, and solving interesting problems. Sorry, I mean: delivering business value! But we are responsible for keeping our dependencies up to date, so let’s make that as easy as possible. In this blog post we will look at one category of tools that can help us: bots that can automatically create pull requests (PRs) to keep dependencies secure and up to date.
For Java, we currently have three options: Dependabot, Renovate and Snyk Open Source. They each support other programming languages too, but as I mostly use Java and other JVM languages I have limited myself to these. Let’s take a look at which features they provide and their similarities and differences.
Sidenote: In order to try out and compare these bots, I’ve added them one by one to my personal GitHub profile and will describe here how to add them to your GitHub profile, as well as link to information about other integration options.
Dependabot
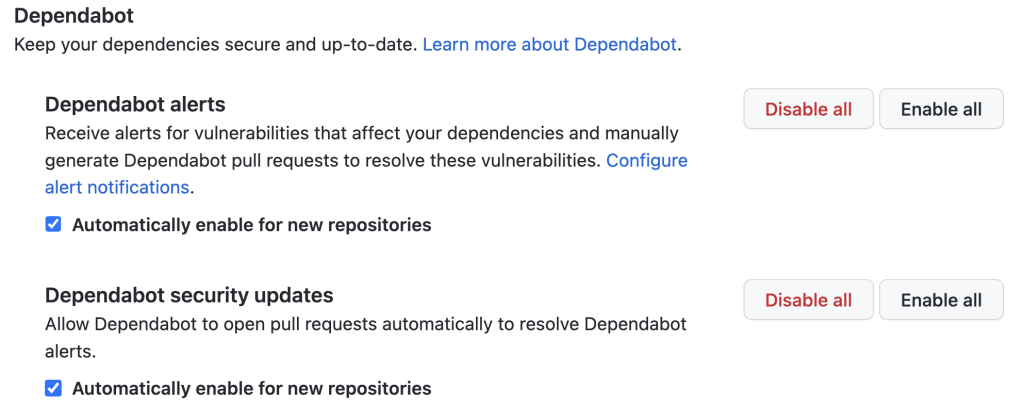
The first bot we will look at is Dependabot. Since Dependabot is GitHub native, we can enable most of its features from the Settings > Security > Code security and analysis. Here we can enable (or disable) the available features, and select which ones we would like to automatically enable for new repositories.
Dependabot settings on GitHub
Features
Dependabot offers the following features: Alerts, security updates and vulnerability updates.
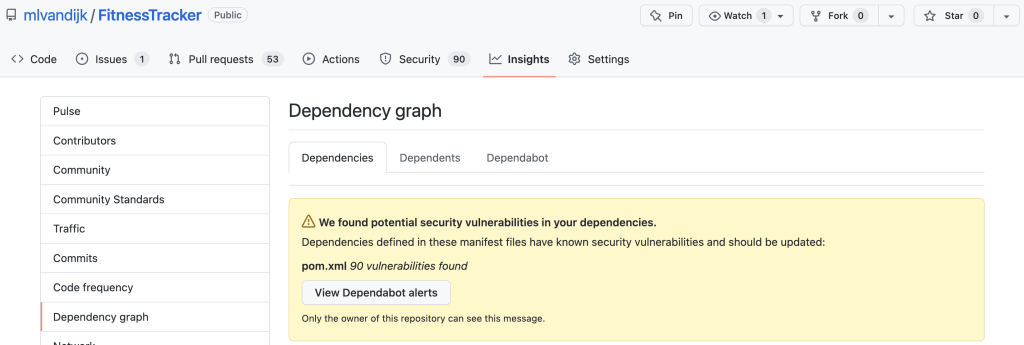
When Dependabot is enabled, it provides a Dependency Graph under the Insights tab of your project. The Dependencies tab shows any alerts to the owner of the repository. The Dependents tab shows any projects that depend on your project. In the Dependabot tab version updates can be configured.
When we enable Dependabot alerts, we will receive alerts for vulnerabilities in our repositories and we can manually generate pull requests (PRs) to resolve them. We can configure how we would like to receive these alerts. We can also view them in the Dependency Graph in the Dependencies tab.
Dependabot Dependencies graph
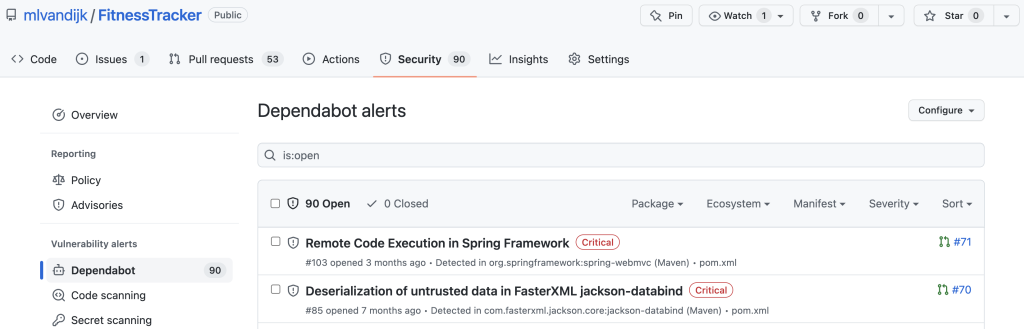
We can click the button to View Dependabot alerts to see more information about the alerts.
Dependabot alerts
Pull requests
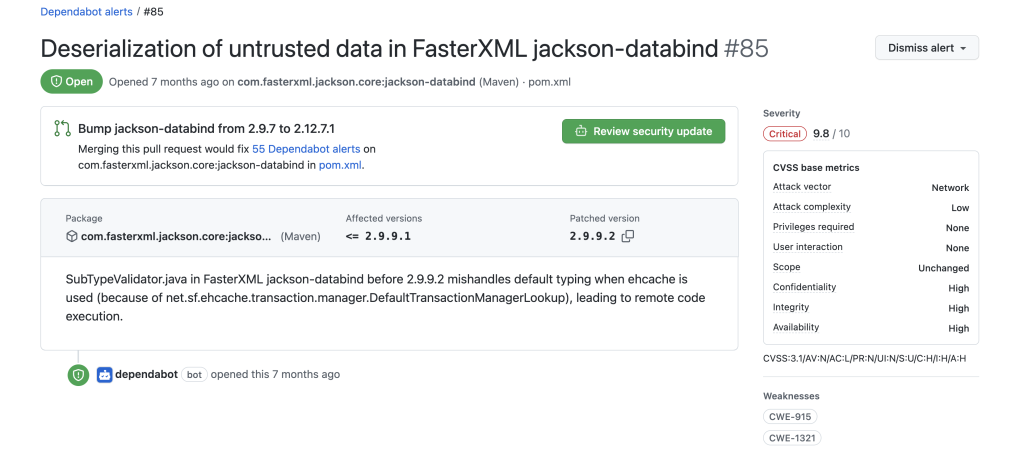
When we enable Dependabot security updates, Dependabot will open pull requests (PRs) automatically to resolve vulnerabilities. These PRs provide information about the severity of the vulnerability, CVSS base metrics, and CVEs. We can hover over the CVSS base metrics and CVEs to get more information. We can review the changes, or dismiss the alert.
Dependabot security update
To enable version updates, you need to add a dependabot.yml file to your repository.
Configuration
In this configuration file, you need to provide the package manager, the directory that contains your manifest file and a scheduling interval (daily, weekly, or monthly). You can configure more options, like when it should be scheduled (date, time, timezone), the maximum number of PRs (the default is 5), rebase strategy, settings that can help you manage the PRs like target branch, assignees, reviewers, commit messages and labels, and more. For more information on configuration options, see the Dependabot documentation on configuration.
Like Dependabot, Renovate offers security updates and version updates. In addition, Renovate will also create a project dashboard listing all updates needed on a particular project.
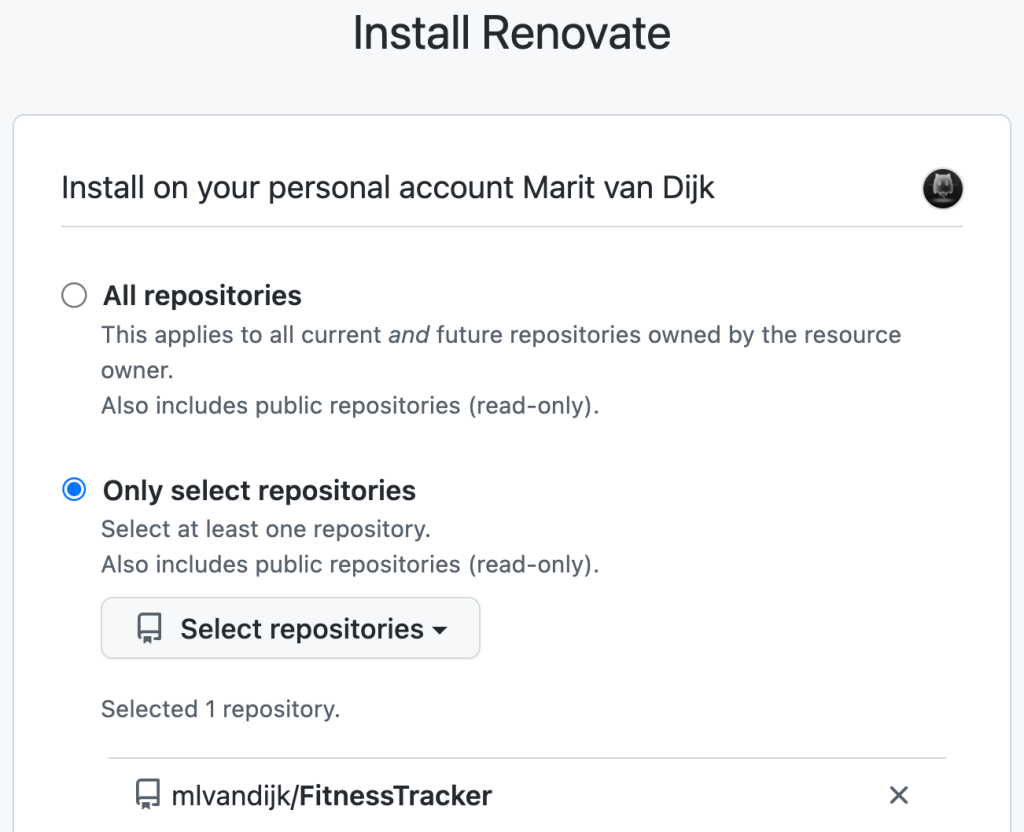
Renovate is available on GitHub via a GitHub app. To configure Renovate for your GitHub account, go to https://github.com/apps/renovate. Renovate allows you to set Repository access to either All repositories or Only select repositories. Renovate is the only one of these three options that allows you to try it out on only one repository first, so if you’ve never used one of these bots, I’d recommend starting with Renovate on one repository.
Install Renovate
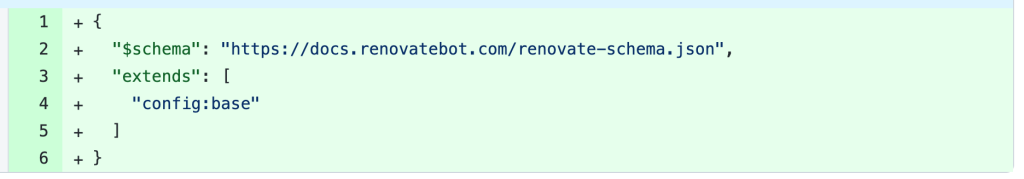
Renovate will create an onboarding pull request to the selected repositories. The onboarding PR contains basic configuration for Renovate to run. It describes the configuration in a Configuration Summary, and provides some information about What to Expect when the PR is merged (in this example, a list of PRs that will be opened).
Renovate Onboarding PRRenovate What to ExpectRenovate basic configuration
Note: These screenshots were taken from the PR created in September 2022. It may have changed since then.
Configuration
Renovate offers additional configuration options. In addition to setting a maximum number of PRs, Renovate allows you to to set a maximum number of concurrent branches or even an hourly limit, which can help to keep the number of open PRs and branches manageable. Renovate also lets you configure when to rebase (or not), and settings to help you manage the PRs assignees, reviewers, commit messages, labels, and more. Overall, Renovate offers more configuration options, and these options are more fine-grained than Dependabot’s options.
Once the onboarding PR is merged and the configuration file is added to your repository, Renovate will start opening pull requests with updates on the selected repositories.
Renovate pull request
Pull requests
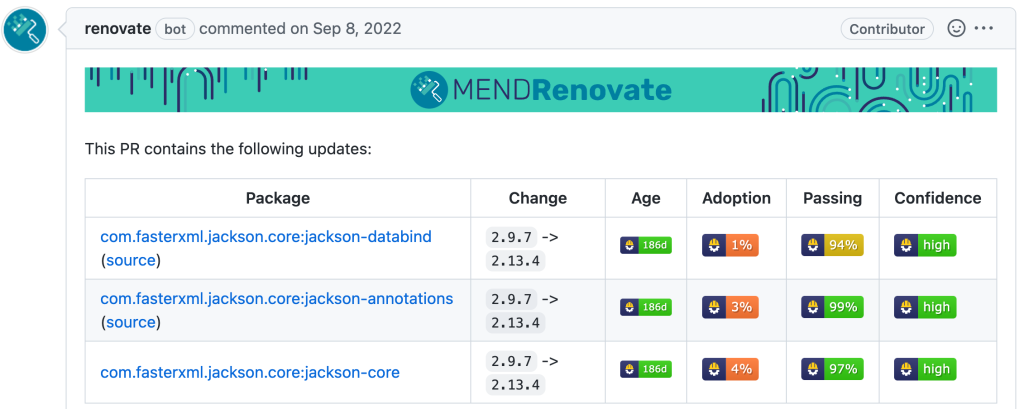
These PRs contain information about the reason a PR was created including which package was updated, the current and new version, as well as the following information to help you decide whether or not to merge the PR and apply the update (apart from your build being green).
Age: The age of the package
Adoption: The percentage of this package’s users (within Renovate) which are using this release
Passing: The percentage of updates which have passing tests for this package
In addition, Renovate offers the option for rule based auto merging of PRs; a feature that lets you automate upgrading dependencies. When auto merging is enabled, Renovate tries to merge the proposed update once the tests pass. Renovate recommends that you enable auto merge only for any type of dependency updates which you would just merge anyway, and keeping auto merge disabled for updates where you want to review the release notes and/or code before merging. Of course, great test coverage is also very helpful here! Renovate is currently the only of these three options that offers this feature.
Dashboards
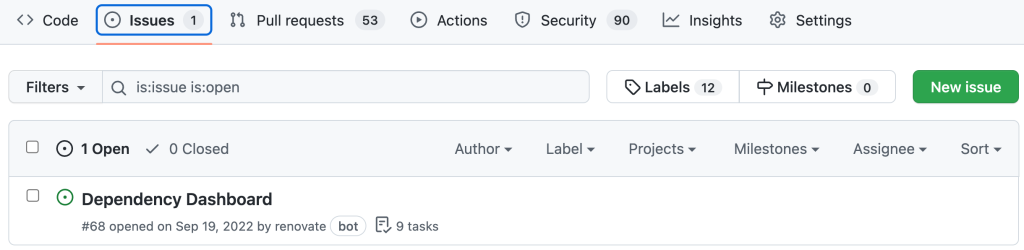
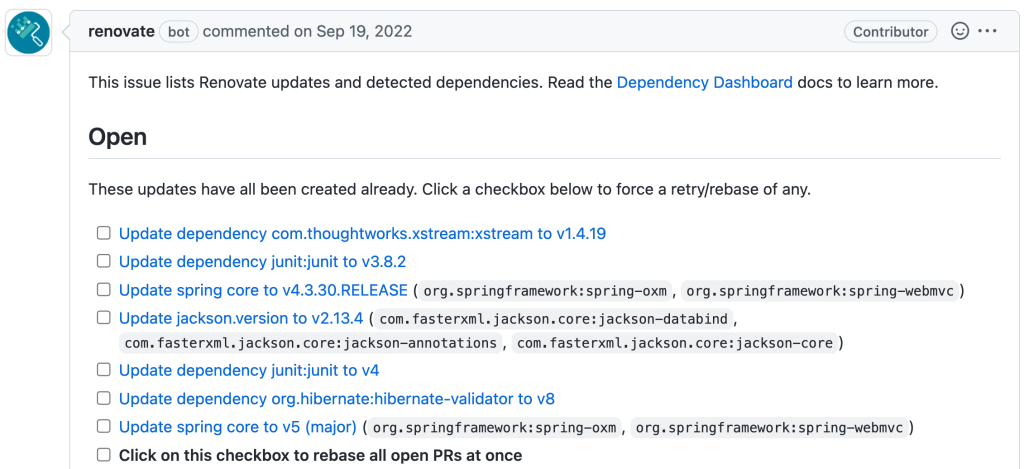
Finally, Renovate will add a Dependency Dashboard to your project, listing all Renovate updates and detected dependencies. This dashboard can be enabled or disabled as desired.
In addition, Renovate provides a general dashboard with all projects & jobs run, which you can find under https://app.renovatebot.com/dashboard if you have Renovate enabled.
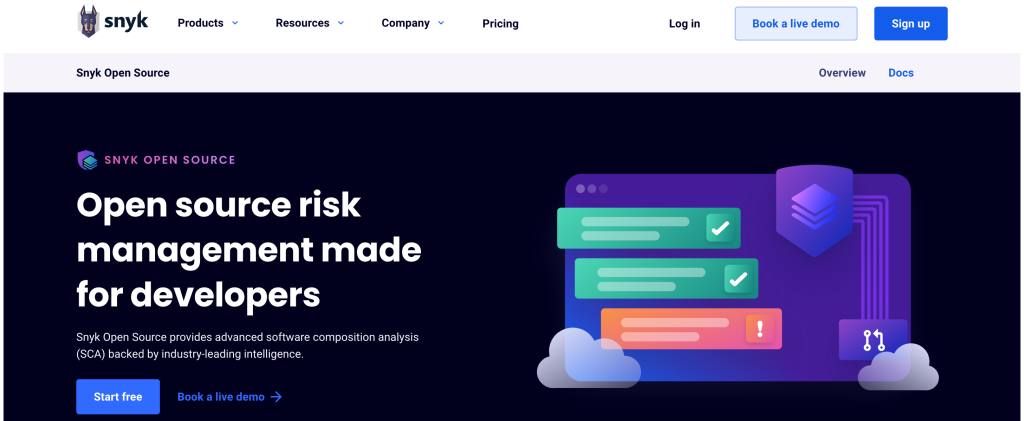
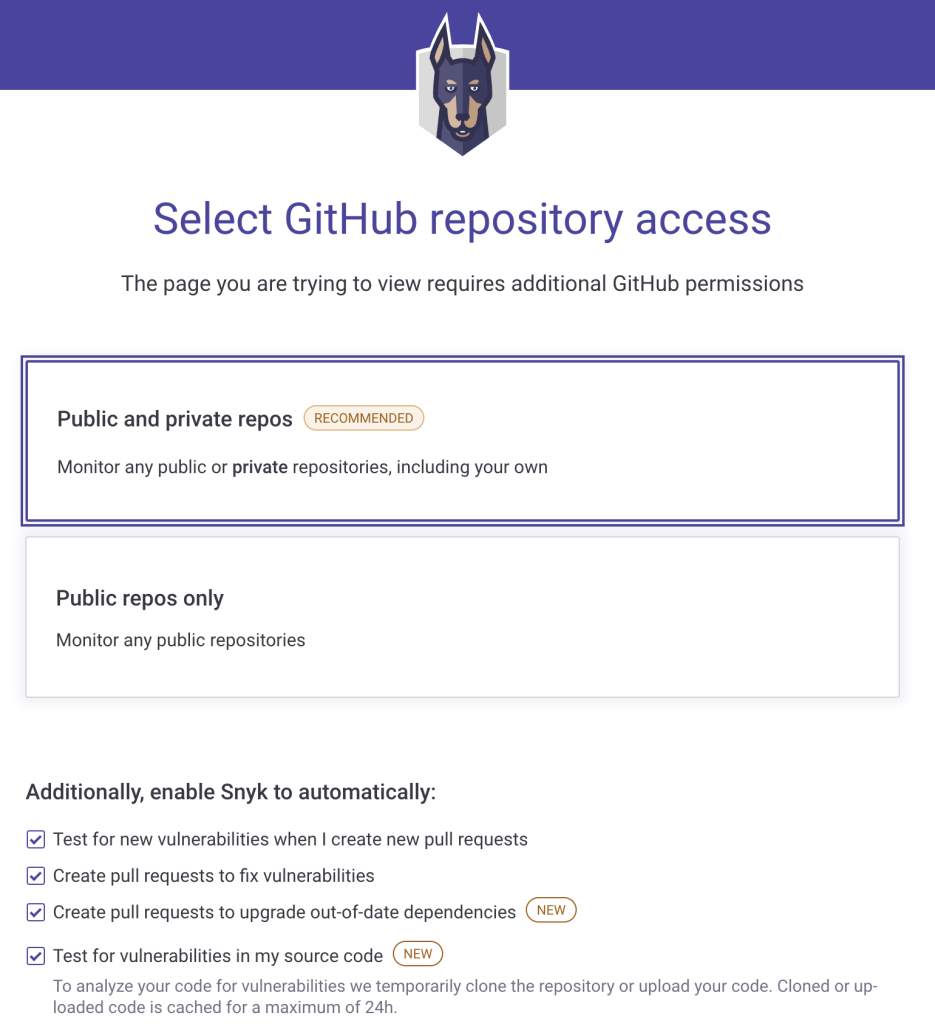
Snyk Open Source is available from Snyk. There are more steps to enable it for your GitHub Profile, but it also offers more features. To enable Snyk Open Source, go to https://snyk.io/product/open-source-security-management/ and select Start free. You will need to Authorize snyk on your GitHub profile, select repository access (either Public and private repos or Public repos only), select other available features you want to use, and provide a Personal access token on GitHub.
Snyk Open Source Start free
Features
In addition to security updates, version updates, and dashboards, Snyk Open Source offers to test for new vulnerabilities and/or test for vulnerabilities in source code. These options are currently not offered by Dependabot or Renovate. As this blog post focussed on tools to help you detect possible vulnerabilities in your dependencies and automatically create PRs to upgrade them, we will not look at scanning the source code for vulnerabilities here.
Snyk Open Source GitHub repository access and additional features
Pull requests
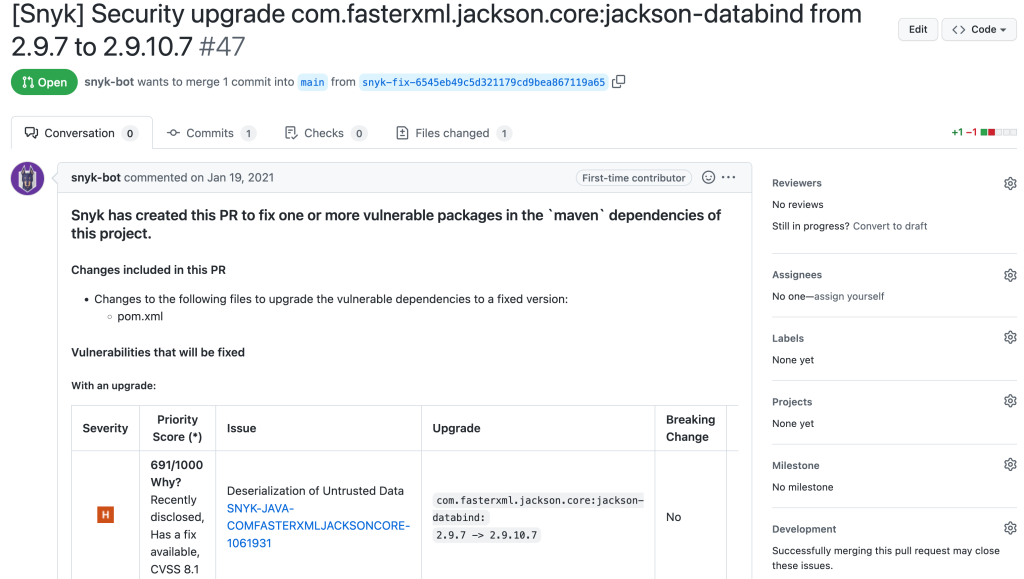
When enabled, Snyk Open Source will open PRs on the selected repositories. These PRs also include information about the reason for the PR, severity of a vulnerability, priority score and why it has this score, details of the version upgrade (current and new version), and more.
Snyk Open Source pull request
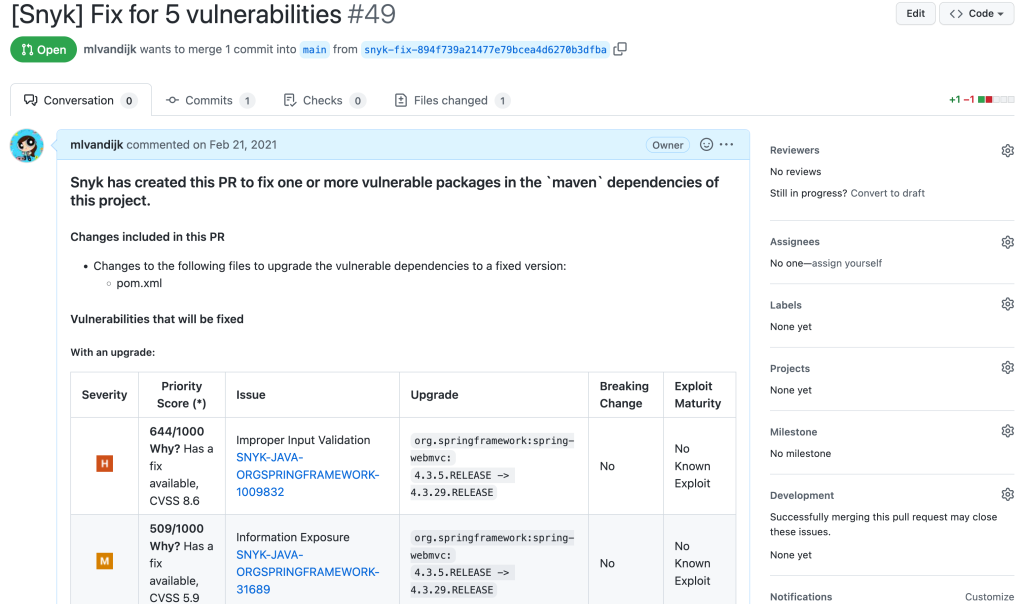
By default, Snyk Open Source will combine related updates into one single PR to help reduce the noise. Dependabot does not currently offer this option, while Renovate can be configured to do something similar.
Snyk Open Source combined PR
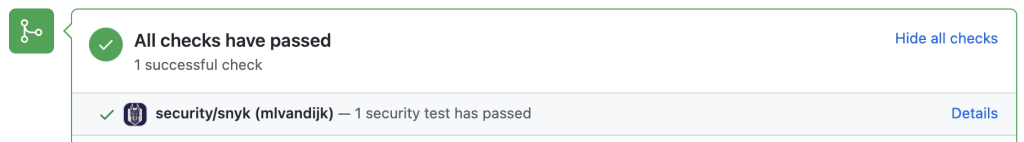
Snyk Open Source also has the option to test for new vulnerabilities. When enabled, incoming PRs will be checked for known vulnerabilities to make sure that no known vulnerabilities are added to the code base. Dependabot and Renovate do not currently offer this feature.
Snyk Open Source security test on PRs
Configuration
We can configure the frequency with which Snyk Open Source should run (daily, weekly, never). We can enable or disable scanning for new and/or known vulnerabilities, so we can clear our backlog of known vulnerabilities separately from making sure we don’t get any new vulnerabilities. This might help getting started with updating outdated dependencies without getting overwhelmed with too many updates. Dependabot and Renovate do not currently offer this option. Finally, we can also enable or disable PRs for a single project, so we can start using Snyk Open Source on a single project like we can with Renovate, but this is not a default option.
Dashboards
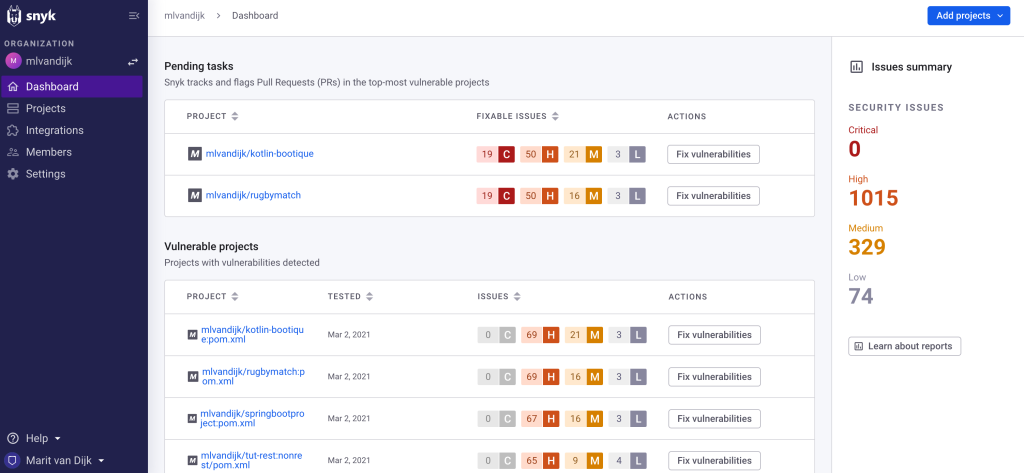
The dashboards offered by Snyk Open Source are the most extensive of these three options. The dashboards provide an overview of known vulnerabilities found in your repositories with the number of vulnerabilities and their severity visible per project and overall.
Snyk Open Source Dashboard
Integration
You can use Snyk Open Source in the Snyk Web UI, with the Snyk CLI, in your IDE, or with an API. For more information, see the Snyk Open Source documentation.
Conclusion
As we have seen, the different bots offer different features. All of the options discussed here can automatically open pull requests for vulnerable dependencies and version upgrades. The information they provide with these PRs differs, as do the number and type of configuration options. Which bot is right for you will depend on needs and preferences.
In this blog post, we’re going to take a look at using bookmarks in IntelliJ IDEA. Bookmarks can come in handy while navigating a codebase, when you see something interesting that you want to come back to later. You could use Recent Files (⌘E on macOS, or Control+E on Windows/Linux) to find it, but then you have to remember which file it was. This is where bookmarks come in handy. Let’s take a look!
Add anonymous bookmarks
We can bookmark a line by pressing F3 (on macOS) or F11 (on Windows/Linux). This shortcut creates an anonymous line bookmark, marked with a Bookmark icon. If we don’t remember the shortcut, we can right-click the gutter next to the line of code we want to bookmark and select Add Bookmark.
Anonymous bookmarkAdd bookmark from gutter menu
We can also bookmark files, packages, folders, and modules. We can open the Project Tool Window (⌘1 on macOS, or Alt+1 on Windows/Linux) and add an anonymous bookmark. We can use the shortcut (F3 on macOS, or F11 on Windows/Linux) or, we can also right-click the item we want to bookmark, and select Bookmarks | Add Bookmark. Note that anonymous bookmarks don’t have an identifier, and we can create as many anonymous bookmarks as we like.
Bookmark a project item
Add mnemonic bookmarks
We can also create bookmarks that are assigned to a digit (0 to 9) or letter (A to Z). To add a mnemonic line bookmark, press ⌥ F3 (on macOS) or Control+F11 (on Windows/Linux) and press the digit or letter to use as an identifier for this bookmark. Again, we can also or right-click the gutter next to the line of code that you want to bookmark and select Add Mnemonic Bookmark.
Add mnemonic bookmark menu
Optionally, we can provide a description for the new bookmark. We can double-click the digit or letter we want to assign.
Add mnemonic bookmark
Lines marked with mnemonic bookmarks have the corresponding digit or letter icon in a frame.
Mnemonic bookmark
If the selected digit or letter is already in use, IntelliJ IDEA will ask you whether you want to overwrite an existing bookmark with the new one. When we select the Don’t ask again option, the IDE will silently overwrite mnemonics.
Rewrite mnemonic
Navigate to bookmarks
There are several options to navigate to the bookmarks we have created.
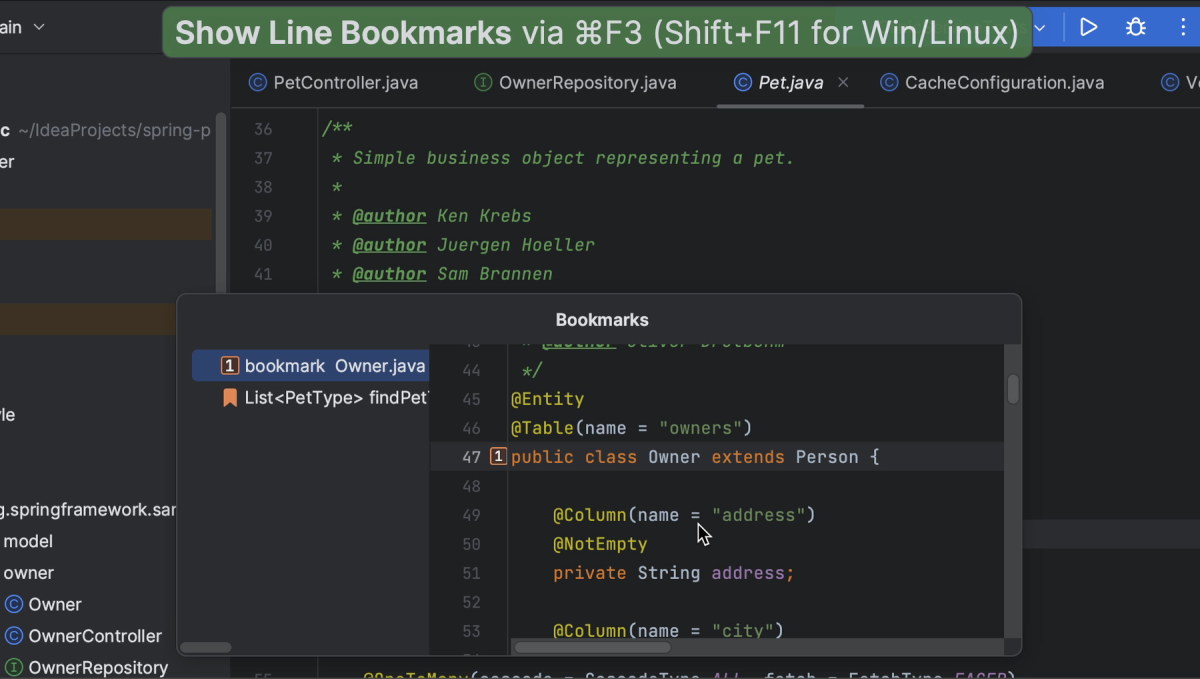
Show line bookmarks
To see all line bookmarks that we have in the code, we can open the Bookmarks popup by pressing ⌘ F3 (on macOS) or Shift+F11 (on Windows/Linux) or go to Edit | Bookmarks | Show Line Bookmarks.
Show Line Bookmarks shortcutShow Line Bookmarks menu
Notice that this list does not contain any project items like files or classes that we have bookmarked. In the Bookmarks popup, we can select the bookmark we want to navigate to, either with up and down arrows and pressing Return (on macOS) or Enter (on Windows/Linux), or by double-clicking it with our mouse. For mnemonic bookmarks, we can select the corresponding digit or letter.
Bookmarks popup
Jump to mnemonic bookmark
To jump straight to a mnemonic bookmark, hold ^ (on macOS) or Control (on Windows/Linux) and press the mnemonic digit or letter on the keyboard. This doesn’t work with anonymous bookmarks, but we can assign a mnemonic to an existing anonymous bookmark, either using the shortcut, or by clicking the bookmark in the gutter and selecting Assign Mnemonic. This works in the Bookmarks popup too!
Go to BookmarkAssign Mnemonic
Bookmarks tool window
To see all our bookmarks, we can open the Bookmarks tool window by pressing ⌘ 2 (on macOS) or Alt+2 (on Windows/Linux), or by selecting View | Tool Windows | Bookmarks from the main menu.
Open Bookmarks tool window (shortcut)Open Bookmarks tool window menu
IntelliJ IDEA adds your bookmarks to the predefined list in the Bookmarks tool window that is created automatically and has the same name as the project. In this example, multiple bookmarks in the same file are grouped together. We can also turn that off in the Options menu, by deselecting Group Line Bookmarks by File. As we can see, there are several other options as well. We won’t dive into all of them, but be aware there are some options you can configure to your liking.
Bookmark tool window options
Bookmark lists
Another option we do want to show you here is that you can create more lists. We can add a new list using the shortcut (⌘ N on macOS or Alt+Insert on Windows/Linux) or by clicking the Create Bookmark List button. We can add a name for the new list.
Create Bookmark List
If there are multiple lists, and we create a new bookmark, we can select which list to add it to in the Add Bookmark popup. We can also select the list to use as the default by checking the option Use as default list.
Select Bookmark List
In the Bookmarks tool window, we can move bookmarks to another list by dragging them to the other list. And we can sort bookmarks by selecting a bookmark and using Move down (⌥ ⌘ ↓ on macOS, or Control+Alt+↓ on Windows/Linux) or Move up (⌥ ⌘ ↑ on macOS, or Control+Alt+↑ on Windows/Linux).
Move down
Fun fact: The Bookmarks tool window also shows all breakpoints that are automatically added to the dedicated list once you place them in your code.
Breakpoints
Bookmark editor tabs
Finally, we can also bookmark editor tabs. Click the … to the right of the tabs and select Bookmark Open Tabs. We can enter a name for this list in the Create Bookmark List popup.
Bookmark Open TabsCreate Bookmark List popup
Summary and Shortcuts
As we’ve seen, bookmarks allow us to “save” certain interesting locations in the code base, so we can easily go back to them later. Now we know how to create bookmarks and how to navigate to bookmarks we have created.
IntelliJ IDEA Shortcuts Used
Here are the IntelliJ IDEA shortcuts that we used.
When navigating a codebase we might see something interesting that we want to come back to later. This is where bookmarks can come in handy. Let’s take a look!
We can bookmark a line by pressing F3 (on macOS) or F11 (on Windows/Linux). This shortcut creates an anonymous line bookmark, marked with a Bookmark icon. If we don’t remember the shortcut, we can right-click the gutter next to the line of code we want to bookmark and select Add Bookmark.
Links
(documentation) JetBrains IntelliJ IDEA – Bookmarks
Several months ago I heard or read about Code Reading Club for the first time. It might have been a tweet by Felienne Hermans, or it might have been in her excellent book The Programmer’s Brain, but I was intrigued. As a developer, I’ve often wondered what would be the best way to familiarise myself with a new codebase, or the best way to really understand what a specific piece of code does. Of course, I’ve learned several techniques over time, but the idea to deliberately practice reading code? Brilliant! So imagine my surprise when my friend Lisi Hocke reached out to ask me if I would be interested in joining her Code Reading Club. Well, yes!!
Online tooling
The club consists of several members in different countries and even different time zones and takes place online. We decided on a day and time that works for us, and use collaborative tools like Miro or Jamboard for our sessions. This means everyone needs to make sure to have the code sample printed, or have a digital copy they can annotate with a digital tool. (And no, this is not supposed to be an IDE or editor with syntax highlighting, as part of the exercises is to look at the structure of the code.)
Exercises
All of our sessions so far have used the same exercises, using a different code sample (in a different language) each time. The exercises are taken from the starter kit.
The first session was very well prepared with a Miro board that contained everything we needed for the online session. The board contained the exercises, the code example and (where needed) space for us to place virtual post-its with our comments.
Introduction
We started our first session with a round of introductions, since not everyone in the group knew each other. We try to repeat that when new people join, as unfortunately not everyone is able to join every session.
Setting the scene
We start each session writing down what we are looking forward to or are excited about, as well as what we are worried or confused about. In the first session these comments were more about our expectations for the Code Reading Club in general.
For example, people mentioned they were excited about the following:
Getting used to thinking through problems with unfamiliar tools & languages
Understanding how others think about programming
Taking advantage of our different experiences to learn more about code
Looking forward to learning – both about code and about new people
Some people also mentioned specific goals like getting better at code reviews, or improving their coding skills (from reading to writing).
In the next sessions the comments were sometimes more about how we were feeling (from being tired at the end of a long week, to being happy to see each other again) and about our progress in the club (for example, learning from each other, or fearful we’re not picking it up as quickly as we would like). What I love is that people feel safe in the group to share how they feel. And everyone is excited to learn with and from each other, and is supportive of each other.
First glance
The first exercise in code reading is called “First glance”. It literally asks to take a quick (1 minute) look at the code and note the first thing(s) you notice about it, and why. We’ve found that different people notice different things, for example things they are familiar with or confused about. Some people focus on which language it is, or which programming constructs they recognise, while others focus on naming, whether or not there are comments or even import statements.
What’s also interesting is to talk about why these are the first things you noticed. Do you read the code from top to bottom like you would a piece of text in natural language (like this blog post), or do you scan the code and look at the blocks of code first, before looking at details? Do you focus on known or unknown concepts? All of these are opportunities to learn from each other and look at code differently next time.
Code structure
The next exercise is to examine the structure of the code, or rather its components or elements. We mark the variables, functions/methods, and object instances. It can be very interesting to identify these in a “foreign” programming language! We also draw connections between these elements in the code; for example, linking where a variable is used throughout the code, or a method call to a method. This exercise is intended specifically to look at the structure of the code, and not its purpose. This turns out to be very hard, especially for people who really like to understand what’s going on! (Don’t worry, we’ll get there!)
Content
Next, we each identify the 5 most important lines of code. We notice that not everybody chooses the same lines, so we also discuss why people chose those lines in particular and learn from each other’s insights. For example, we don’t always have the same understanding of the meaning of “important”; does it mean important for the code to execute, or to understand what the code does? If the former, you might choose a main method as an important line of code. If the latter, you might choose a comment. Other people look at which lines are important for the control flow, or which lines are important to determine what to test (since some of the team members have a testing background).
Summary
The last exercise is to summarize the purpose of the code, or to describe what you think the code does to the best of your ability. It is interesting to see whether people have the same understanding of the code or not, but more interesting to see which information they use to get there. What strategies do they use to come to that particular understanding of the code? Which information in the code do they use? Or which knowledge of a particular language or concept? Often there is a lot of tacit knowledge involved. It can be really helpful to notice yourself making implicit assumptions and to make those explicit, not just for yourself but also for others to learn from. This can also be a good time to explain where the code came from. It might help determine whether you think you’ve understood the code correctly. Although to me the point of the exercise is not to “get it right”, this can be hard for some people, so it can be helpful for the host of the session to provide some context.
Reflect
Finally, we reflect on the session and what we feel went well or could be improved for next time. One thing we noticed in the first few sessions was that we had to make sure we all had the code ready to annotate it (either printed or in some tool). Some positive notes were on the structure of the sessions in getting to the meaning of the code, someone who had the opportunity to explain a programming concept or language feature to others, learning with and from each other. Someone commented that having context would help understand the code; they found not knowing frustrating. Someone else said “next time, can we read good code?” which was followed up by someone else who said that since reading an unfamiliar language is hard enough, we should have well structured examples. And while I understand those comments, the hard truth is that unfortunately we have to be able to read code that might be poorly written / structured, so in my opinion it’s good to practice that.
Conclusion
Overall, I really love our Code Reading Club. It is interesting to me to practice reading unfamiliar code and to deliberately practice that skill. But what’s even more interesting is to learn from everybody’s different perspectives, the different interpretations and conclusions based on different backgrounds and knowledge. What is clear or obvious to one person might not be to someone else. Hopefully that insight will translate into code we write in the future to make it clearer to others, as well as provide us with empathy and understanding for the writers of the code we read (in our club or at work). I’d highly recommend trying out a Code Reading session when you get a chance, or even to start your own Code Reading Club.
Cookie Consent
We use cookies to improve your experience on our site. By using our site, you consent to cookies.
Cookie Preferences
Manage your cookie preferences below:
Essential cookies enable basic functions and are necessary for the proper function of the website.
Name
Description
Duration
Cookie Preferences
This cookie is used to store the user's cookie consent preferences.
30 days
Statistics cookies collect information anonymously. This information helps us understand how visitors use our website.
Google Analytics is a powerful tool that tracks and analyzes website traffic for informed marketing decisions.
Used to determine whether a user is included in an A / B or Multivariate test.
18 months
_ga
ID used to identify users
2 years
_gali
Used by Google Analytics to determine which links on a page are being clicked
30 seconds
_ga_
ID used to identify users
2 years
_gid
ID used to identify users for 24 hours after last activity
24 hours
_gat
Used to monitor number of Google Analytics server requests when using Google Tag Manager
1 minute
_gac_
Contains information related to marketing campaigns of the user. These are shared with Google AdWords / Google Ads when the Google Ads and Google Analytics accounts are linked together.
90 days
__utma
ID used to identify users and sessions
2 years after last activity
__utmt
Used to monitor number of Google Analytics server requests
10 minutes
__utmb
Used to distinguish new sessions and visits. This cookie is set when the GA.js javascript library is loaded and there is no existing __utmb cookie. The cookie is updated every time data is sent to the Google Analytics server.
30 minutes after last activity
__utmc
Used only with old Urchin versions of Google Analytics and not with GA.js. Was used to distinguish between new sessions and visits at the end of a session.
End of session (browser)
__utmz
Contains information about the traffic source or campaign that directed user to the website. The cookie is set when the GA.js javascript is loaded and updated when data is sent to the Google Anaytics server
6 months after last activity
__utmv
Contains custom information set by the web developer via the _setCustomVar method in Google Analytics. This cookie is updated every time new data is sent to the Google Analytics server.