Last year, I vibecoded a plugin as a joke for a talk at Devoxx Poland. We have also used the same progress bar at other conferences in Poland since…
As we were speaking in Poland again at GeeCON, I wanted to reinstall the plugin.
Unfortunately it turns out that the original project no longer builds. This might be because the version of Gradle it uses is too old (7.x instead of the current v9), because of changes in the IntelliJ platform, or both.
From inside the IDE – This option is available if you have the Plugin Devkit installed in your IDE and will have the same result as creating a project from the website, as they share the same generator.
New project: polishprogressbar
Since I figured it might be easier to start from scratch, I had created a new project using the Plugin generator website. To update the project, we copied the `src` folder from the old project to the new project.
Building and running
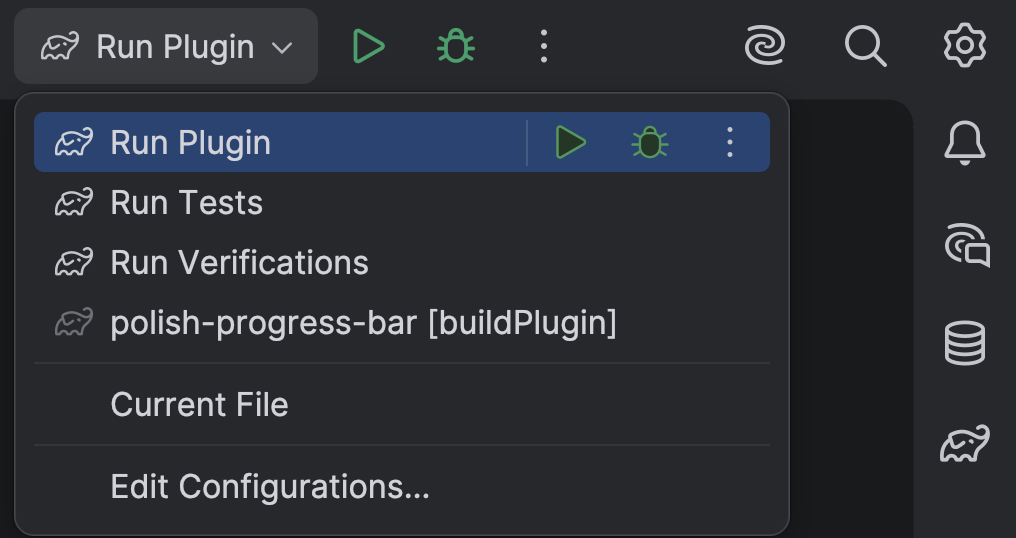
The template project comes with several run configurations that you can use to build and verify your project:
Run Plugin will run the plugin, opening a sandbox IDE where you can try your plugin.
Run Verifications which will run verifications on the previous, current and upcoming versions of our IDEs (currently: 2025.3, 2026.1 and 2026.2)
Run tests will run any tests. (I am ashamed to say this project has none. In my defense, this is a simple plugin and the correct behaviour can be easily verified by running it in the sandbox IDE).
Run Configurations for plugins
Code cleanup
Jakub also helped me with cleaning up some code. In addition, I did some cleanup myself, partially based on results from the verifications. Restarting the project was a good opportunity to make it a little nicer, and actually care about the code quality a little.
Installing the plugin
After building the plugin, I installed it on my IDE.
Polish progress bar in action
The plugin is not published to the JetBrains MarketPlace, as I am not sure another progress bar is really needed. You can find the code here. If you want to build and install it yourself, you can find the instructions in the README.
Thanks to Jakub Chrzanowski for his help with the plugin and this blogpost. ❤️
How many shortcuts can you remember? Three? Five? More? I try to learn as many as I can and still forget some of them…
What if you could unlock IntelliJ IDEA features, without having to remember shortcuts? You can still use shortcuts if you want. But you don’t haveto.
Command completion (..) is a new feature in IntelliJ IDEA that lets you discover and execute IDE actions right from your editor.
Command completion extends regular completion
Command completion is an extension of regular code completion – something every developer already uses. For example, when you have a variable, you can type a dot to show you completion options. It will show you API completion (all of the methods you can call on this variable), and postfix completion (templates you can apply to this variable). The list now also includes commands; all relevant commands for your current context. Code completion (a single dot) is now a universal entry point for all relevant actions.
To filter the list to show commands only, type two dots ... As the list can be quite long, the list is searchable, so you can type part of the command you want to use.
Command completion extends regular completion
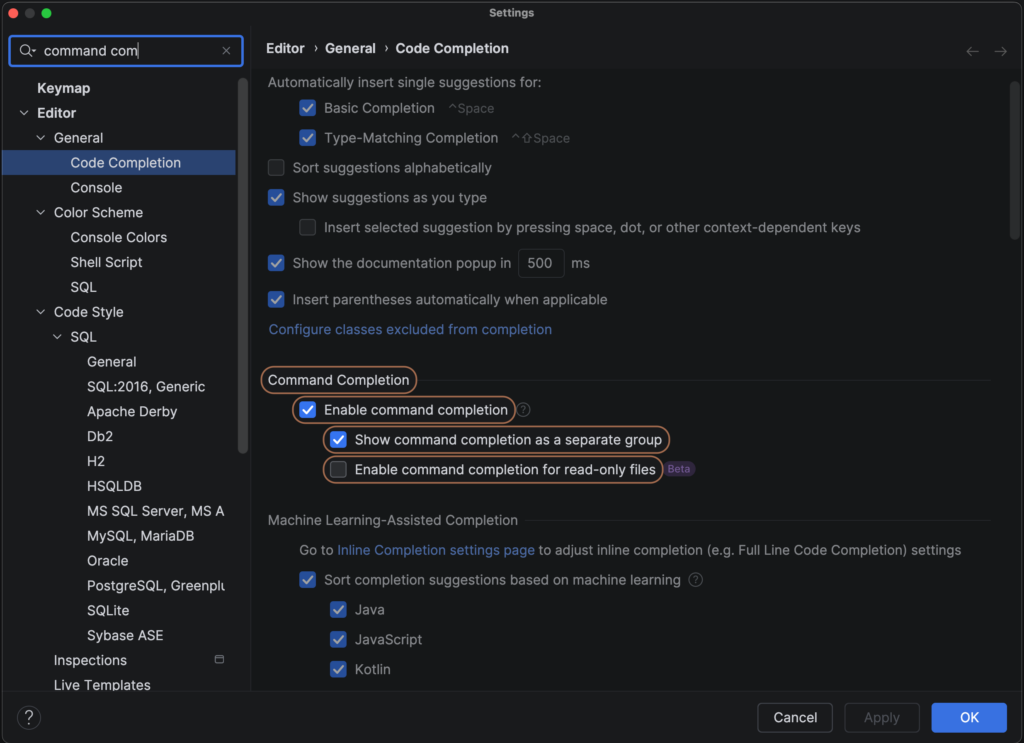
By default, the commands are shown in a separate section of the list. If you prefer Commands to be part of the regular completion list, you can adjust this in the Settings. Use Search Everywhere (Shift Shift) and look for “command completion” to go straight to the relevant settings and uncheck the option Show command completion as a separate group.
Command Completion Settings: Show command completion as a separate group
Fix errors and warnings with command completion
You can use this new feature to fix errors and warnings in your code. If you write code that doesn’t compile, IntelliJ IDEA will tell you. You can navigate to the error using F2 and press Alt+Enter to show context actions. However, Alt+Enter gives you only a few options; it is designed to give you the most relevant fixes to your problem. That means it might not always include the action you want to perform. On the other hand, command completion (..) offers you all actions that are relevant in your current context. IntelliJ IDEA will give you a preview of what each command will do.
Fix errors and warnings
Perform file- or class-level actions
It is now possible to unlock this type of completion in places where it wasn’t available before, like on a blank line. Typing a dot on a blank line now shows you file-level actions, like Reformat Code or Optimize Imports. For example, use Optimize Imports to remove an import statement that is no longer needed.
Perform file or class level actions
Refactoring and code transformation
Command completion can also help you when refactoring or transforming your code. When writing code, you can use it to keep moving forward. For example, to create classes, methods and fields.
Keep moving forward and create classes, methods and fields
You can use it to generate code for you, such as a toString() method.
You can transform your code as you go, for example to make use of modern Java language features. For example, you can refactor a class into a record, using only command completion.
Transform code
Use command completion for navigation
You can use it for navigation. For example, we can navigate to the String class declaration. You’ll notice that this file is read only! How will we use completion here? Don’t worry, you can change your settings to be able to use command completion in read-only files!
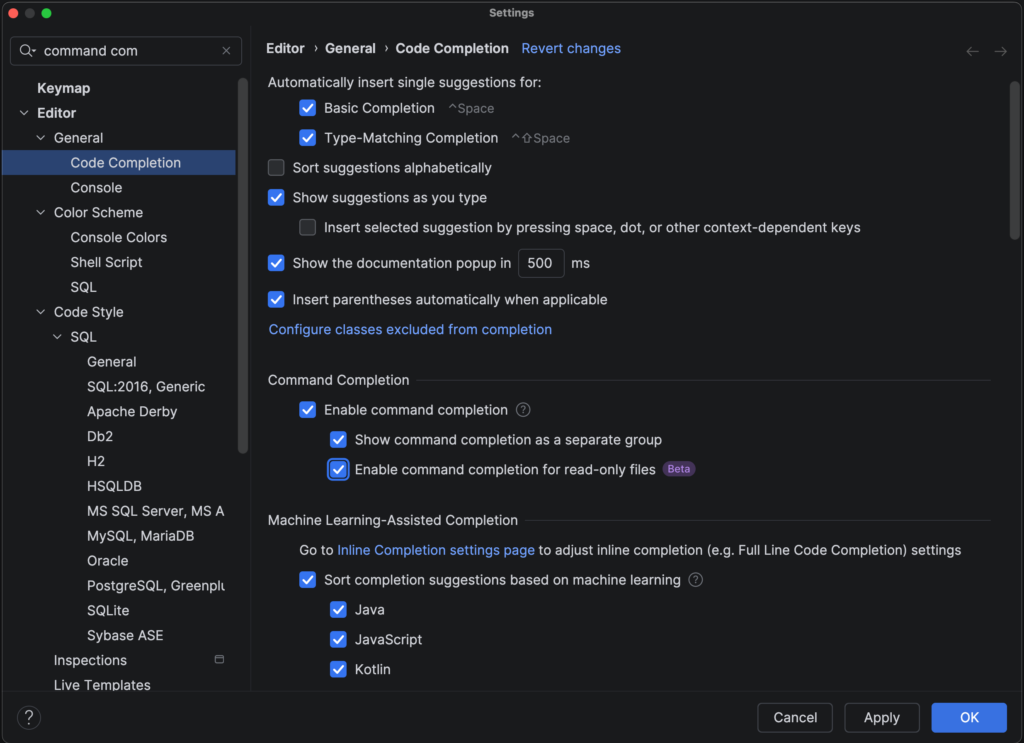
Open the Settings for Command Completion, by using Search Everywhere (Shift Shift) and searching for “command completion”. Select the option Enable command completion for read only files. Now, you can use command completion in read-only files, for example to navigate back to where you were.
Command Completion Settings: Enable command completion for read only files.
If you want to rename your class, you can use a shortcut to do so, but you need to know this shortcut (⇧F6 on macOS / Shift+F6 on Windows/Linux). Now, you can use command completion instead. Go to the end of the class or method name you want to rename and type ..rename.
Aliases for several commands
In some cases, you don’t even need to know the exact name of the command you’re looking for, as some commands have aliases. For example, you can also use ..change name instead of ..rename.
Aliases
This makes features even more discoverable; you don’t need to remember the exact name of the feature.
Imagine we declare a new instance of a class Person. To assign this new Person() to a variable, you can use the shortcut to Extract Variable (⌥⌘V on macOS / Ctrl+Alt+V on Windows/Linux). But this requires you to know this feature exists and the relevant shortcut.
Alternatively you could use postfix completion .var to create a variable. But that would again require you to know (or quickly be able to find) this specific postfix completion.
Instead, you can now use command completion to introduce a local variable. After the declaration of the new instance, use ..Introduce local variable.
Command completion complements existing features
If you want, you can still use postfix completion. For example, you type person.sout to print variable person to System.out: System.out.println(person);.
You can transform this code to modern Java and use features introduced in Java 25, like simple IO. After the line System.out.println(person); type .. and select ..Replace with IO.println().
You can use refactoring, like Extract Method (⌥⌘M on macOS / Ctrl+Alt+M on Windows/Linux), even if you don’t remember the shortcut. To do so, type .. and select ..Extract method after the method you want to extract.
Refactor: Extract method
What if you want to add JavaDoc to your code? You could use Alt+Enter to Add JavaDoc. But now you can also use command completion to generate JavaDoc, and convert it to Markdown.
Command completion is as easy as adding a dot, or two..
As you can see, using command completion is as easy as adding a dot, or two..
Conclusion
Command completion extends regular completion – which you already use. It lets you discover and use IntelliJ IDEA features without having to remember shortcuts. This keeps you in the flow of coding; you can think about what you want to do, instead of how to do it.
Type a . to find commands as part of regular completion, or .. to see all available commands relevant to your current context. You might discover powerful features you never knew were there!
In June, I presented the talk Learning modern Java the playful way with Piotr Przybył at Devoxx Poland 2025. For this presentation, I thought it would be funny to have a custom progress bar running in IntelliJ IDEA during our demos. Since we adapted our presentation to the Polish audience a little, I figured a Polish flag and #PolishSmile would be appropriate.
Creating an IntelliJ IDEA plugin
As I had never implemented an IntelliJ IDEA plugin before, I had no idea how hard it would be. When I asked my colleague, Anton Arhipov, he suggested using Junie to vibe code it. And given that this was just a fun idea for a plugin intended to be used only once, it was the perfect candidate for vibe coding: We don’t care that much about the code quality, since we won’t be maintaining it. All we need is for the plugin to work.
We started a new project using the Plugin template on GitHub. While Junie may or may not be able to do the configuration for such a project, there is a deterministic template available; why not use that?
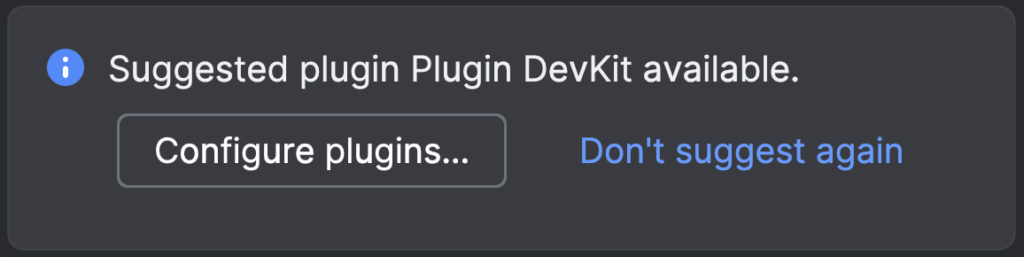
When you open the project, IntelliJ IDEA will show a popup Suggested plugin Plugin DevKit available. Clicking the button Configure plugins will open Settings | Plugins with this plugin selected and the option to Install it.
Using Junie for vibe coding
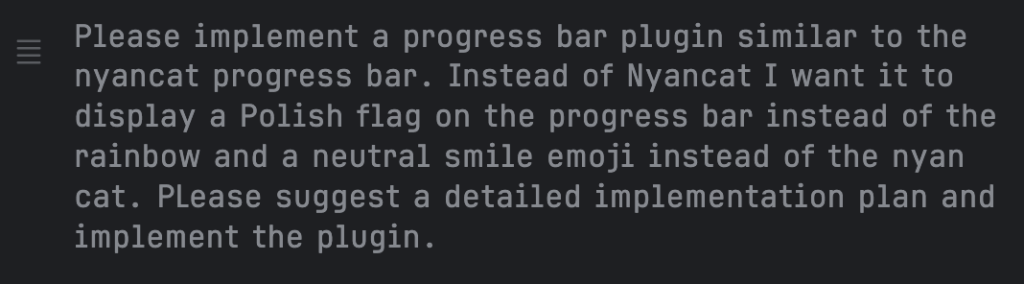
Then we started with a prompt asking Junie to implement the plugin similar to the Nyan Progress Bar plugin. The prompt we used was as follows:
“Please implement a progress bar plugin similar to the nyancat progress bar. Instead of Nyancat I want it to display a Polish flag on the progress bar instead of the rainbow and a neutral smile emoji instead of the nyan cat. PLease suggest a detailed implementation plan and implement the plugin.”
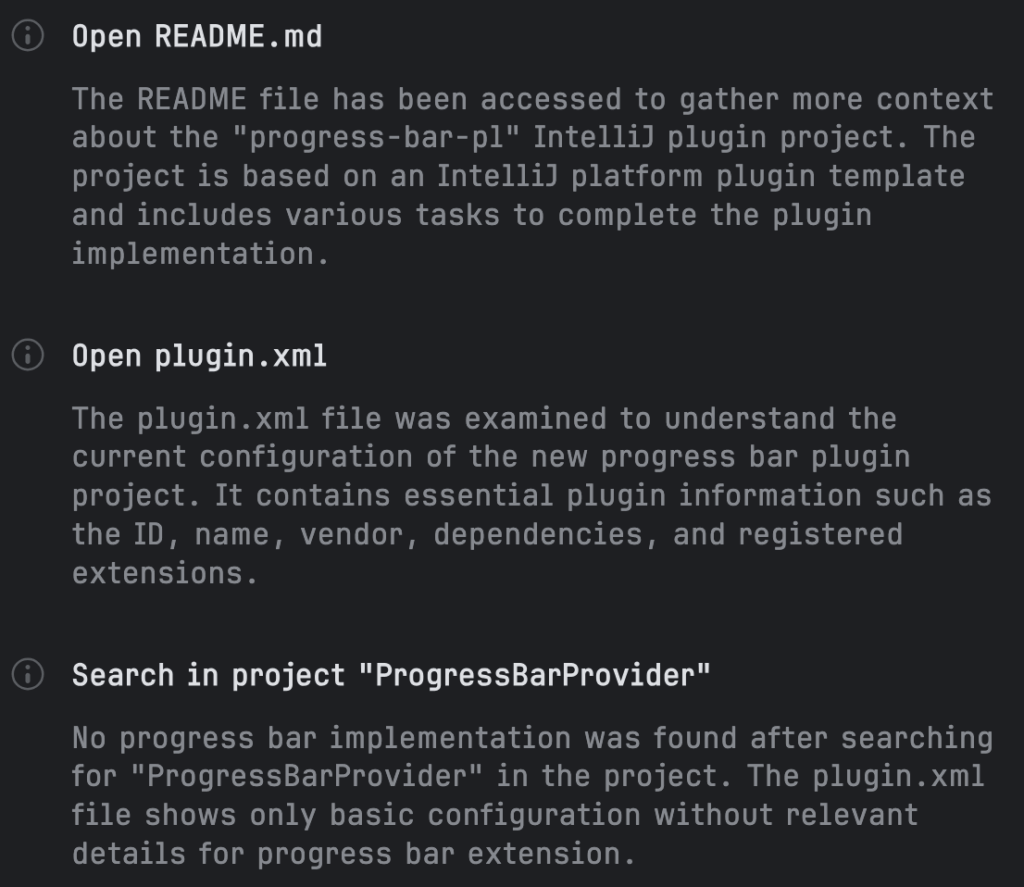
Junie correctly identified that no implementation was available and set about creating one. Before doing so, it first scanned the project and looked at the README and plugin.xml, correctly identifying that “the project is based on an IntelliJ platform plugin template”.
The plugin template project includes multiple Gradle goals, including runIDE; which allows you to run your plugin on an instance of the IDE so that you can try it out. This is perfect for our vibecoded project, since all we care about is whether the plugin does what we want.
When Junie is done, it will say so in the Junie tool window and give an overview of files that were changed. The links to the files are clickable, if you want to look at the diff for these files.
First results
The first implementation of the progress was a step in the right direction but not quite what we wanted. Instead of a continuous Polish flag, it showed only small sections of white and red. Also, while the code referenced an icon, no icon was available, so we had to download a Polish smile emoji ourselves and add it to the project in the right location. We also had to manually resize this image to fit the progress bar, which unfortunately made it slightly pixelated…
One of the things I like about Junie is that it can to build your project, and will try to fix any issues if the project doesn’t build successfully. It might not try to do so every time (AI is non-deterministic after all), so if it doesn’t you might want to add something to your `.junie/guidelines.md` along the lines of “DO make sure the project builds successfully.
Also, Junie might stop if it cannot resolve issues in several tries. This is usually a hint to either break up the task into smaller pieces and/or provide more detailed information.
In our example, we tried prompting Junie to make the Polish flag on the progress bar continuous, but with no luck. We used the following follow up prompt:
“i want the brogress bar to be continuous and smooth and it should move 5 times slower”.
(Note that even though the prompt has typos, Junie doesn’t seem to mind.)
Providing a code example for better results
Unfortunately, this prompt did not have the desired outcome. Instead, Anton had the idea to take part of the Nyan Progress Bar plugin implementation and provide that code to Junie as an example to work with. We did so and used the following prompt:
“analyze the code in NyanCatProgressBar.txt (it is in Java) and create PolishFlagBProgressBar in Kotlin by following the same logic but with the polish flag colors”
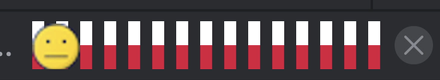
This turned out to be a great idea; the plugin showed a continuous Polish flag now. This goes to show that providing Junie with examples of what you want will lead to better results.
Unfortunately, the smiley still jumped up and down on the progress bar, which is not what I wanted. But I figured it was good enough for a plugin I would only use for fun anyway. It wasn’t until after the conference that I realised that the smiley jumped up and down because that is what the Nyan Cat does in the Nyan Progress Bar. It took me five minutes to prompt Junie to fix this.
The next challenge was to build the plugin in a way that I could install it in IntelliJ IDEA from disk (as I had no plans to publish the plugin). A plugin project can be built using the task buildPlugin. Unfortunately this didn’t work for our project. It took several tries to get Junie to fix it, but I have to say that I was impressed that Junie fixed my Gradle problem.
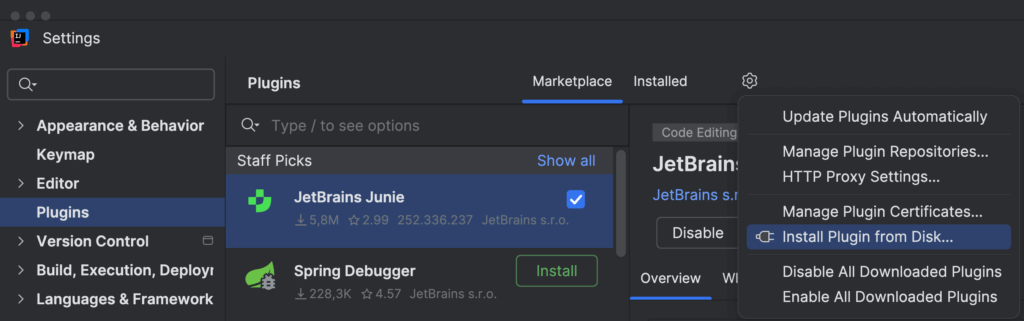
Installing the plugin
Once the project was built successfully, I could install it. To install a plugin from disk, open Settings (⌘, on macOS) / Ctrl+Alt+S on Windows/Linux) and go to Plugins. On the Plugins page, next to Marketplace and Installed, click the icon to Manage Repositories, Configure Proxy or Install Plugin from Disk. From the menu, select Install Plugin from Disk, and select the .jar file for the built plugin from your file system.
Uninstalling the plugin
When it came time to uninstall the plugin, I found that I had trouble doing so. Fortunately my colleagues were able to provide a workaround. To manually uninstall the plugin, delete the plugin from the plugins main directory, which you can find in Help | Diagnostic Tools | Special Files And Folders.
Results
Remember, this plugin is not meant to be published to the marketplace. However, if you’re interested in the code, you can find it here.
Overall, it was fun vibe code something silly with Junie and I am happy with the result. Also, it turns out, I could actually reuse the plugin when speaking in Poland again.
As developers, we read code more than we write it. When adding new features or fixing bugs, we first need to understand existing code, so we can make the right changes in the right place.
When reading code inside the IDE, IntelliJ IDEA helps us to read and understand code by providing helpful features like syntax highlighting and inlay hints. But there are more features to help us understand a piece of code.
Formatting
We don’t read code like we do text, from start to finish. Code doesn’t run linearly! We scan code to get a feel for the shape, and to find the part we’re interested in.
IntelliJ IDEA will take care of formatting the code while we’re writing code. If we encounter code that is not properly formatted, we can have IntelliJ IDEA reformat the code for us. In the file you want to reformat, use the shortcut ⌘⌥L on macOS or Ctrl+Alt+L on Windows/Linux.
Reformat code
We can restructure the code by moving code blocks around to match our mental model, preferred style or coding conventions.
Move Statement Up and Down
Structure
There are several ways to get a quick overview of a piece of code. For example, we can collapse the code, so we only see the names of methods and not their implementation. This can help us find the specific code we are looking for more quickly. We can then expand that particular section.
Collapse and Expand code
Note that we can still search the code when it is collapsed, and if needed the relevant section will expand.
Search collapsed code
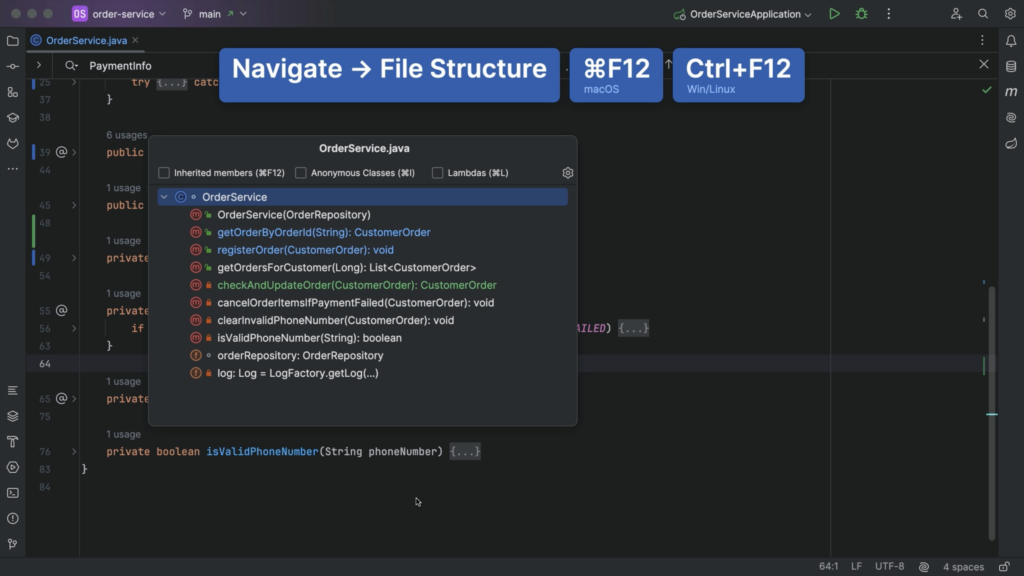
Alternatively, we can look at the File Structure for a file using ⌘ F12 on macOS or Ctrl+F12 on Windows/Linux. We can navigate to the section of the code we’re interested in from here.
File Structure
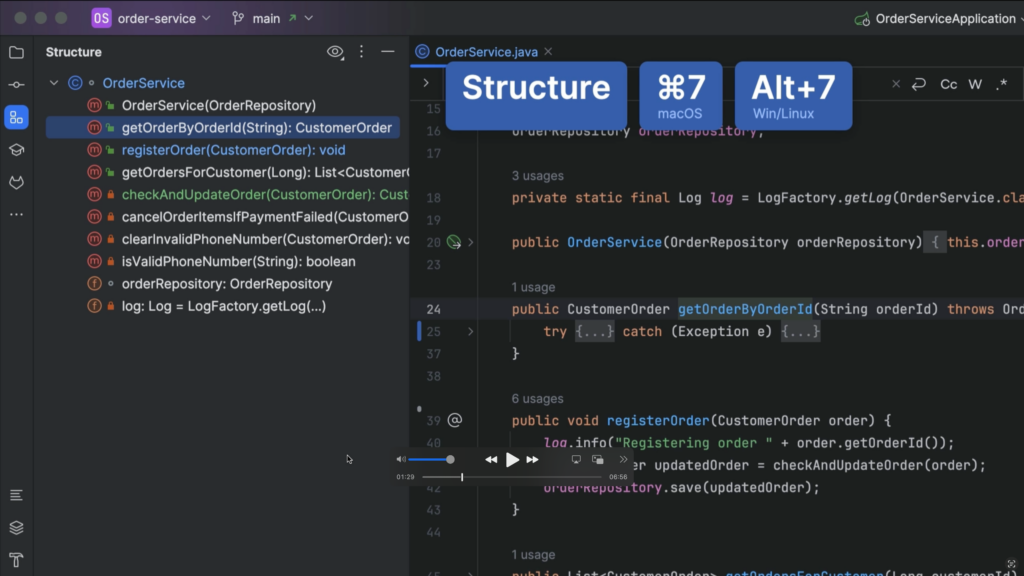
We can get the same information by opening the Structure tool window, using ⌘ 7 on macOS or Alt+7 on Windows/Linux.
Structure tool window
Searching
We can search the code for specific names of variables, methods, or Strings, for example a log message. IntelliJ IDEA will highlight the results of your search in the file.
We can also search for other occurrences from the editor. For example, we can select this variable name, and press ⌘F on macOS or Ctrl+F on Windows/Linux to search for the selected string. IntelliJ IDEA will place the selected string into the search field and highlight all occurrences in the file.
Find String in File
Additional hints: Quick Documentation & Type Information
We can also ask for additional hints from our IDE. For example, we might want more information about a particular class or method that is used in the code we are looking at, but defined elsewhere in the codebase. We can navigate to other locations in the code base, and back again, but we might end up getting lost in a large code base. Even though we can ask IntelliJ IDEA to locate a file in the project structure, jumping around too much can get overwhelming.
Select in: Project tool window
Instead, we can use Quick Documentation (F1 on macOS or Ctrl+Q on Windows/Linux) to pull up the information we need in our current location.
Quick Documentation
We can also pull up Type Information using ⌃⇧P on macOS or Ctrl+Shift+P on Windows/Linux if we’re unsure of what type is returned by a particular method.
Type Information
Reader mode
Code might contain comments that explain the code. We can toggle to reader mode in the editor using ^⌥Q (on macOS) or Ctrl+Alt+Q (on Windows/Linux). Right-click the icon in the gutter to select Render All Doc Comments if you want all comments to show in reader mode.
Toggle rendered mode
Testing and debugging
To understand intended behavior of the code, we can look at the tests in the code base. To look at the code and its tests side by side, right-click the tab and select Split and Move Right.
Split and Move Right
We can run a test (or our application) through the debugger to actually see how the code is executed. First, we need to place a breakpoint at the location in the code we’re interested in. Click the gutter next to the line of code where you want to place the breakpoint, or use ⌘ F8 on macOS or Ctrl+F8 on Windows/Linux to toggle the breakpoint.
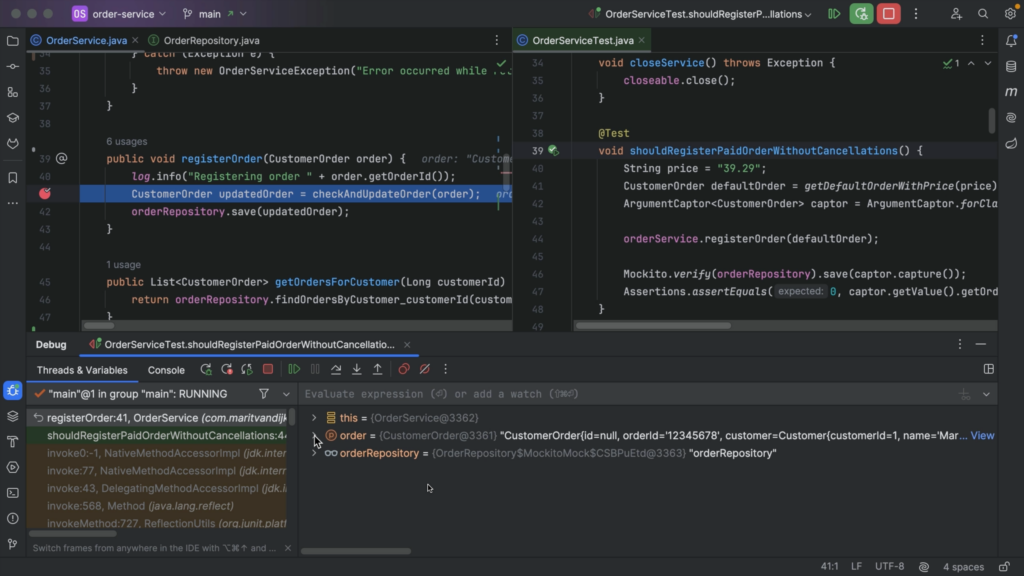
Next, we run our test (or application) using the Debug option. Execution will stop at the breakpoint, so we can investigate the state of our application. Once code execution stops at the breakpoint, we can see current values of variables and objects.
We can also evaluate an expression, to see its current value and look at more details. We can even change the expressions to evaluate different results.
Evaluate Expression
We can continue execution by either stepping into (F7) a line to see what happens inside a called method or stepping over (F8) a line to go to the next line even if a method is called, depending on what we’re interested in. Finally, we can resume the program, using the shortcut ⌥⌘R on macOS or F9 on Windows/Linux, to finish the execution of the test (or continue execution of the application).
Step into, step over, resume.
If there is no test that exercises the piece of code you are interested in, you might want to add one. This can also help you verify any assumptions you might have about the code.
Refactoring for understanding
While trying to understand the code, you may want to perform small refactorings, like renaming a variable or method (using the shortcut ⇧F6 on macOS or Shift+F6 on Windows/Linux), extracting a method and giving it a meaningful name (using the shortcut ⌥⌘M on macOS or Ctrl+Alt+M on Windows/Linux), or refactor the code to a style you are more familiar with to make it easier for you to read and understand the code.
Refactor code style
Playing with the code can help you verify your assumptions and improve your understanding. Remember though, that these changes are not meant to be committed! Revert them when you’re done.
Revert changes
Version control (Git) history
We might be interested in when the code was last changed and why. We can find out by looking at the history in our version control system. If we are using Git, we can click the gutter to enable Annotate with Git Blame. Or, if you don’t like using the mouse, you can open the VCS Popup using ⌃V on macOS or Alt+` on Windows/Linux and enable or disable this option from there.
VCS Popup
In the gutter, we can now see when a line was last changed and by whom. We can hover over this information to see the commit this change was a part of and its corresponding commit message. Or we can click a line in the gutter to open the Git tool window, with the selected commit highlighted. Here, we can see the commit, its commit message and which files were changed. We can open the diff of the files to see exactly what was changed.
JetBrains AI Assistant
If you are using JetBrains AI Assistant, you can ask AI Assistant to explain the commit to you.
Explain Commit
JetBrains AI Assistant is an additional service available in IntelliJ IDEA from version 2023.3. It has several features that can help us understand our code. For example, we can ask AI Assistant to explain code, write documentation, or generate unit tests.
AI Actions
If we use the AI action Explain code without selecting any code, the entire file is selected and AI Assistant opens a chat window where it will explain the code in this file. Alternatively, we can select a specific piece of code, like a method, and perform the same action to get an explanation of that section of code.
Explain Code
We can write documentation for a class or method. Note that our cursor needs to be in the class or method for this to work. We can’t write documentation for a blank line.
Write Documentation
And of course, we can ask AI Assistant questions in the chat. For example, to explain the project.
Explain Project
Keep in mind that even if you use AI Assistant to write code for you, you’ll still need to be able to read code! You’ll need to evaluate the code provided, and understand whether that is the code you want.
Conclusion
In this tutorial we’ve looked at the many ways IntelliJ IDEA can help you read and understand code. Hopefully these tips for reading code will have you reading code like a pro.
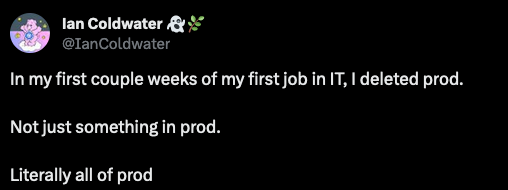
It’s a Friday, late in the afternoon. To end your work week in a clean way, you decide to get rid of some test data and files from your PC. You hit the enter button to drop a table from your local test database. Within a split second, you realize your error. Your body turns hot and cold at the same time. You double-check, but you already know the truth. You were connected to the production database and just deleted the table with all the customers…
Congratulations! You will never forget this day. It’s the day you become a real developer, and all senior developers will welcome you into their world, as they all have made a similar mistake at least once.
Database Disasters
Dropping a table or a complete database is a mistake that can happen very quickly. Another one is forgetting the WHERE part of your SQL statement. There is a big difference between DELETE FROM clients and DELETE FROM clients WHERE id = 1…
But the main mistake happens when you have multiple connections defined in your database UI and assume you are modifying the test database while having the production database open. And that’s a problem that actually should not be possible to happen, or at least not easily. Do developers need access to the production database? While it can be helpful to be able to check data directly in the live system, read-only rights are probably sufficient for most cases…
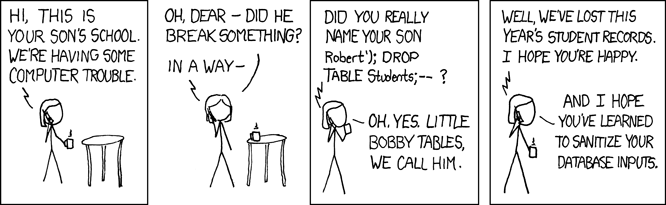
Another database disaster waiting to happen is when you forget to validate the input. SQL injection should be a well-known problem by now, but still, a lot of errors happen in this field, causing not only disasters but also security nightmares. Or, as XKCD nicely illustrates it:
Dates and Times
Working with dates and times is the real test that distinguishes beginners from experienced developers. The defining factor is not only their ability to handle them correctly but also the number of “yes, I have seen this problem before” moments.
Before we dive into the problems, let’s summarize the most important guideline when working with dates and times in your database: store them completely, including the timezone. This is an article that goes into more details about timestamptz in PostgreSQL.
Here are some interesting situations related to dates, times, and time zones.
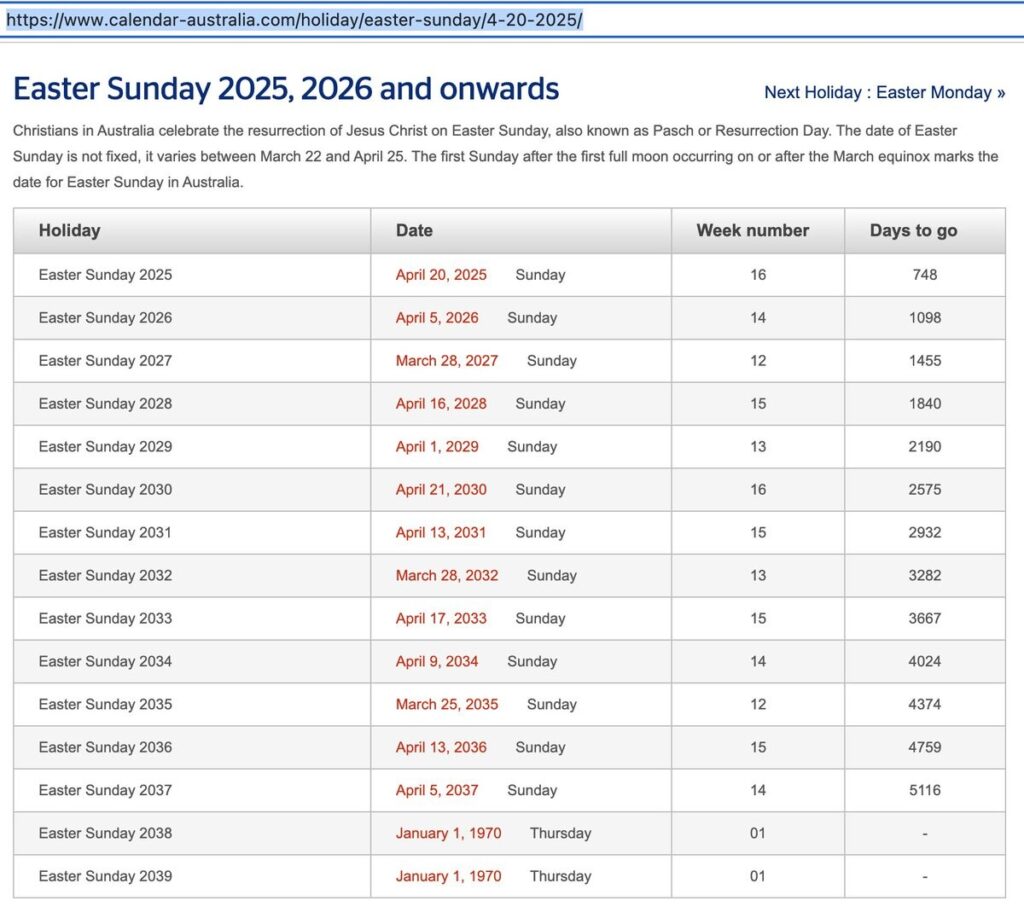
Young developers will probably not remember what the Y2K problem was all about, but let’s just mention here that storing a year’s value as only two numbers is a bad idea. No, the year 2000 (“00”) was not before the year 1999 (“99”). And we may be facing a similar problem in the year 2038, as I wrote in an earlier blog: “Schedule your holiday for 2038“. While writing that article, I never imagined seeing an error being caused by that Y2K38 problem already in 2023!
Frank
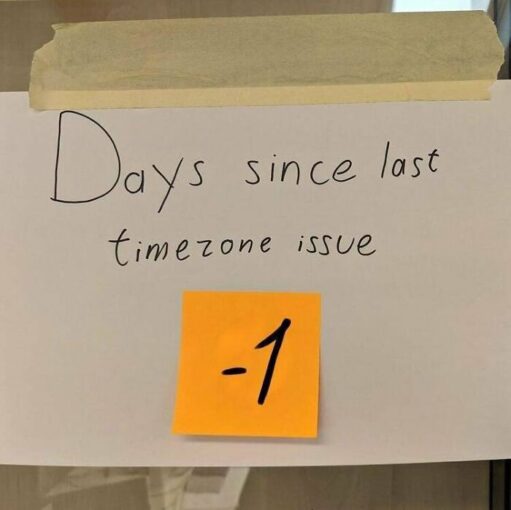
Of course, if your company only operates in one time zone, you might think that you will escape the problem of having to deal with time zones. And this might be true… Until you move to the cloud. Now you’ll have to deal with time zones too! And there are many reasons why dates and time zones are fertile ground for great conference talks and famous blog posts.
Marit
Computer System Breakdowns
But be aware, we can not only make mistakes in our code and database! Our whole computer infrastructure is prone to errors!
Many years ago, I was working on my first big multimedia project for a light fixtures manufacturer to bring their expensive thick catalogs to CD-ROM (for young people, a blinking disk that could contain a whopping 640 MB of data…). We had a strict deadline and had a first working version after three weeks of hard work. But then disaster struck! The hard disk of my fancy blue iMac broke.
After many hours of investigation, I ended up with four conclusions:
The backup tapes on our server that ran daily to ensure we would never lose any work contained not a single file!
It would take weeks and a lot of money to send the hard disk to a data recovery company without any guarantee to be able to recover anything.
Backups must be checked regularly and you must try from time to time if you can recover a deleted file to make sure both the backup and restore process work OK.
I had to start my work again from scratch…
Another lesson I learned from that disaster: weeks of work on a project that you have never done before can be repeated in a few days as you learned a lot during those weeks, and now know how to do things. And in the end, it even gets a cleaner and better result!
Another system disaster: never, never, NEVER, type the command rm -rf /. The remove command parameter f removes all prompts, so you let it go ahead without asking for any confirmations. The r lets the remove command work recursively, meaning it will go through all nested directories. Combine this with /, being the very root of your hard disk, and you are heading towards a total nightmare…
Frank
Testing Mistakes
In the same category of testing versus production databases: mailing lists! The number of stories of test emails reaching thousands of clients is incredibly long.It’s still amazing how many times one still receives an email with all recipients in the TO field. Any programmed emailing system should generate a single mail per person. And if you really, really need to send to multiple persons with one message, the BCC field is your only friend!Another well-known example is sending test messages in production, like the time Airbnb sent test notifications to users around the world or an intern at HBO Max sent an integration test email to subscribers.
I can remember a story, in the early days of the internet, when networks were not that fast, and servers were smaller. Most companies had their own internal email server. But when someone mailed a big PDF report or other file to everyone at the company, the complete system could crash. Suddenly too much storage was needed, and a ping-pong of email error replies, led to a total breakdown of the server.
Frank
Similarly, I remember several situations where we’ve had to (re)upload batches of data and somehow miscalculated the size and processing time, leading to queues being full and data processing to be severely delayed.
Marit
Conclusions
While some of the mistakes mentioned here are honest mistakes made by developers, some of the bad events described here actually reveal a problem within the organization. Do developers need unrestricted access to the production database? Why are they able to access the entire production mailing list for a test? Some data (especially personal data) should be behind heavily closed doors with minimal access. But in many companies, all this data is widely accessible to the whole developer team (or worse). If this is not guarded by the organization, developers should always be professional and handle data with care.
In addition, tooling should be used in such a way as to make mistakes like these harder. For example, environments should be clearly marked so it’s easy to see whether you are working on a test environment or the production environment. In some cases, additional steps have to be taken in order to get access to a production environment. Evaluate potential risks in your organization and act accordingly.
But as much as you try to avoid them, mistakes do happen. In the end, it’s essential to keep in mind that people will mostly remember how you reacted to a disaster. After the initial adrenaline spike has settled down, grab a cup of coffee, cancel your plans for the following days, and fix the problem. Everything will be OK soon. Afterward, you will wear the badge of “Senior Developer” with pride…
IntelliJ IDEA is designed to help developers like us stay in the flow while we’re working. Like all IDEs, it has a lot of functionality available, but it’s designed to get out of your way to let you focus on the code.
Take a look at this overview of IntelliJ IDEA.
Introduction
Find Action: ⌘ ⇧ A (on macOS) / Ctrl+Shift+A (on Windows/Linux)
Several months ago I heard or read about Code Reading Club for the first time. It might have been a tweet by Felienne Hermans, or it might have been in her excellent book The Programmer’s Brain, but I was intrigued. As a developer, I’ve often wondered what would be the best way to familiarise myself with a new codebase, or the best way to really understand what a specific piece of code does. Of course, I’ve learned several techniques over time, but the idea to deliberately practice reading code? Brilliant! So imagine my surprise when my friend Lisi Hocke reached out to ask me if I would be interested in joining her Code Reading Club. Well, yes!!
Online tooling
The club consists of several members in different countries and even different time zones and takes place online. We decided on a day and time that works for us, and use collaborative tools like Miro or Jamboard for our sessions. This means everyone needs to make sure to have the code sample printed, or have a digital copy they can annotate with a digital tool. (And no, this is not supposed to be an IDE or editor with syntax highlighting, as part of the exercises is to look at the structure of the code.)
Exercises
All of our sessions so far have used the same exercises, using a different code sample (in a different language) each time. The exercises are taken from the starter kit.
The first session was very well prepared with a Miro board that contained everything we needed for the online session. The board contained the exercises, the code example and (where needed) space for us to place virtual post-its with our comments.
Introduction
We started our first session with a round of introductions, since not everyone in the group knew each other. We try to repeat that when new people join, as unfortunately not everyone is able to join every session.
Setting the scene
We start each session writing down what we are looking forward to or are excited about, as well as what we are worried or confused about. In the first session these comments were more about our expectations for the Code Reading Club in general.
For example, people mentioned they were excited about the following:
Getting used to thinking through problems with unfamiliar tools & languages
Understanding how others think about programming
Taking advantage of our different experiences to learn more about code
Looking forward to learning – both about code and about new people
Some people also mentioned specific goals like getting better at code reviews, or improving their coding skills (from reading to writing).
In the next sessions the comments were sometimes more about how we were feeling (from being tired at the end of a long week, to being happy to see each other again) and about our progress in the club (for example, learning from each other, or fearful we’re not picking it up as quickly as we would like). What I love is that people feel safe in the group to share how they feel. And everyone is excited to learn with and from each other, and is supportive of each other.
First glance
The first exercise in code reading is called “First glance”. It literally asks to take a quick (1 minute) look at the code and note the first thing(s) you notice about it, and why. We’ve found that different people notice different things, for example things they are familiar with or confused about. Some people focus on which language it is, or which programming constructs they recognise, while others focus on naming, whether or not there are comments or even import statements.
What’s also interesting is to talk about why these are the first things you noticed. Do you read the code from top to bottom like you would a piece of text in natural language (like this blog post), or do you scan the code and look at the blocks of code first, before looking at details? Do you focus on known or unknown concepts? All of these are opportunities to learn from each other and look at code differently next time.
Code structure
The next exercise is to examine the structure of the code, or rather its components or elements. We mark the variables, functions/methods, and object instances. It can be very interesting to identify these in a “foreign” programming language! We also draw connections between these elements in the code; for example, linking where a variable is used throughout the code, or a method call to a method. This exercise is intended specifically to look at the structure of the code, and not its purpose. This turns out to be very hard, especially for people who really like to understand what’s going on! (Don’t worry, we’ll get there!)
Content
Next, we each identify the 5 most important lines of code. We notice that not everybody chooses the same lines, so we also discuss why people chose those lines in particular and learn from each other’s insights. For example, we don’t always have the same understanding of the meaning of “important”; does it mean important for the code to execute, or to understand what the code does? If the former, you might choose a main method as an important line of code. If the latter, you might choose a comment. Other people look at which lines are important for the control flow, or which lines are important to determine what to test (since some of the team members have a testing background).
Summary
The last exercise is to summarize the purpose of the code, or to describe what you think the code does to the best of your ability. It is interesting to see whether people have the same understanding of the code or not, but more interesting to see which information they use to get there. What strategies do they use to come to that particular understanding of the code? Which information in the code do they use? Or which knowledge of a particular language or concept? Often there is a lot of tacit knowledge involved. It can be really helpful to notice yourself making implicit assumptions and to make those explicit, not just for yourself but also for others to learn from. This can also be a good time to explain where the code came from. It might help determine whether you think you’ve understood the code correctly. Although to me the point of the exercise is not to “get it right”, this can be hard for some people, so it can be helpful for the host of the session to provide some context.
Reflect
Finally, we reflect on the session and what we feel went well or could be improved for next time. One thing we noticed in the first few sessions was that we had to make sure we all had the code ready to annotate it (either printed or in some tool). Some positive notes were on the structure of the sessions in getting to the meaning of the code, someone who had the opportunity to explain a programming concept or language feature to others, learning with and from each other. Someone commented that having context would help understand the code; they found not knowing frustrating. Someone else said “next time, can we read good code?” which was followed up by someone else who said that since reading an unfamiliar language is hard enough, we should have well structured examples. And while I understand those comments, the hard truth is that unfortunately we have to be able to read code that might be poorly written / structured, so in my opinion it’s good to practice that.
Conclusion
Overall, I really love our Code Reading Club. It is interesting to me to practice reading unfamiliar code and to deliberately practice that skill. But what’s even more interesting is to learn from everybody’s different perspectives, the different interpretations and conclusions based on different backgrounds and knowledge. What is clear or obvious to one person might not be to someone else. Hopefully that insight will translate into code we write in the future to make it clearer to others, as well as provide us with empathy and understanding for the writers of the code we read (in our club or at work). I’d highly recommend trying out a Code Reading session when you get a chance, or even to start your own Code Reading Club.
Cookie Consent
We use cookies to improve your experience on our site. By using our site, you consent to cookies.
Cookie Preferences
Manage your cookie preferences below:
Essential cookies enable basic functions and are necessary for the proper function of the website.
Name
Description
Duration
Cookie Preferences
This cookie is used to store the user's cookie consent preferences.
30 days
Statistics cookies collect information anonymously. This information helps us understand how visitors use our website.
Google Analytics is a powerful tool that tracks and analyzes website traffic for informed marketing decisions.
Used to determine whether a user is included in an A / B or Multivariate test.
18 months
_ga
ID used to identify users
2 years
_gali
Used by Google Analytics to determine which links on a page are being clicked
30 seconds
_ga_
ID used to identify users
2 years
_gid
ID used to identify users for 24 hours after last activity
24 hours
_gat
Used to monitor number of Google Analytics server requests when using Google Tag Manager
1 minute
_gac_
Contains information related to marketing campaigns of the user. These are shared with Google AdWords / Google Ads when the Google Ads and Google Analytics accounts are linked together.
90 days
__utma
ID used to identify users and sessions
2 years after last activity
__utmt
Used to monitor number of Google Analytics server requests
10 minutes
__utmb
Used to distinguish new sessions and visits. This cookie is set when the GA.js javascript library is loaded and there is no existing __utmb cookie. The cookie is updated every time data is sent to the Google Analytics server.
30 minutes after last activity
__utmc
Used only with old Urchin versions of Google Analytics and not with GA.js. Was used to distinguish between new sessions and visits at the end of a session.
End of session (browser)
__utmz
Contains information about the traffic source or campaign that directed user to the website. The cookie is set when the GA.js javascript is loaded and updated when data is sent to the Google Anaytics server
6 months after last activity
__utmv
Contains custom information set by the web developer via the _setCustomVar method in Google Analytics. This cookie is updated every time new data is sent to the Google Analytics server.