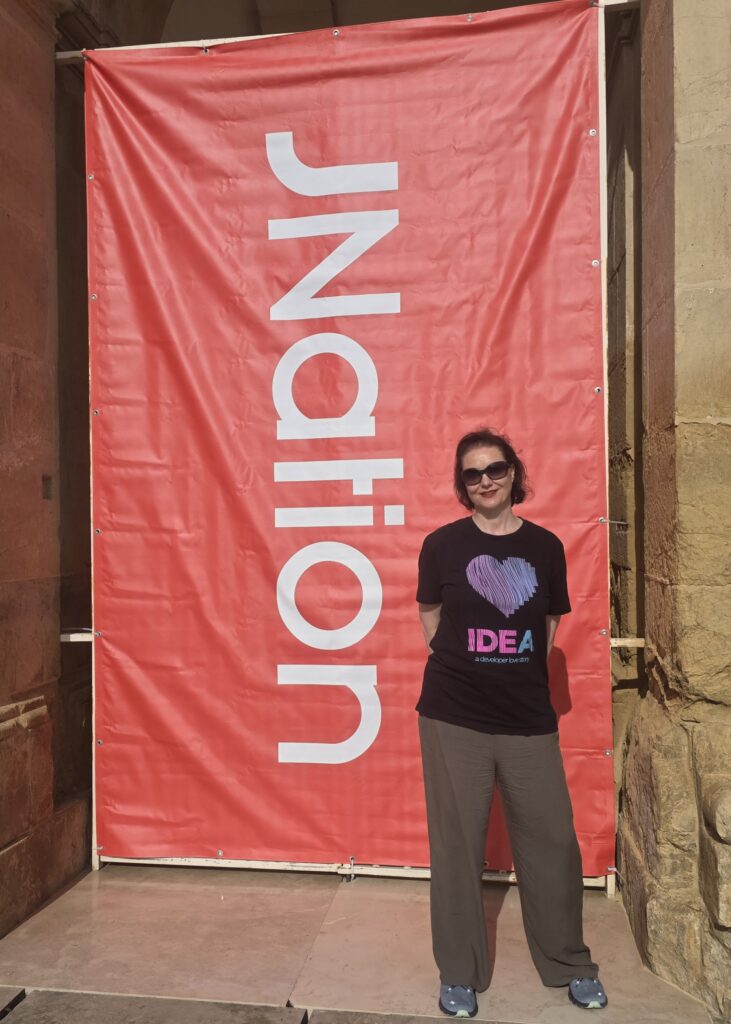
This year I had the opportunity to speak at JNation for the first time. It was a great conference; great speakers, nice people and a very responsive audience!
Getting there
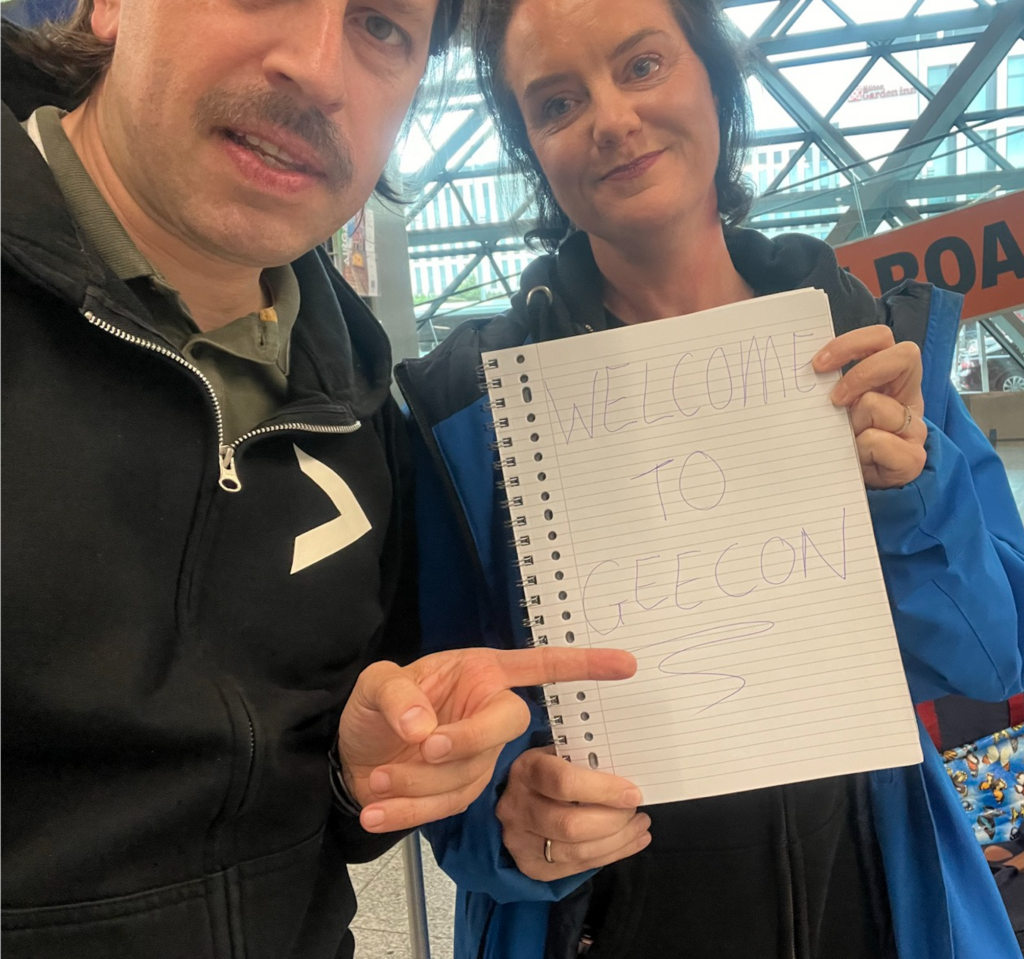
JNation is held in Coimbra, Portugal. It takes some time to get there, but it is well worth it. The conference arranges for shuttles from Porto and Lisbon to Coimbra; I opted for Porto as it was a shorter flight and drive. At the Porto airport, I ran into Simon Schrottner, who I had met at Devoxx Morocco last year. It turned out we were on the same shuttle bus. We also picked up Martijn Verburg and his cousin Bella from the train station on our way to Coimbra. We had some interesting conversations on the way, which we continued over lunch once we made it to the hotel. While we were there, several other speakers also arrived.
Speaker dinner
The conference organised a speaker dinner the evening before. Andres Almiray, Patrick Baumgartner, Simon and I decided to walk there. This was a bit of an adventure, as the hotel we were staying at was next to a highway which we had to cross…
The speaker dinner is a good opportunity to see the other speakers. Fortunately, my colleague Anton Arhipov was also speaking; it is always nice to see him. And I ran into Sam Aaron, who I hadn’t seen in a while. To top it off, I had the opportunity to hang out with my friend Ewa.
Josh Long told me that he had some feedback on IntelliJ IDEA, and from my side I wanted to show him some new features we had been working on. After we got back from the dinner, we spent some time in the hotel lobby hunched over a laptop.
Conference day
The conference started with some live coded music by Sam Aaron, the creator of Sonic Pi.
The conference was officially opened by Roberto Cortez and team, followed by a keynote by Martijn. After that I had a little time to prepare for my talk, like finding the room where I would be speaking…
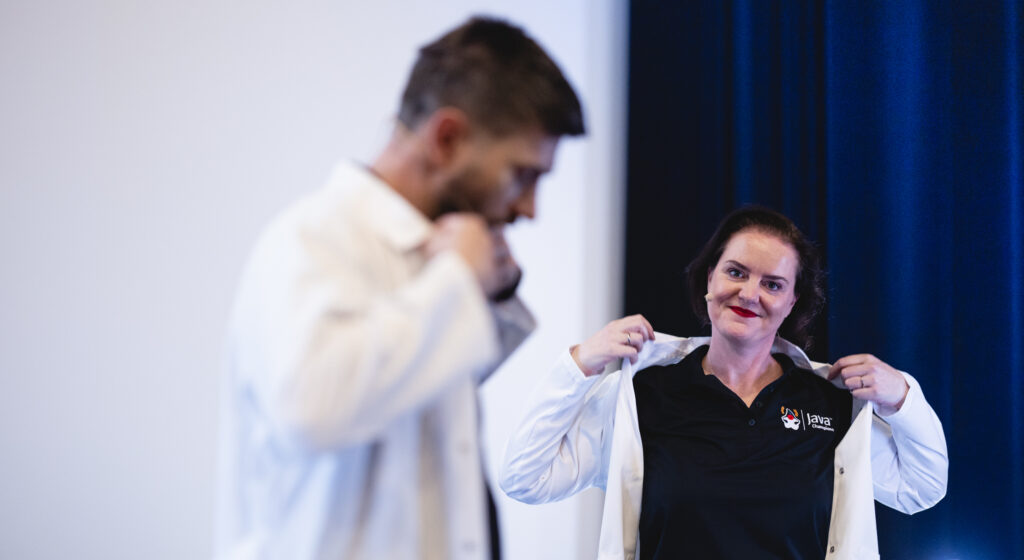
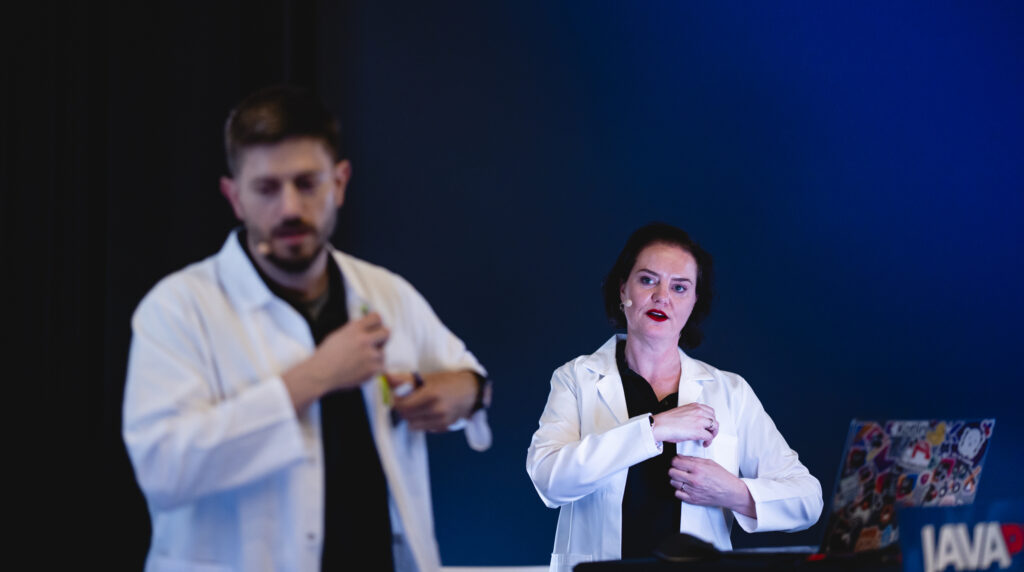
Speaking about IntelliJ IDEA
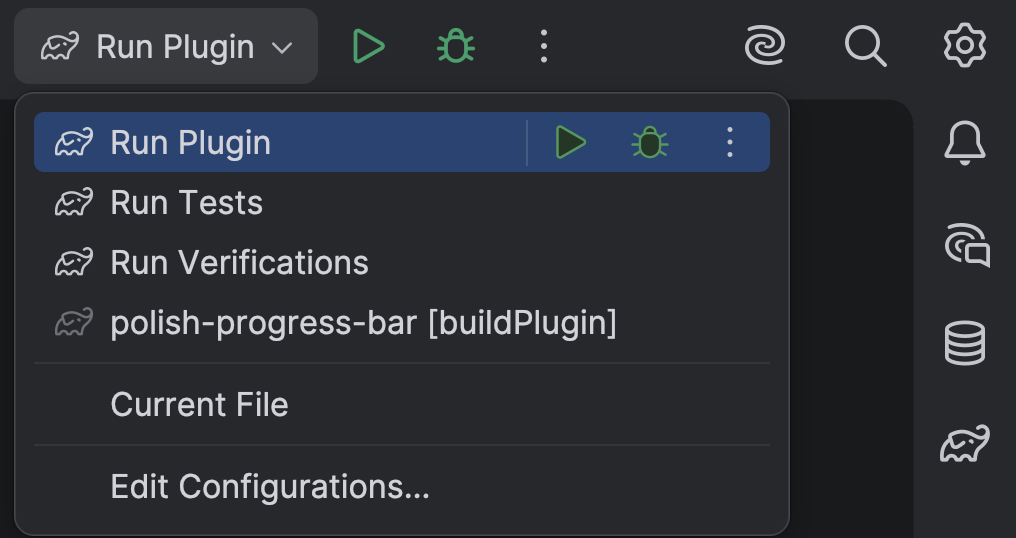
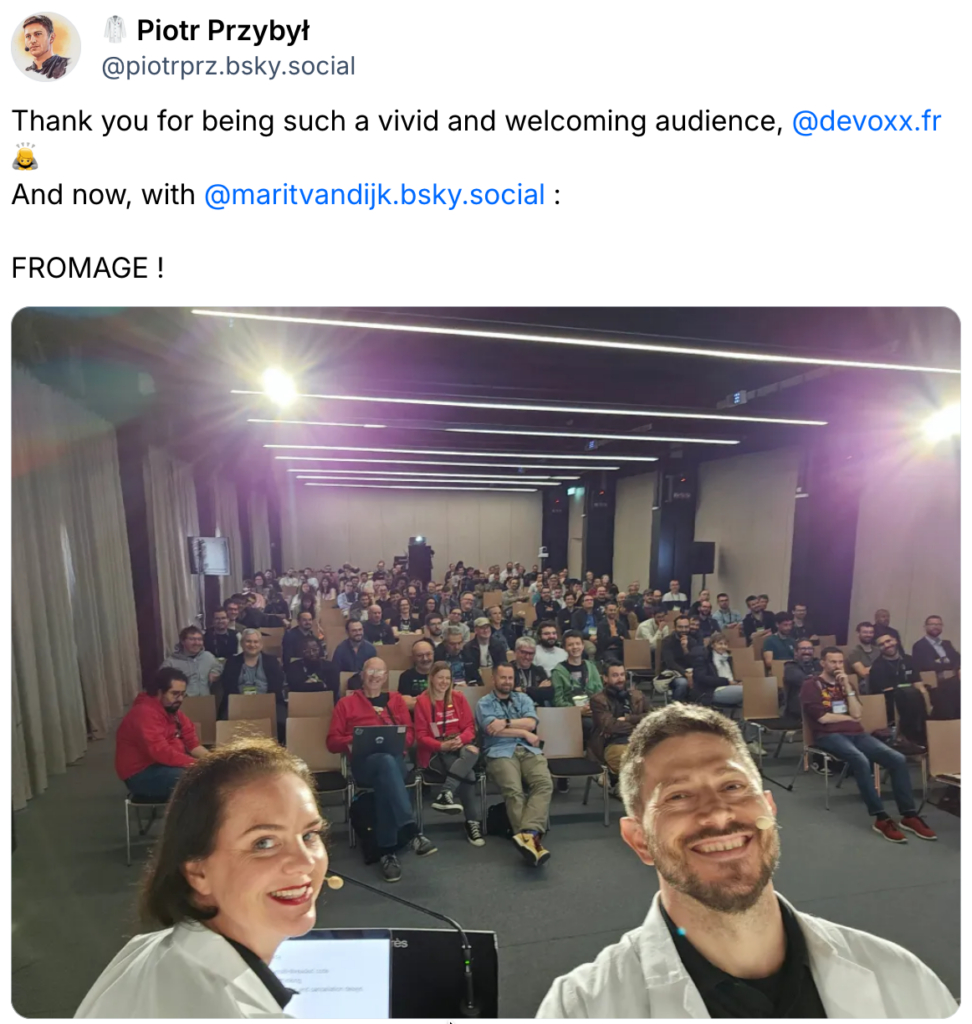
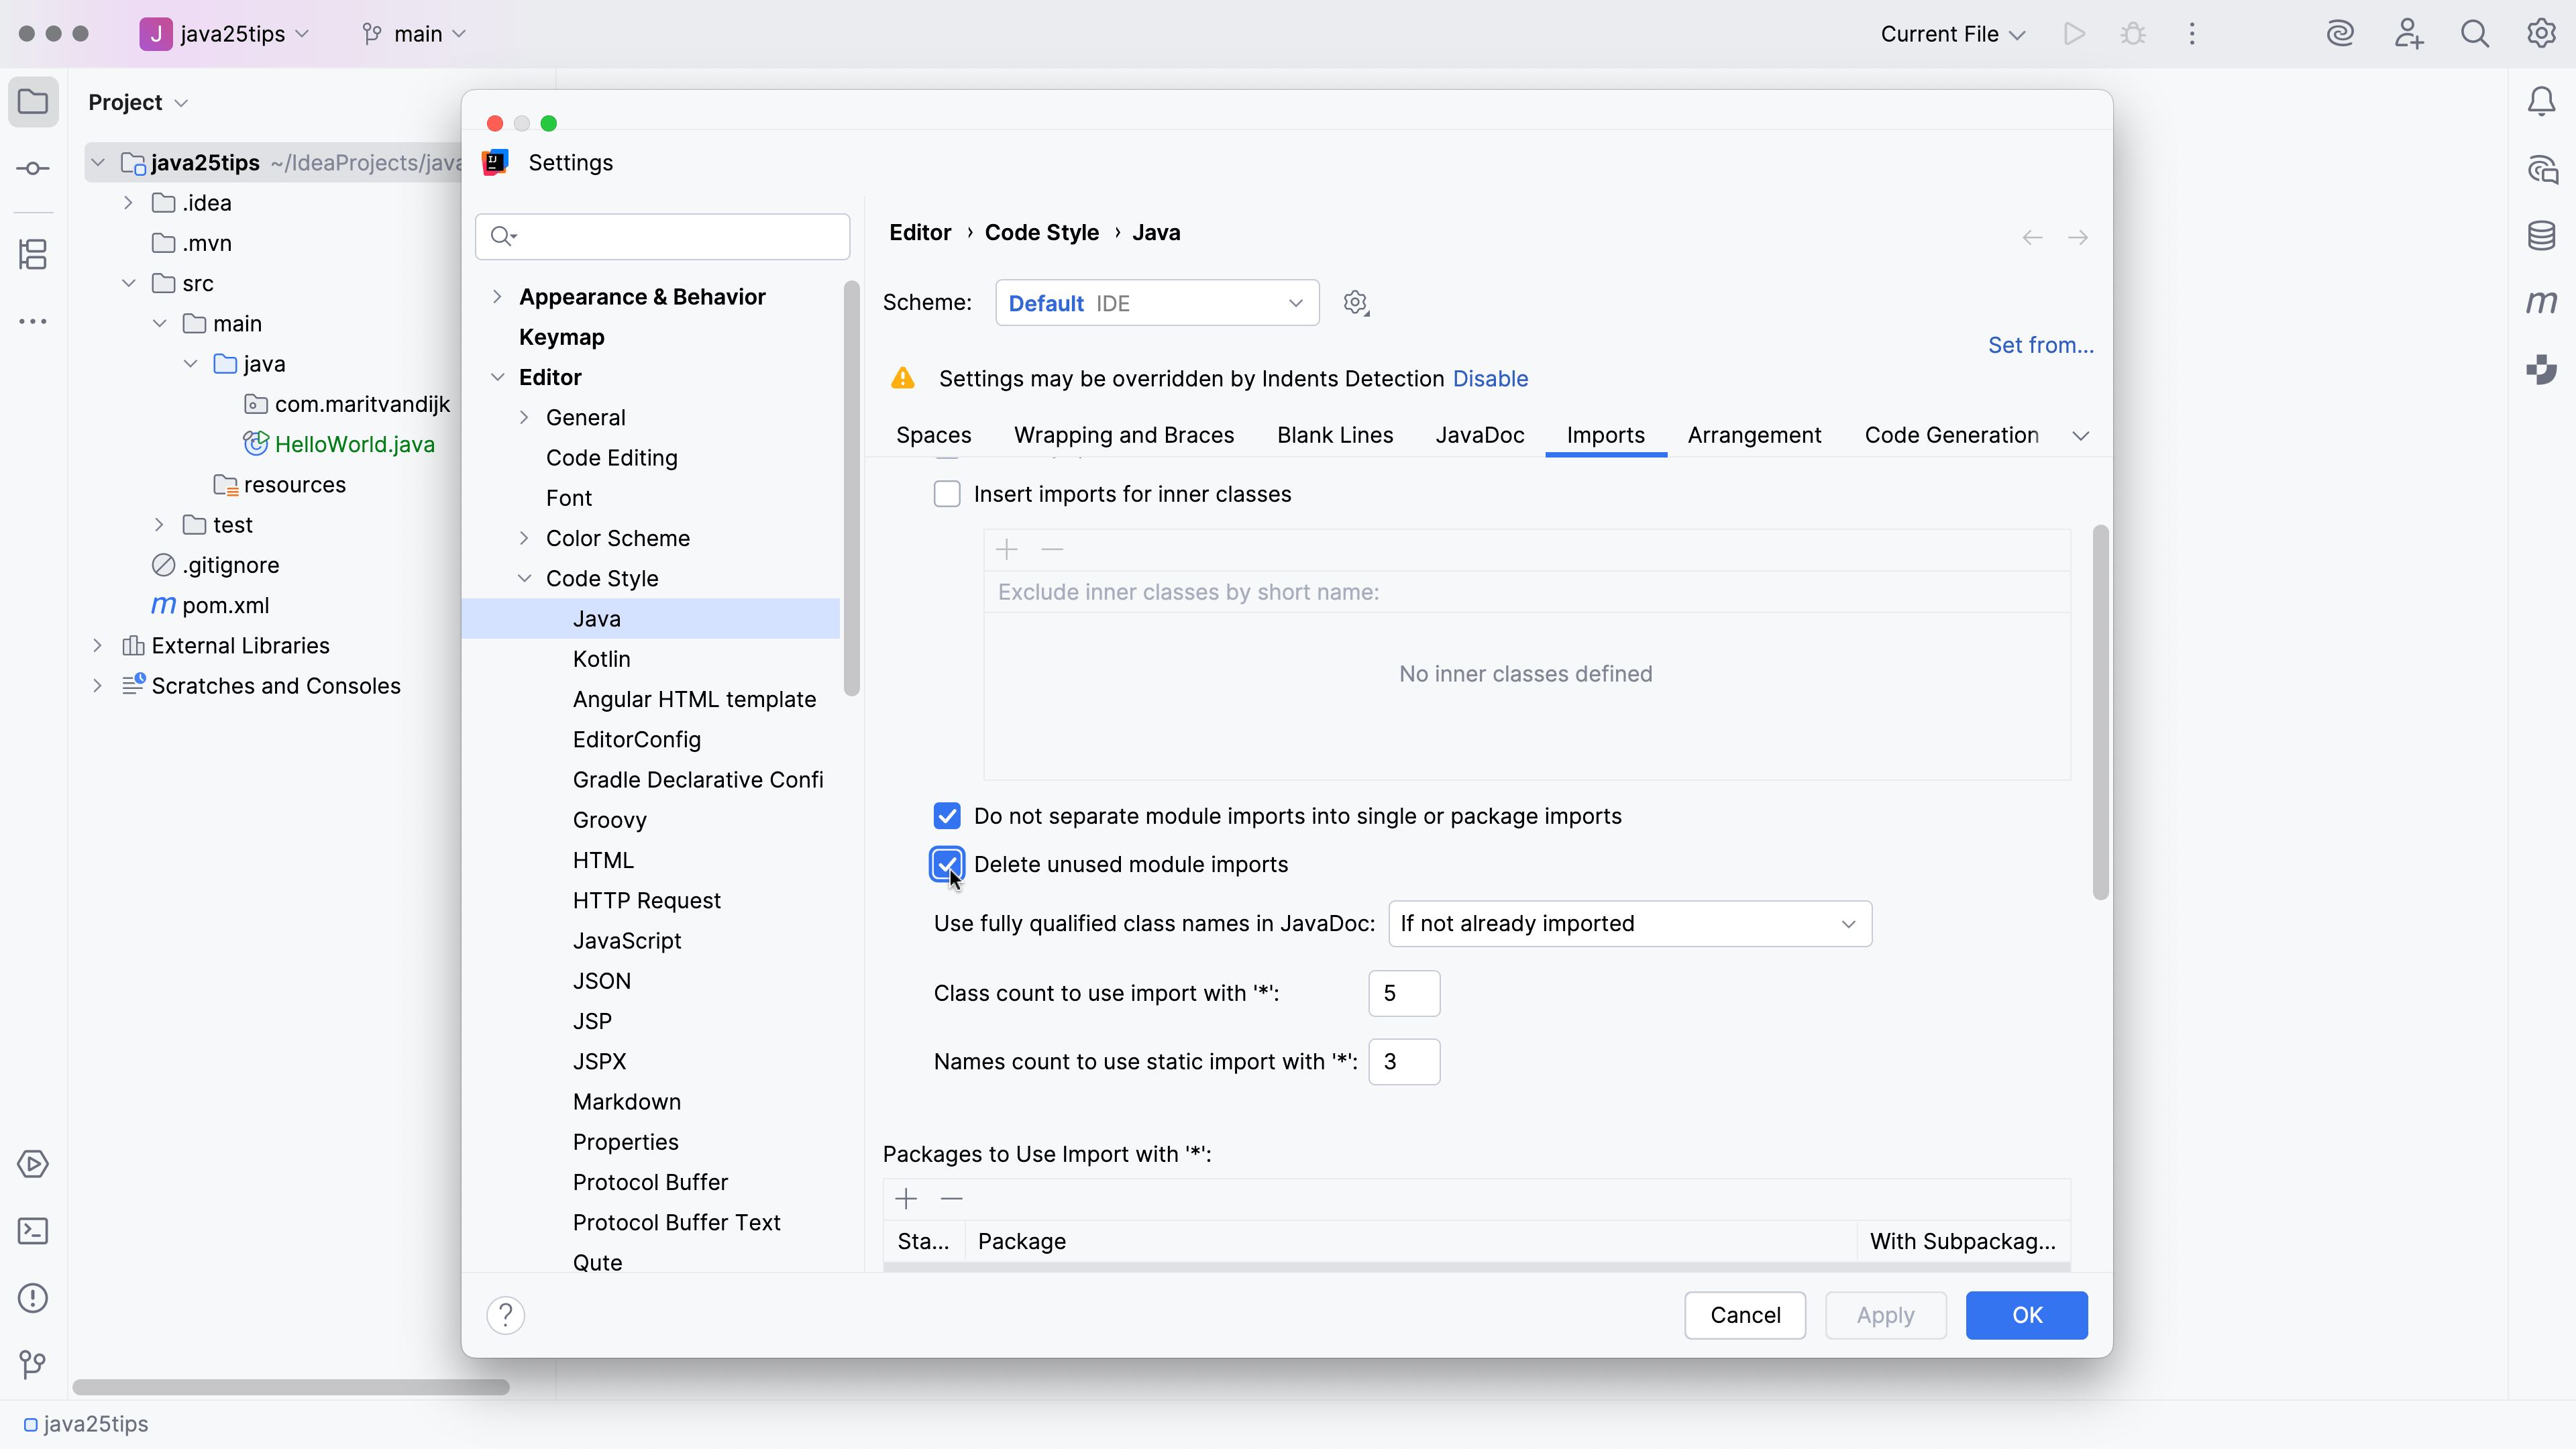
My talk was Be more productive with IntelliJ IDEA, where I live demo features in IntelliJ IDEA. Some features have been there for ages, but I also like to include new features that were added recently, like command completion, and even features that we are still working on for the upcoming release, like logpoints. The room was full, with some people even standing in the back, and the audience was lovely!
You can watch the other talks from JNation 2026 on YouTube.
The hallway track, with extra snacks
After my talk, I had some time to explore the venue some more and talk to people. Some of my friends were staffing a booth with their company, so I went to find them. Also, I spent some time in the speaker room, which was nice and cool. This is a good place to get some work done, or talk to other speakers. Walking around the venue is also a good way to meet people, and get feedback either on our products or my talk, or hear what people are working on.
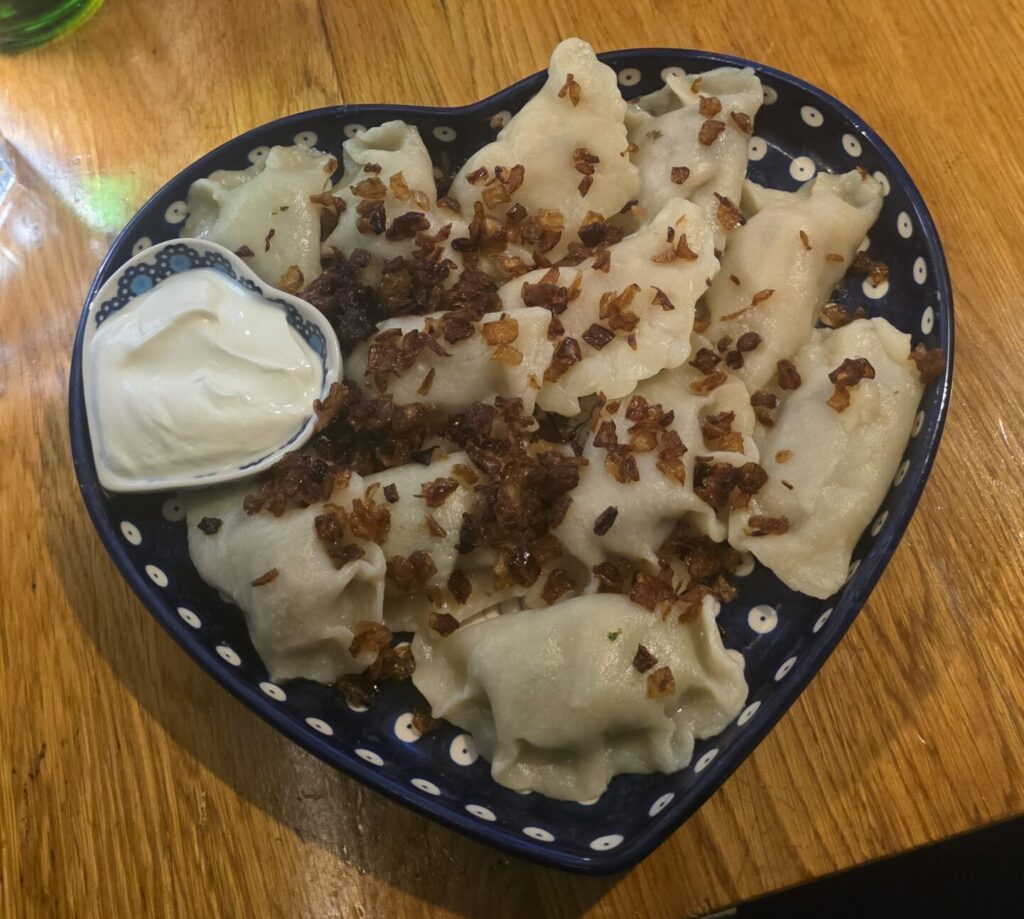
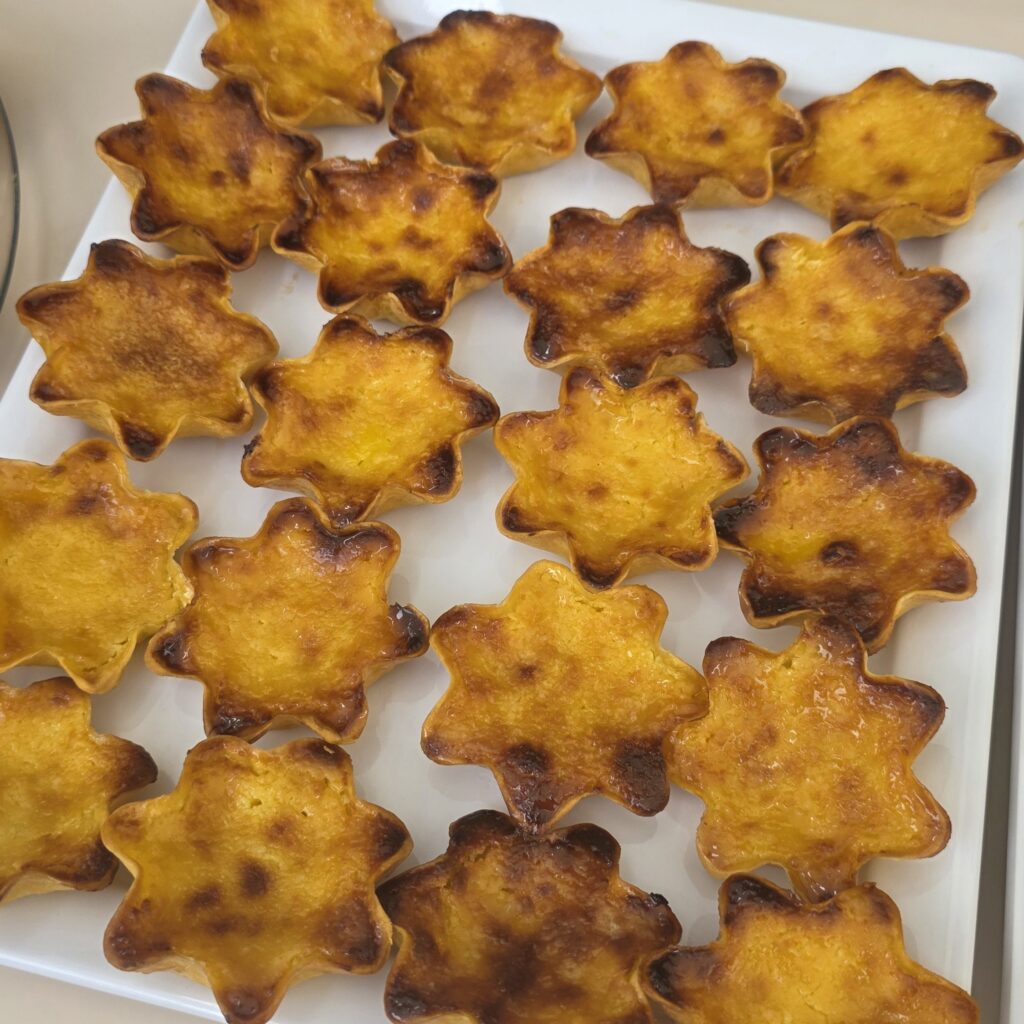
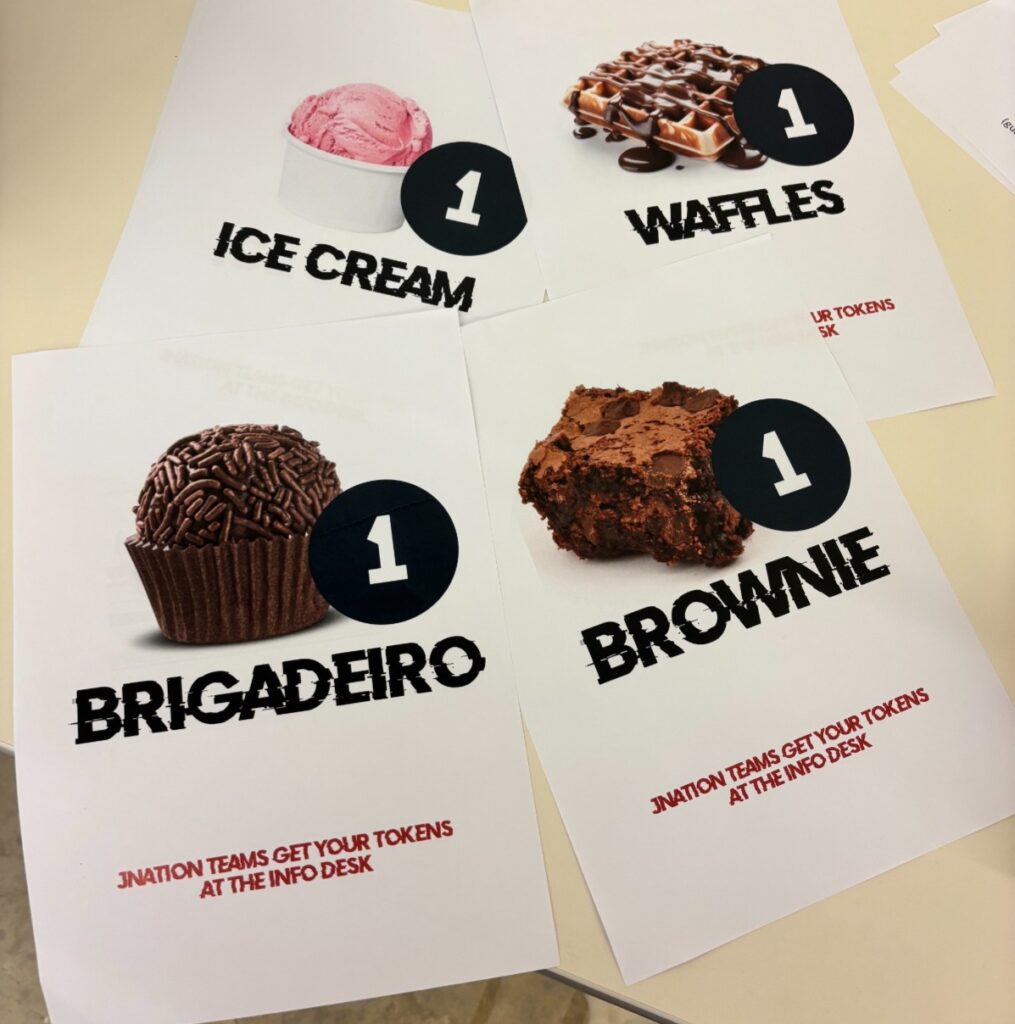
There were plenty of food and snacks, including some delicious pastéis de nata as well as ice cream, which was very welcome in the hot weather! To get some of the snacks, you needed tokens which you could get by speaking to sponsors at the booths. (Thanks Michał for some extra tokens.)
Livestream with Josh Long
Josh had invited me to come on his podcast, Coffee + Software. We had a lovely on-air conversation, which was also joined by our friend Daniel Garnier-Moiroux in the chat.
Interview with Andres Almiray
Andres Almiray was at JNation not as a speaker, but as an interviewer. He set up interviews with the speakers in the courtyard of the venue. Among other things, we spoke about some IntelliJ IDEA features, including the upcoming logpoints feature as an entry point to the debugger. Logpoints allow you to add logging to your application running in debug more, without having to change the code and redeploy your application. This will make it easier to start your investigation when debugging issues. It is built on top of the debugger, so you can expand your investigation with additional debugger features as needed.
You can watch the other interviews on the JNation YouTube channel.
After party and another dinner
The conference ended with an after party, with more music by Sam, and drinks with friends in the sun. From the party, we walked to a restaurant for another dinner arranged by the organisers. The food here was great, as was the company. This time I managed to get some pictures with Sam.
Conclusion
Even though it is a little hard to get to, I really enjoyed the conference. The lineup was great, the organisers take good care of the speakers, and I would highly recommend speaking at or attending this conference in the future!
Thanks Roberto Cortez, Bruno Baptista and all of the organisers and volunteers for a great event!