Almost three weeks ago, I had the pleasure of speaking at Voxxed Days Zürich. This was my third time at this conference, and also my third Swiss Voxxed Days this year (which will be relevant later!).
Speaker dinner
The speaker dinner the evening before the conference is always a good time to catch up with friends and meet other speakers. Good food and drinks are a bonus.
Because the restaurant was a little loud (maybe because it was filled with speakers…), some of us ended up outside.
Photographer Dimitris Doutsiopoulos took advantage of this to take some beautiful pictures, like this one of Paco van Beckhoven and me, which my colleague Jason Torres pointed out looks like a still from a movie. (It does, doesn’t it?)
Patrick created a beautiful animation for this year’s edition. And I have to say I am rather partial to these colors. They even got the steps of the cinema to match!
During the session they called out the Voxxed Days Switzerland Champions. Apparently I was one of six speakers who spoke at all three Swiss Voxxed Days conferences: Voxxed Days Ticino, Voxxed Days CERN and Voxxed Days Zürich. As I am a sucker for vanity metrics, I really appreciated this callout. 😂
Speaking with Andres Almiray about Maven
At Voxxed Days Zürich this year, I had the pleasure to do a new(ish) talk with Andres Almiray: “Getting more out of Maven”. This was only the second time we did this talk (the first time was at JavaLand). Unfortunately we had some trouble connecting my macbook to the screen, which threw us off a little…
During the talk we discussed several tips for using Maven in IntelliJ IDEA. We showed using the Maven wrapper to increase reproducibility of the build, and the enforcer plugin to see where your build breaks. We explained Maven lifecycle and goals, as well as how inheritance works, and more. And of course, we showed some useful IntelliJ IDEA features for working with Maven and dependency management, the dependency analyzer to find conflicts in dependencies, inspections to show you when dependencies have known vulnerabilities and finally the Vulnerable API inspection which can show you whether you are actually using the vulnerable API of a known vulnerability.
And of course, our session also included some custom memes that we created for this talk. If you want to see all the memes, you can find them in this repo.
Despite the initial technical trouble, overall our session went well. We got some positive feedback, and I had a nice conversation later with some of the attendees about the topic of our talk.
Other talks
During the day I managed to catch the following talks:
Agentic AI Patterns by Kevin Dubois and Mario Fusco
This was a great talk to stay up to date with everything AI. Kevin and Marco did also have some technical trouble, when there was some interference with audio from another room, which was quickly fixes by the conference.
Are We Ready For The Next Cyber Security Crisis Like Log4Shell? by Soroosh Khodami
Soroosh showed us how easy it can be to get compromised and different ways to prevent this.
Supercharge your JVM performance with Project Leyden and Spring Boot by Moritz Halbritter
Moritz showed us how Project Leyden can help you speed up your Spring Boot applications. Mandatory watching for anyone using Java and Spring Boot!
Hallway track
And I also managed to take advantage of the hallway track, again to catch up with people.
One of the downsides of using external dependencies, is that they might have known vulnerabilities at any time, as we have seen in the case of Log4Shell, Spring4Shell and other examples.
This means that, as developers, we have to keep track of which dependencies have known vulnerabilities and upgrade them if an unaffected version is available. Sometimes we might need to prioritize which dependencies to update when. This is where it comes in handy to know what the severity of the vulnerabilities is. And whether we are even using the vulnerable API of a vulnerable dependency. In IntelliJ IDEA, Package analysis, provided by the Package Checker plugin, and the Vulnerable API Usage inspection can do just that!
See which dependencies have known vulnerabilities
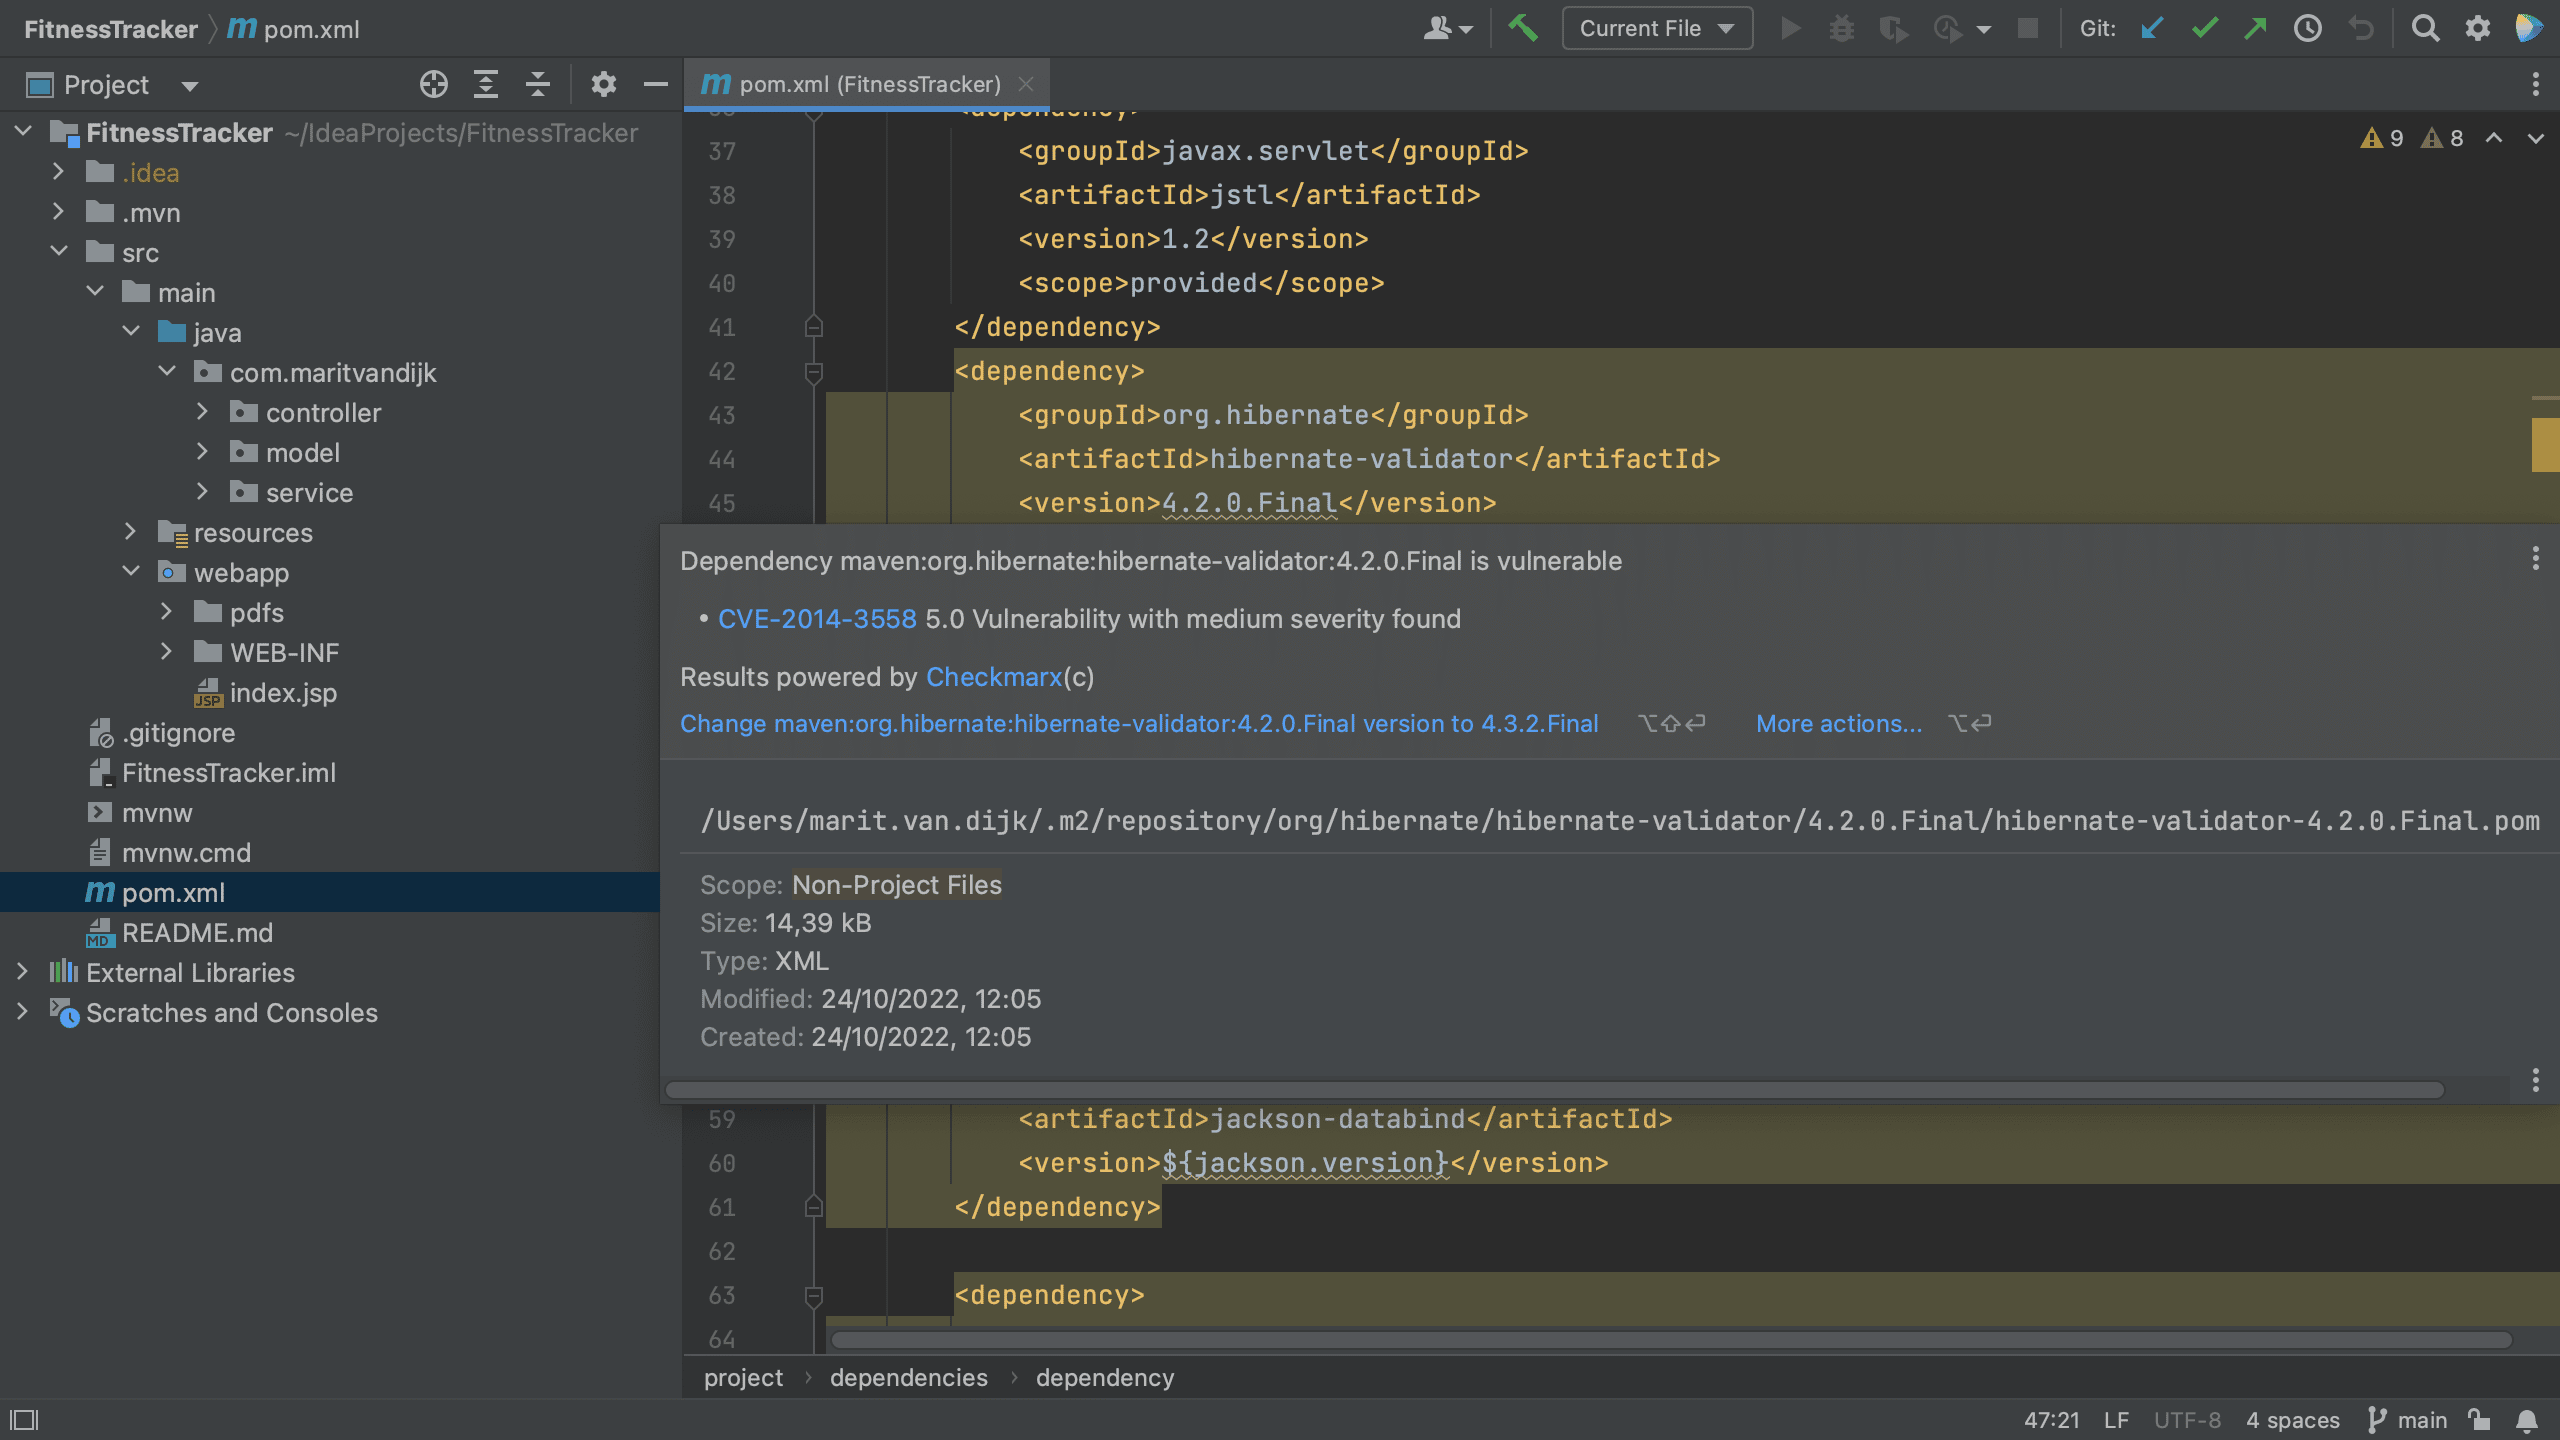
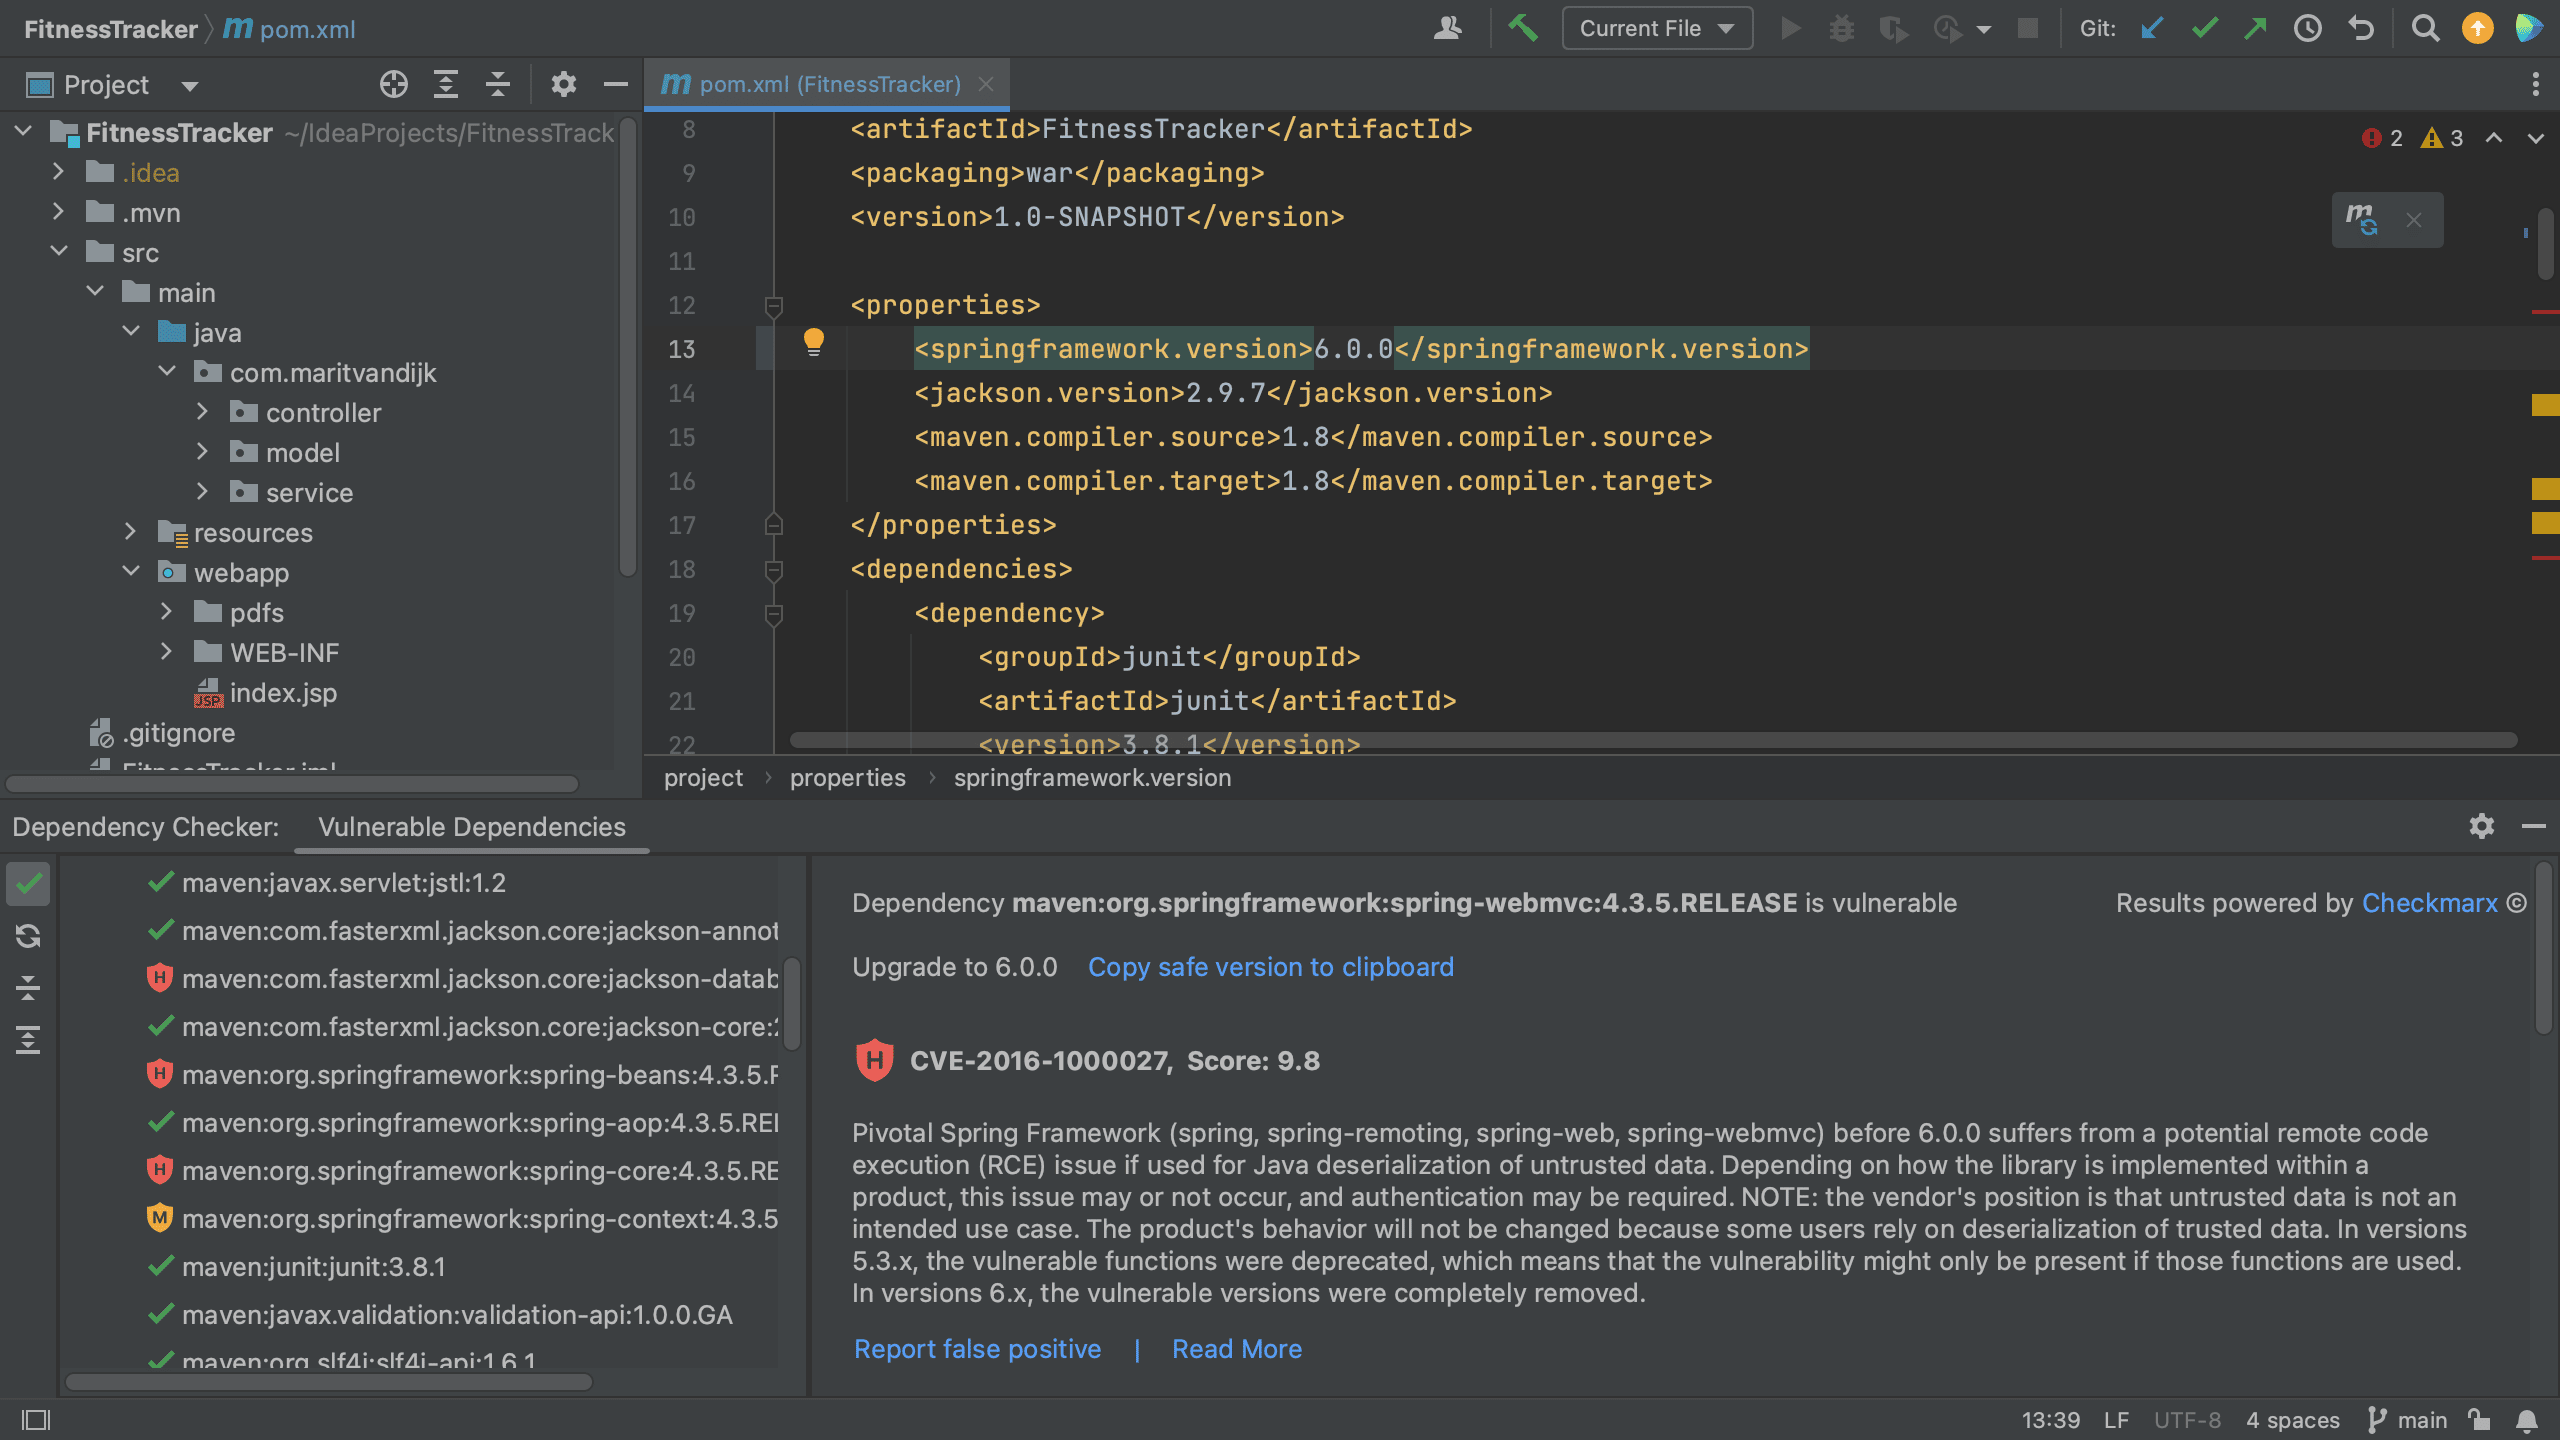
If the dependencies in your project have known vulnerabilities, IntelliJ IDEA will highlight them in the build file (`pom.xml` or `build.gradle`). When we hover over the highlighted dependency, we’ll see a list of known vulnerabilities with a link to more information, a severity score and a brief description.
Vulnerable dependency
We can click the link for a CVE number to open detailed information about that particular CVE in the Mend Vulnerability Database.
But we don’t need to leave our IDE to get more information about these vulnerabilities. In the popup, click the link Show details… to open the Vulnerable Dependencies tab in the Problems tool window.
Vulnerable Dependencies
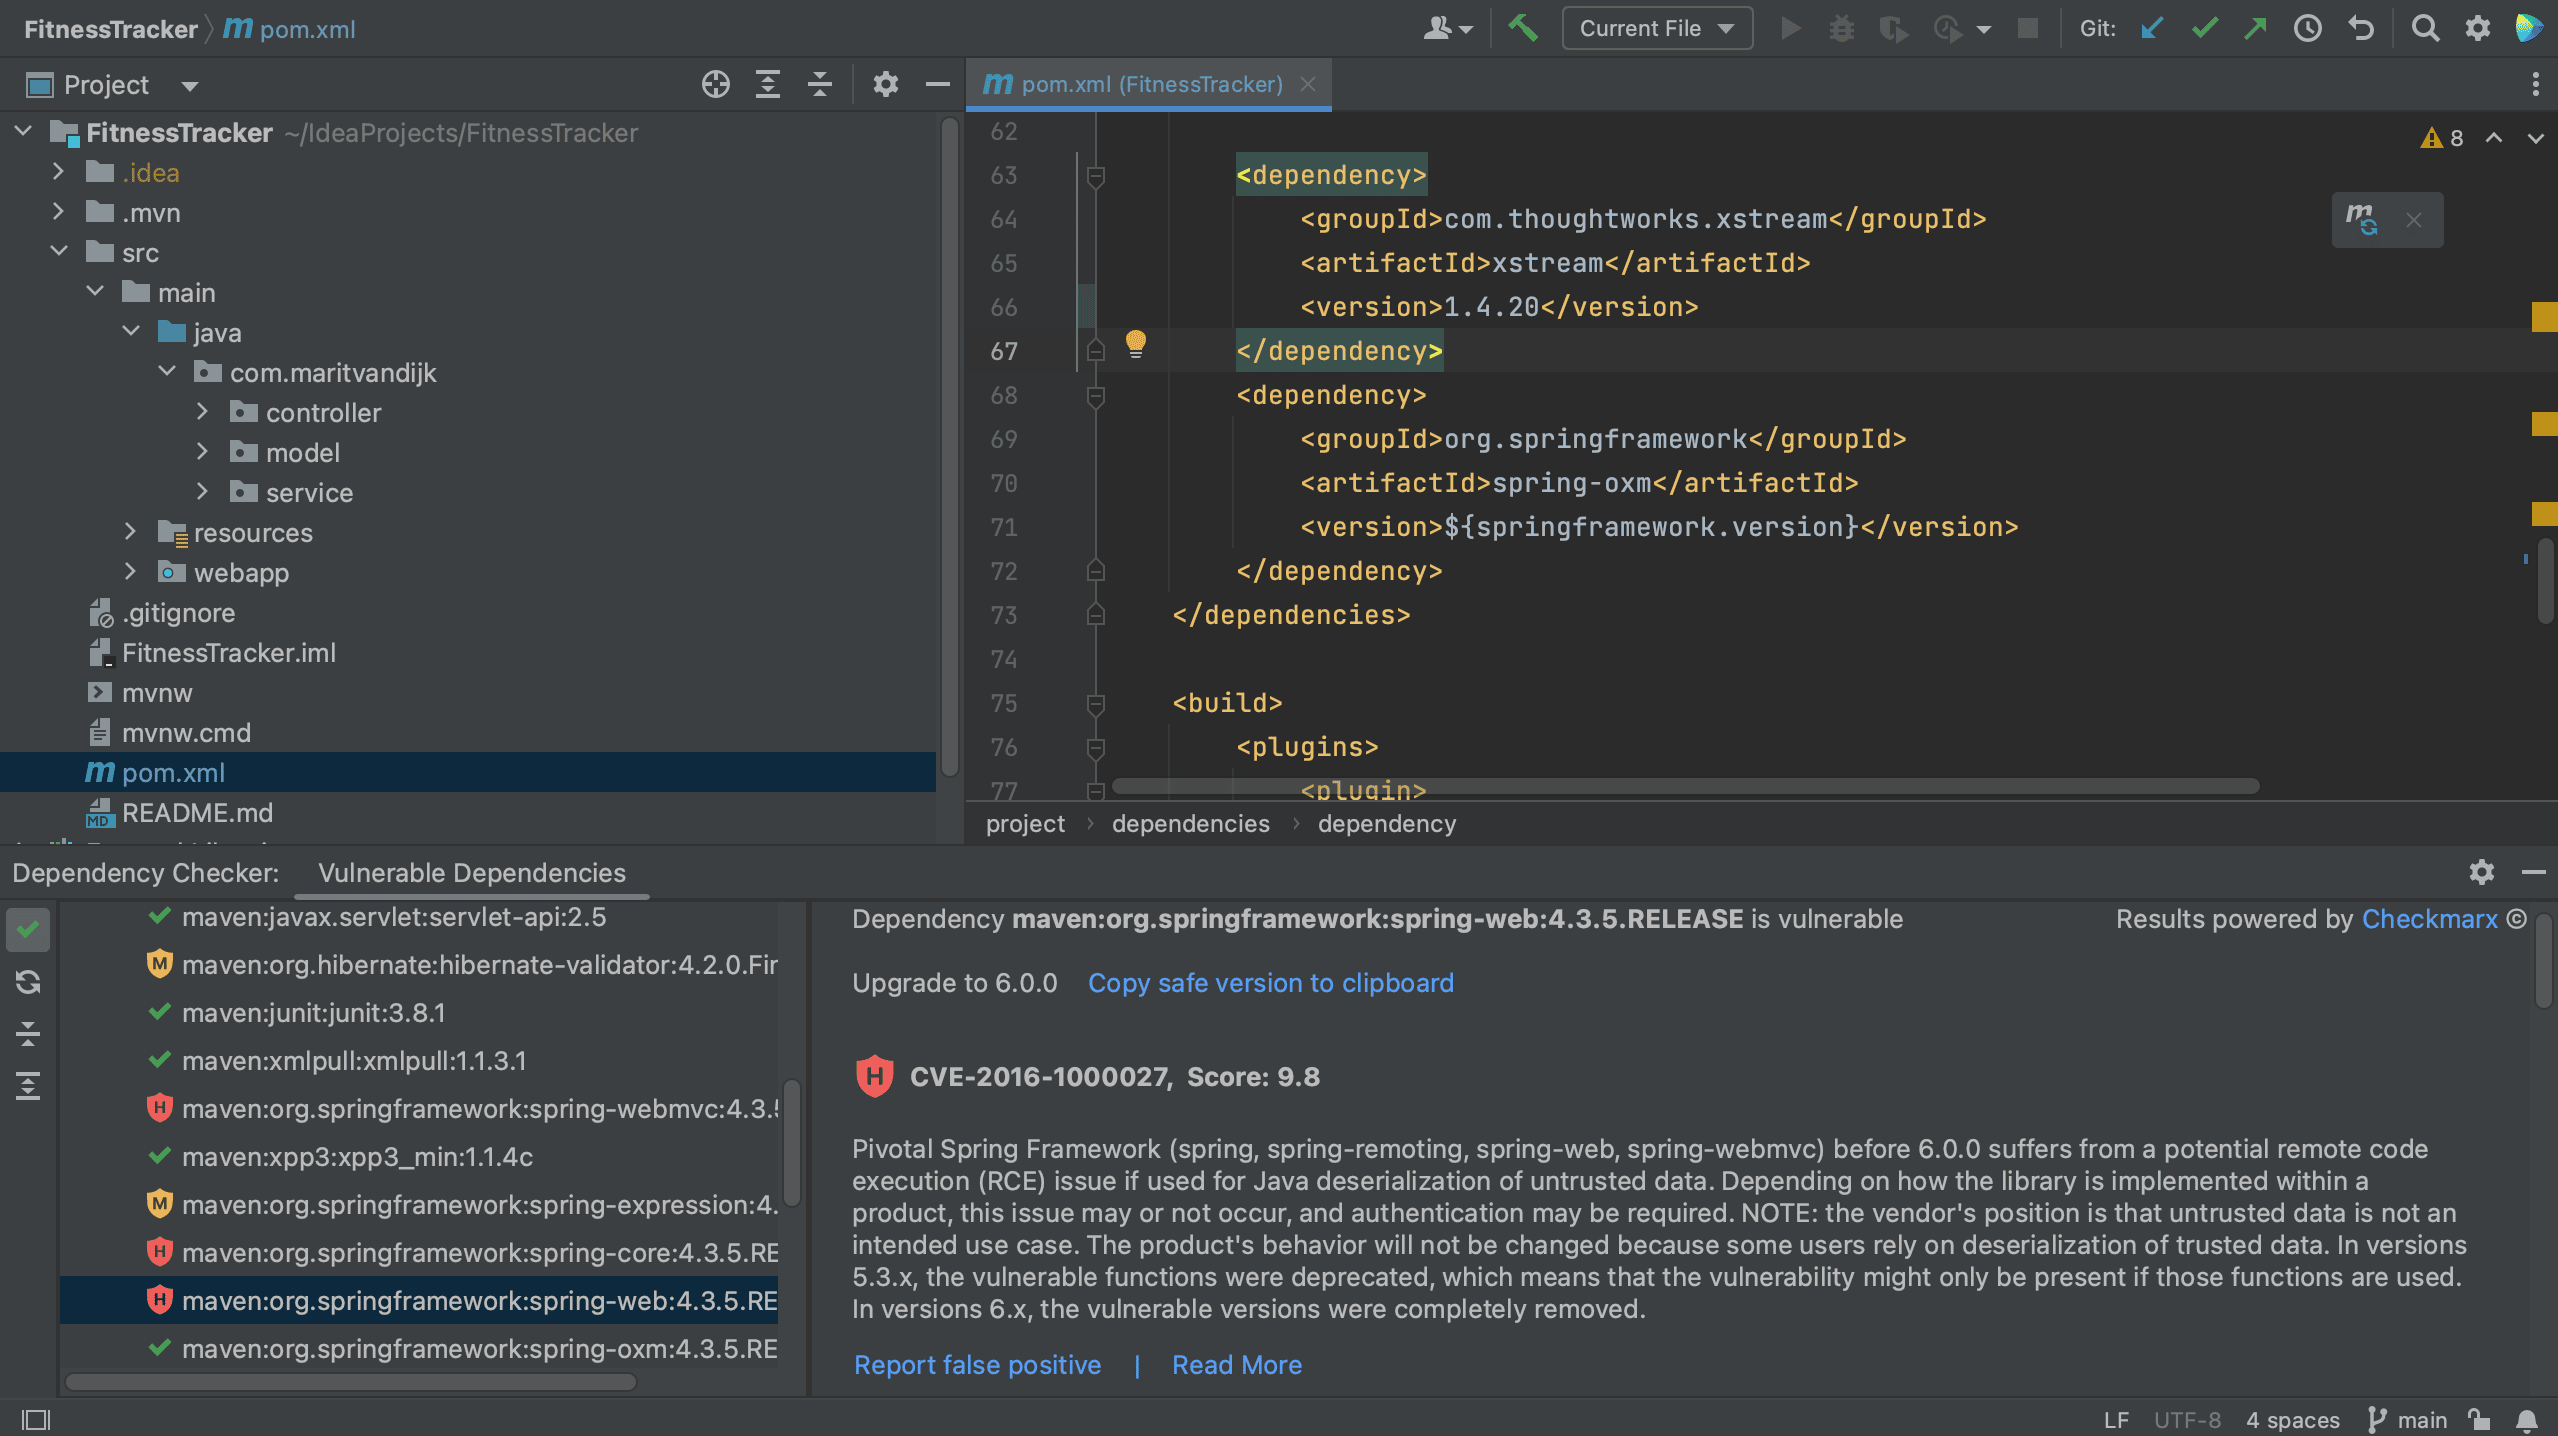
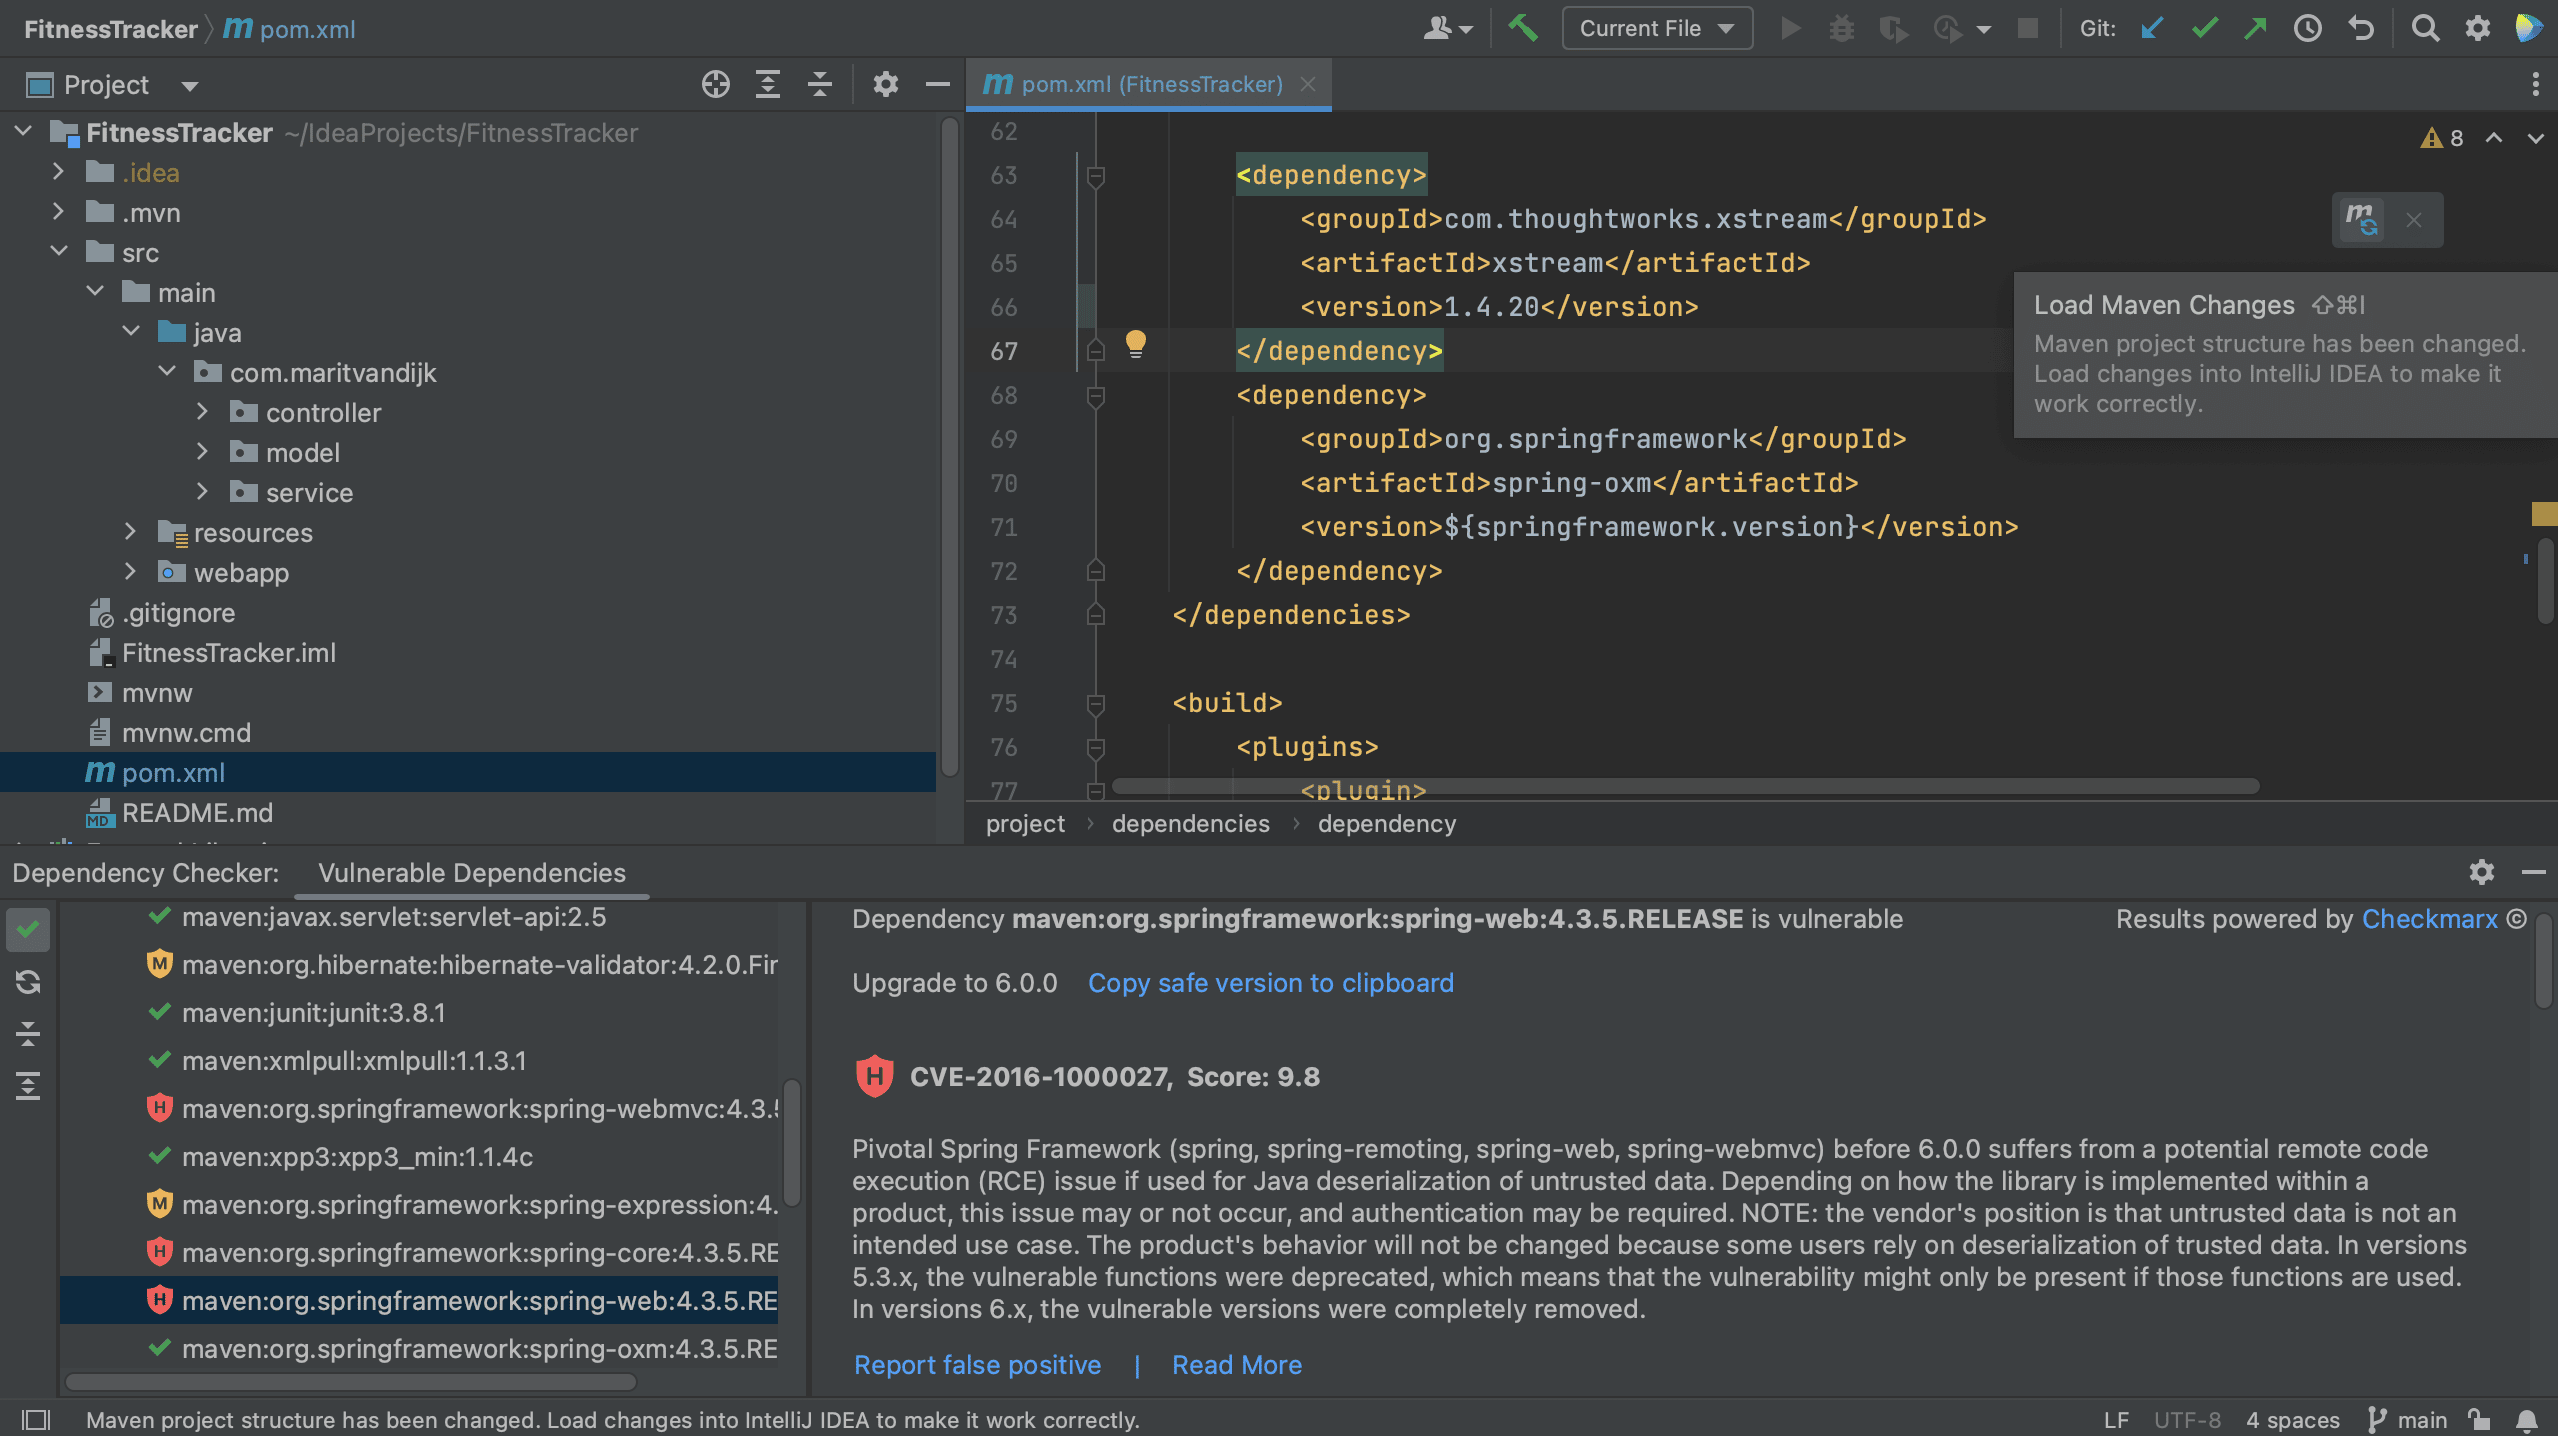
The Vulnerable Dependencies tab contains a list of dependencies with known vulnerabilities in our project and the severity of these vulnerabilities. Some dependencies bring in transitive dependencies with known vulnerabilities; we can expand these dependencies in the list to see the transitive dependencies, their known vulnerabilities and their severity.
When we select a dependency in the list, we can see more details about its vulnerabilities in the right hand side of the tab. We see the dependency, CVE number, severity score, and a summary of the vulnerability. If we still need more information, we can click the link Read more, to open the information about this vulnerability in the Mend Vulnerability Database..
Vulnerable Dependencies – Details
Dealing with vulnerabilities
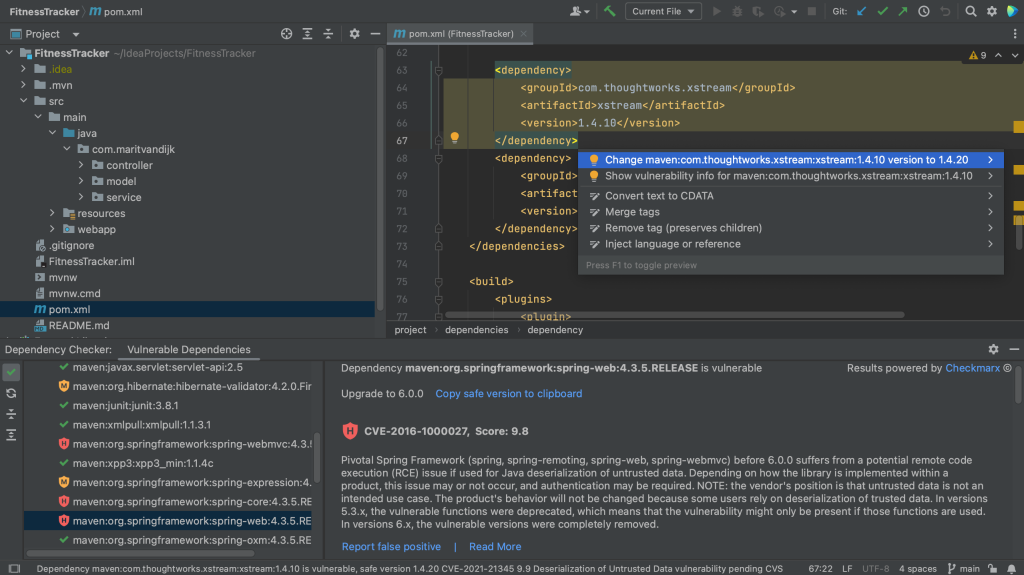
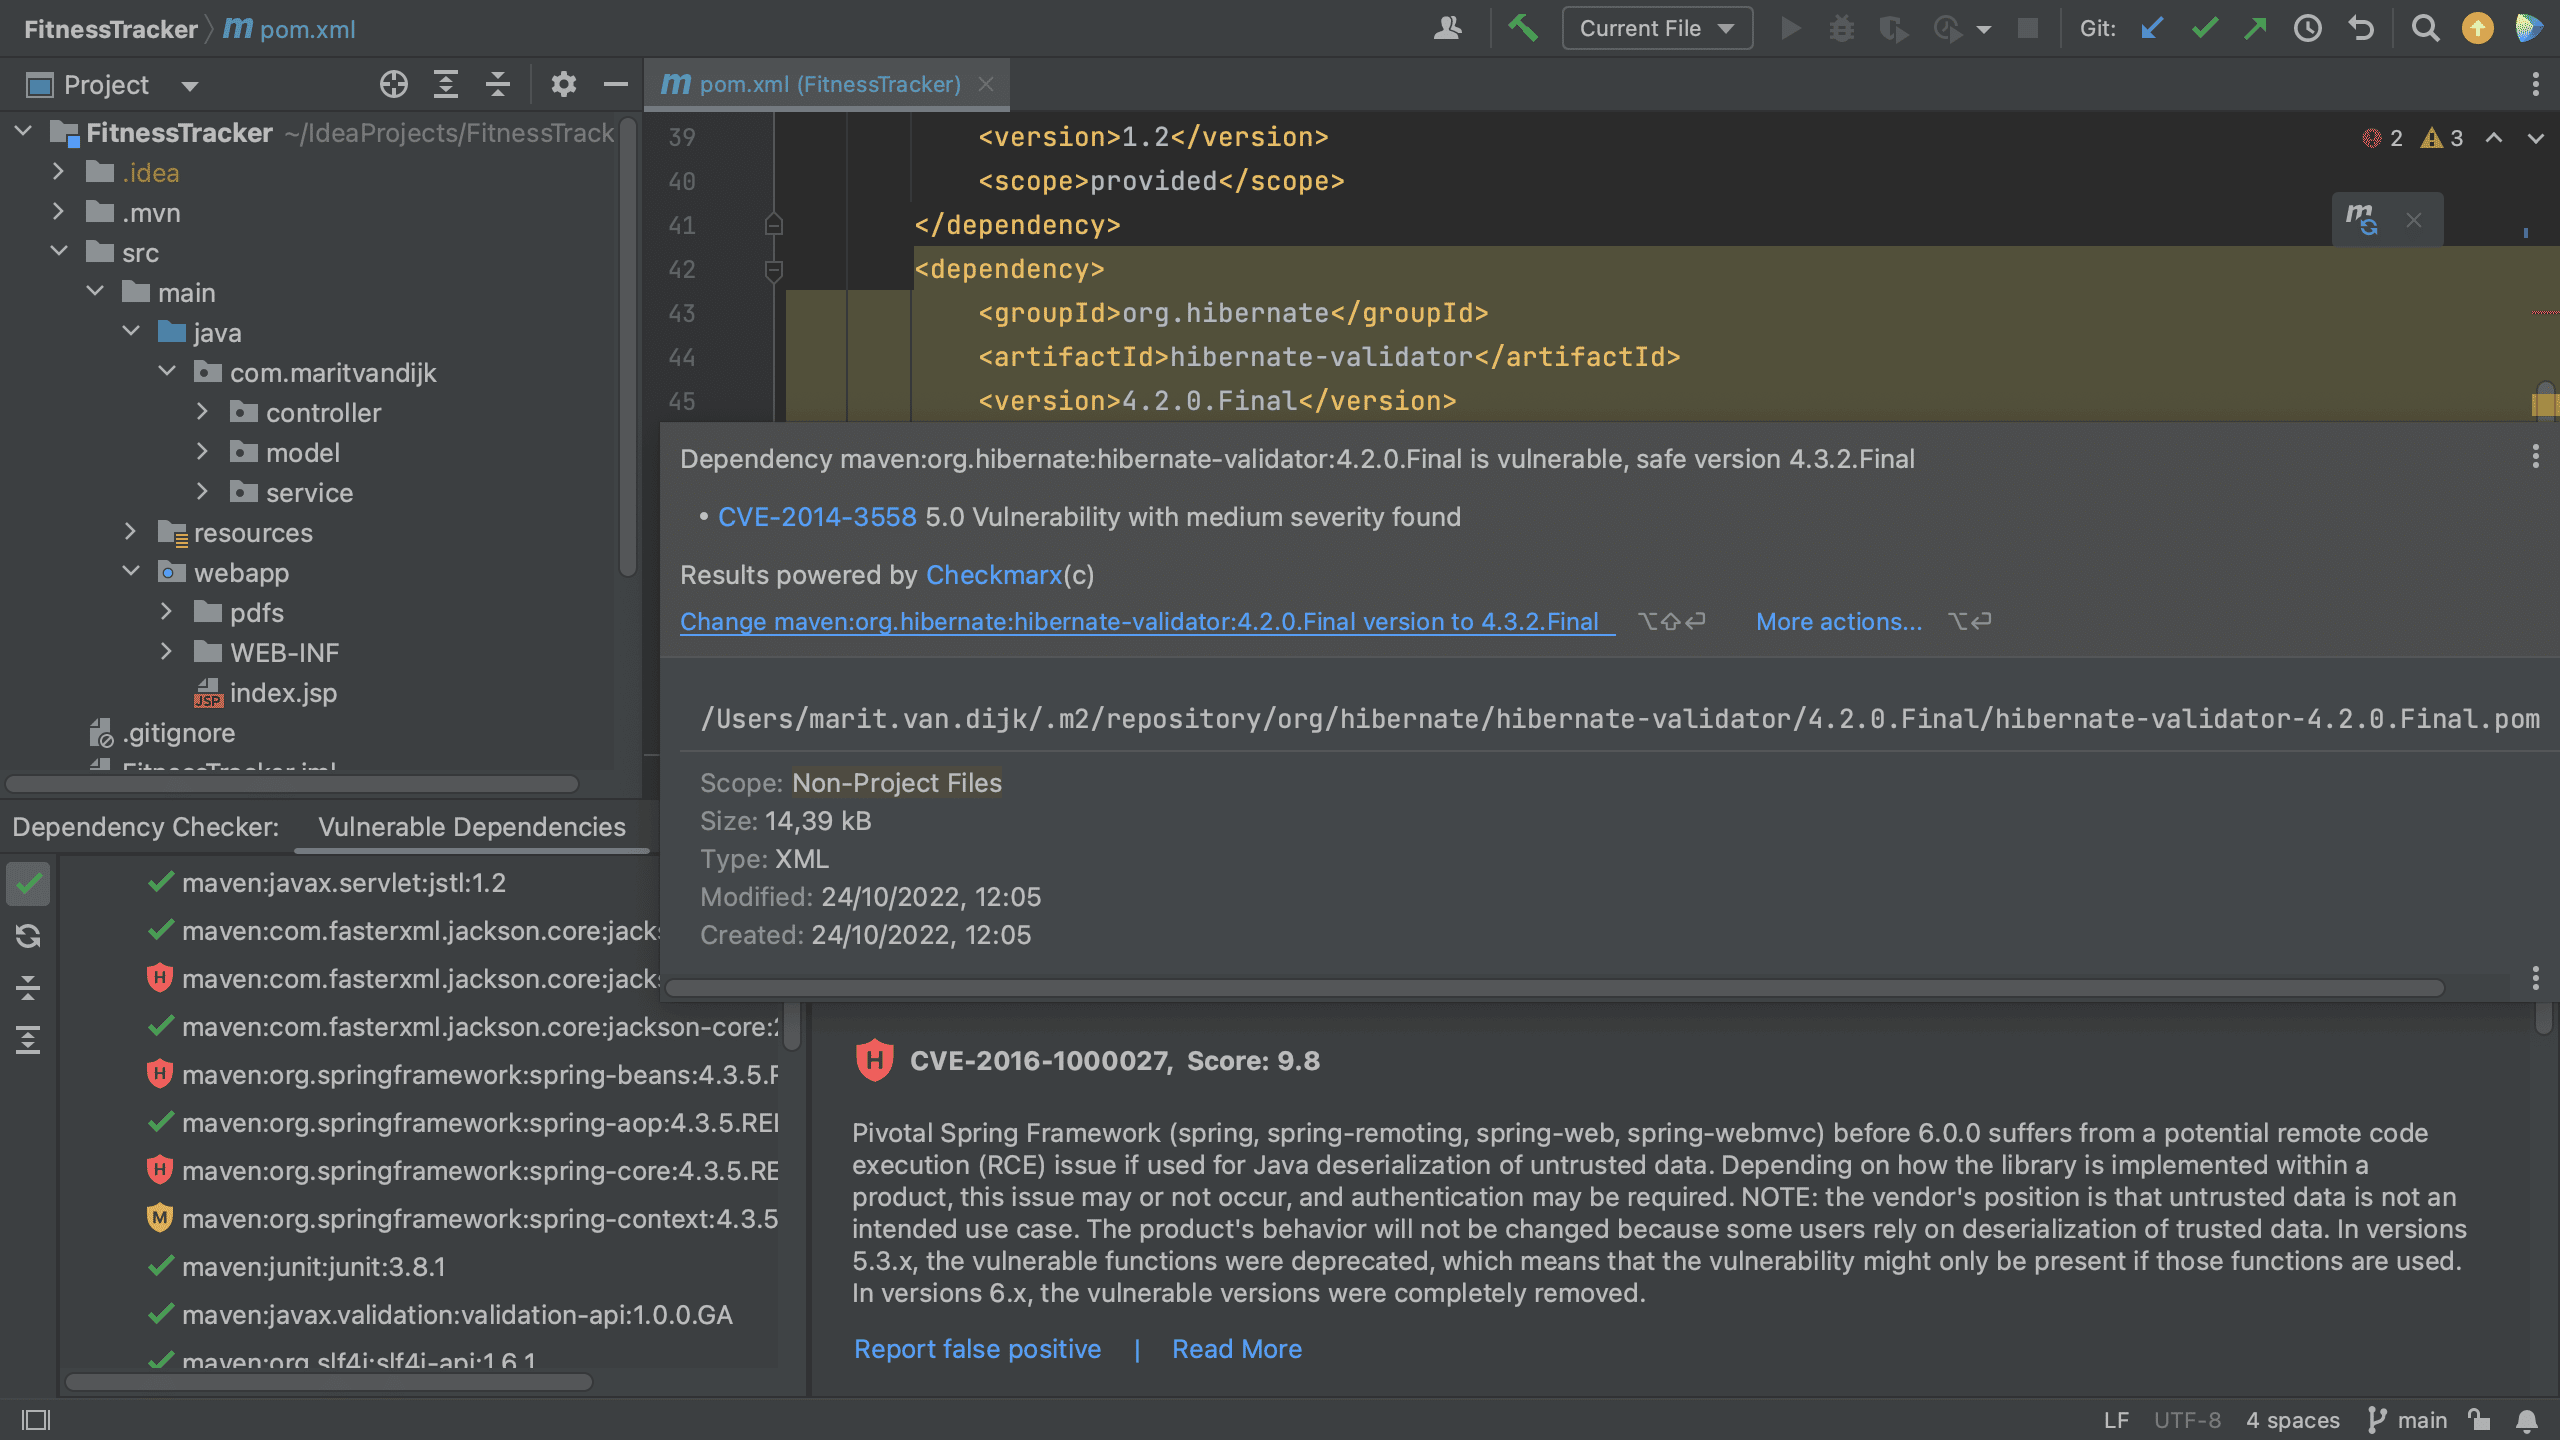
To deal with the vulnerabilities, we can use ⌥⏎ (on macOS) or Alt+Enter (on Windows/Linux) to have IntelliJ IDEA show us suggested fixes. For a vulnerable dependency, we have the option to update the dependency to an unaffected version (if one is available), ignore the vulnerability or show the vulnerability information for that dependency. The last option will show a list of all the known vulnerabilities for that dependency.
Suggested fixes
In most cases, we’ll want to upgrade the dependency instead. When we upgrade, we’ll also want to make sure that our project still builds and our tests still pass.
In some cases you may want to ignore a library that has known vulnerabilities. To do so, select the option “Ignore vulnerable <library name>” from the context action menu. In the Ignore Vulnerable Package popup that opens, select the reason you want to ignore this vulnerability. If you select Other, you’ll have the option to add a description.
Ignore Vulnerable Package
You may not want to ignore them forever though. To access the list with ignored vulnerabilities, open the IDE settings (⌘, on macOS or Ctrl+Alt+S on Windows/Linux) and go to Editor | Inspections. Expand the Security node and click Vulnerable declared dependency.
Vulnerable declared dependency
To make this easier to find, click the Filter Inspection button and select Show Only Modified Inspections. The list is located in the Options section in inspection details. Remove a dependency from the list of ignored dependencies, by selecting that dependency and clicking the remove button or using the shortcut. Once removed from this list, vulnerabilities in that dependency will no longer be ignored.
Show only modified inspections
Prioritizing updates
If our application has multiple dependencies with known vulnerabilities, you might need to prioritize which to update first. You can look at the severity of the vulnerabilities, but you might want to know whether your code is actually using the vulnerable part of a dependency.
If we are looking at code that calls the vulnerable API of a dependency, this code will be highlighted in the editor. When we hover over the highlighted code, we see a list of vulnerabilities found in this API call.
Vulnerabilities found in API call
We can use Show Intention Actions (⌥⏎ on macOS or Alt+Enter on Windows/Linux) and select Go to file with declared dependency from the menu.
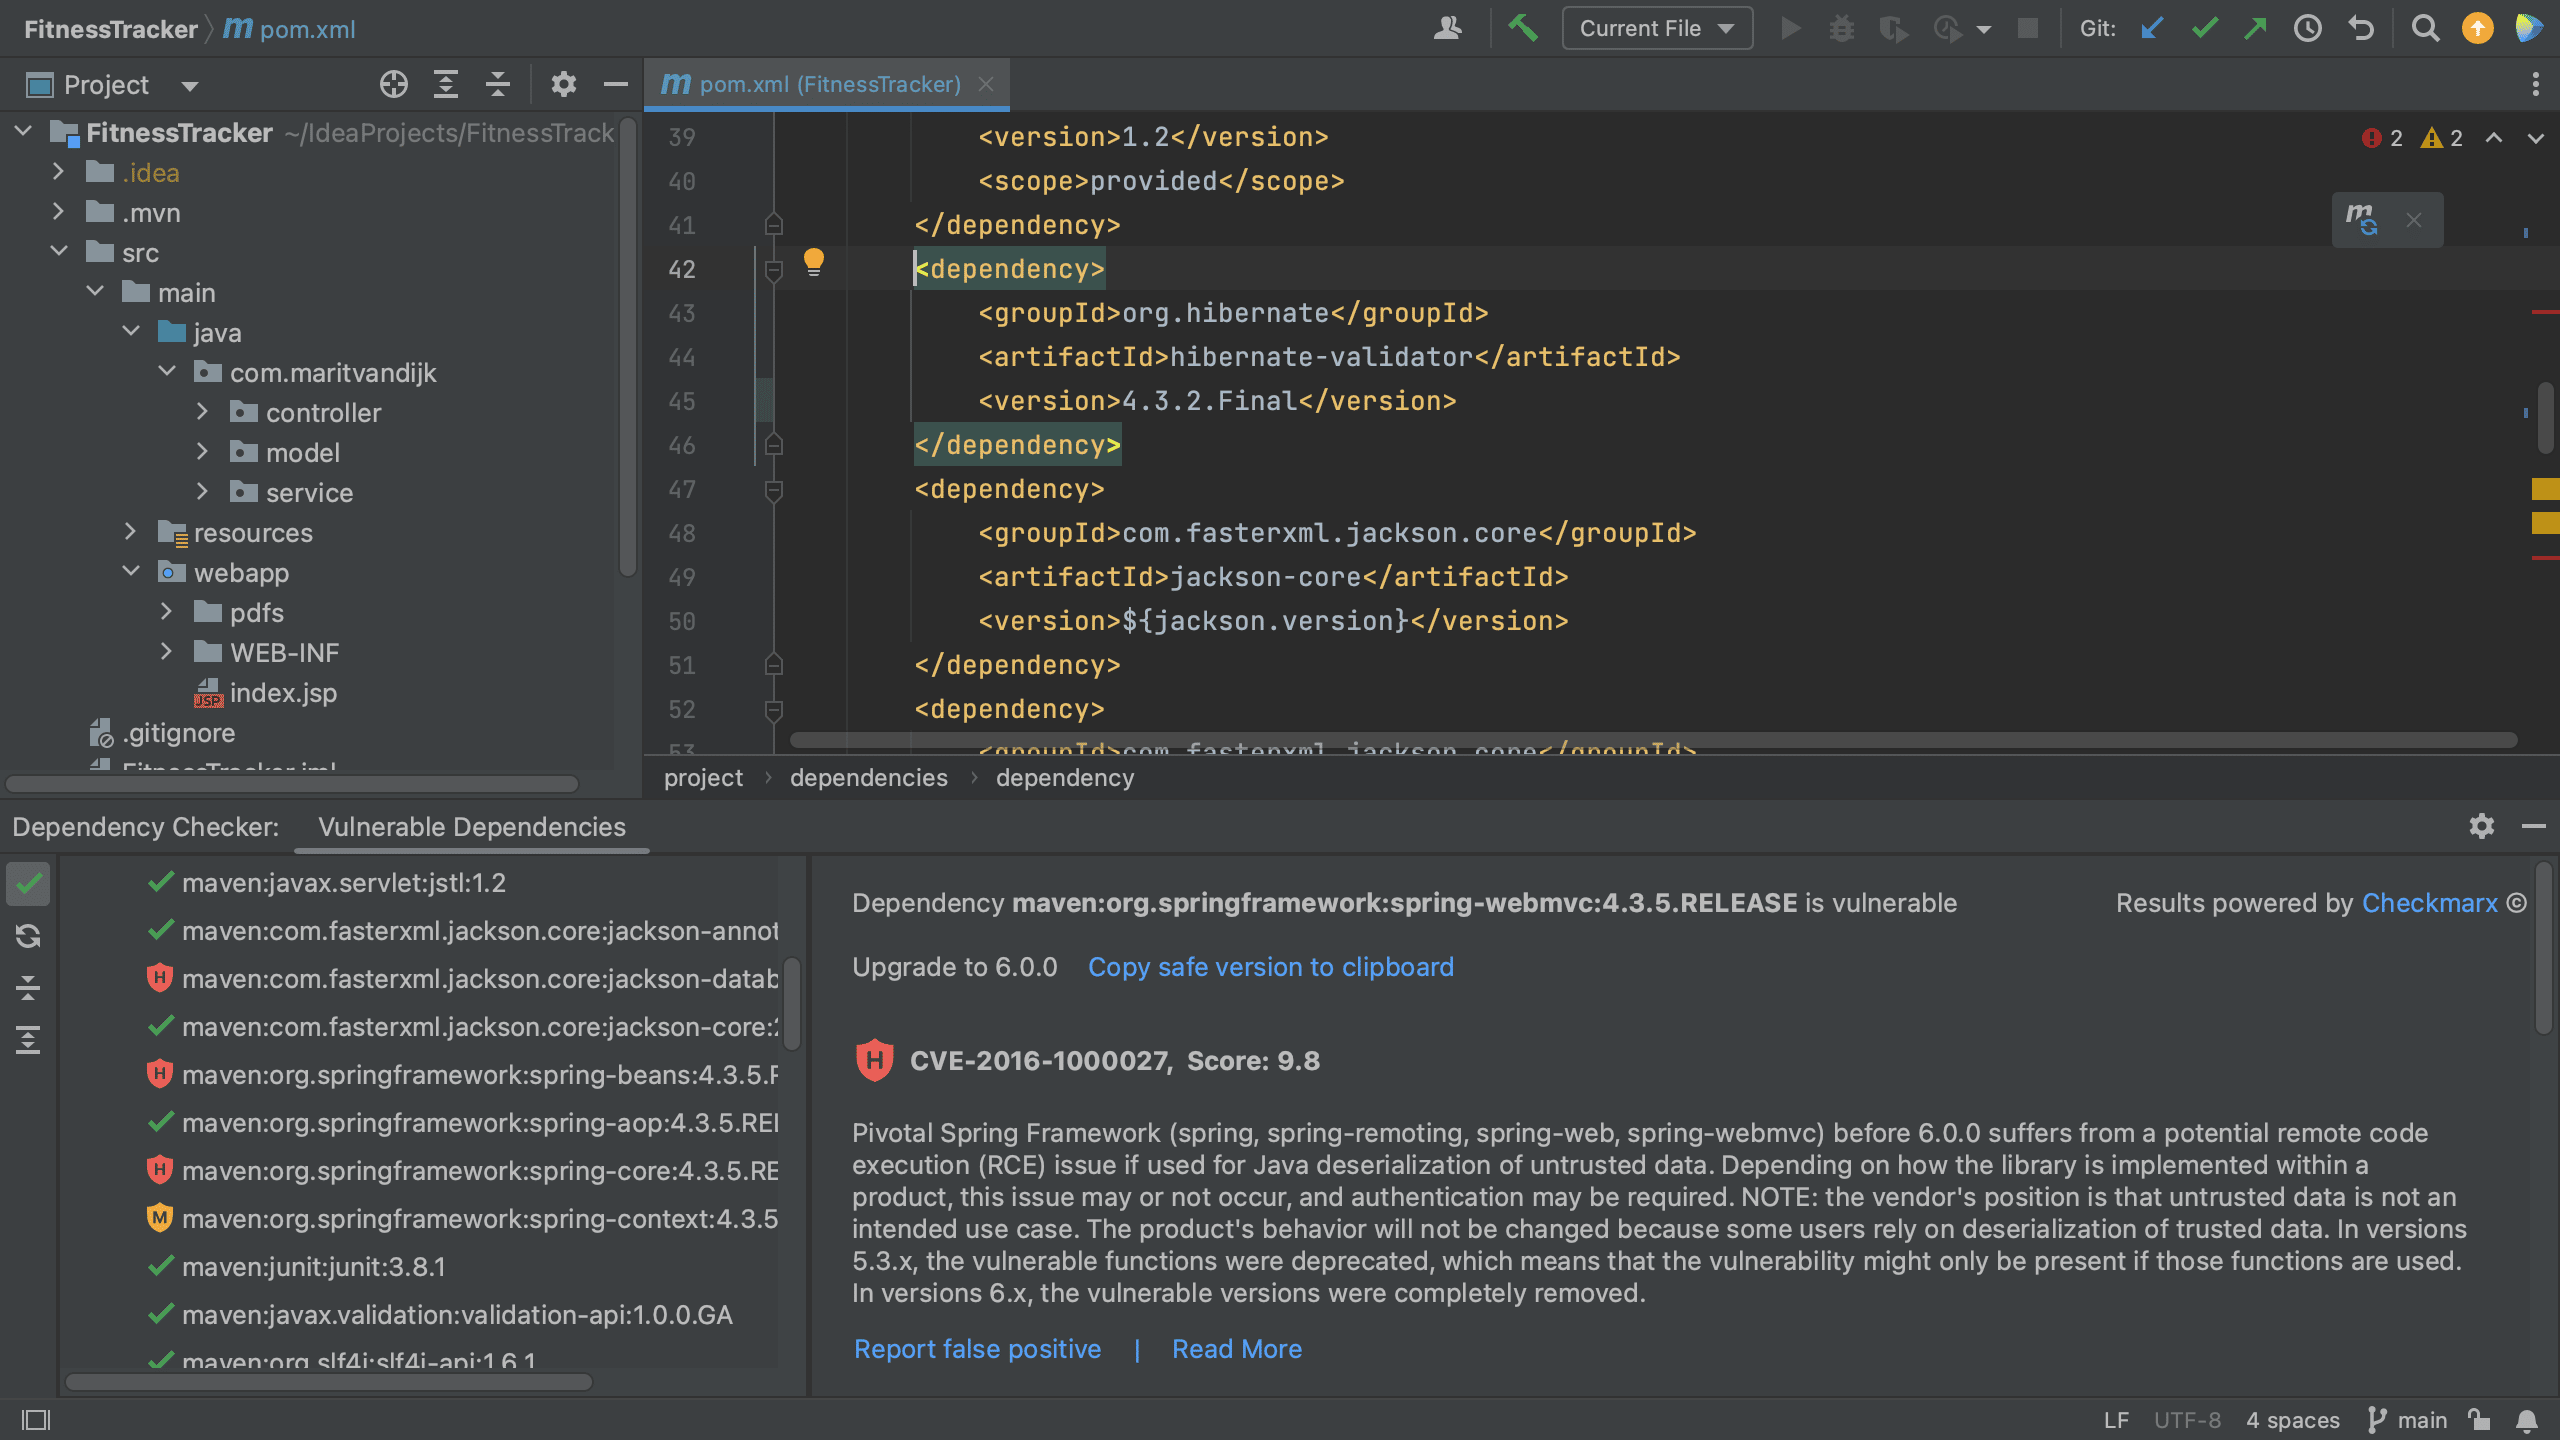
This will take us to the place in the build file where the dependency is declared, where we can use ⌥⏎ (on macOS) or Alt+Enter (on Windows/Linux) again to Update to unaffected version.
Go to file with declared dependency
Find out whether our code is using the Vulnerable API
But what if you’re not working on the exact file that uses the vulnerable API? How can you find out whether your code is using a vulnerable API anywhere in your project?
We can run the Vulnerable API usage inspection manually to get a report about all vulnerable APIs usages in our project. To run an inspection by name, we can go to Code | Analyze Code | Run Inspection by Name in the main menu, use Search Everywhere (⇧⇧ on macOS or Shift+Shift on Windows/Linux) to look for “Run inspection by Name”, or use the shortcut ⌘⌥⇧I (on macOS) or Ctrl+Alt+Shift+I (on Windows/Linux).
Run Inspection by Name
In the Enter inspection name popup that opens, type the name of the inspection you want to run: “Vulnerable API usage”.
Enter inspection name
Next, select the scope you want to run this inspection on. You could run the inspection on a file or custom scope, or use the File mask(s) option to narrow down the number of files that will be inspected. In some cases you might only want to look at a part of your application. In other cases, you’ll want to run the inspection on the whole project.
Scope
The results of the inspection will open in a tab in the Problems tool window.
Inspection results
The results will be shown on the left. Click one of the results to open a preview of that result on the right. This gives you the option to Go to file with declared dependency, which will navigate to the place in the build file where the relevant dependency is declared, and we can upgrade the dependency to the unaffected version from there. Alternatively, double-click the result to navigate to the affected code in the editor, to see exactly where and how the vulnerable API is used.
Vulnerable API Usage
Supressing inspections
Notice that it is also possible to Suppress the inspection. We can suppress the inspection either for the statement or the class, or suppress all inspections for the class.
Suppress
When you suppress an inspection, IntelliJ IDEA adds a new element before the selected symbol. When we select suppress for class, IntelliJ IDEA adds the `@SuppressWarnings` annotation. For statements, the `//noinspection` comment is added.
When an inspection is suppressed, the problem found by this inspection is no longer highlighted. To re-enable a suppressed inspection, delete the annotation or comment that the IDE has added before the selected symbol.
Suppressed vulnerability
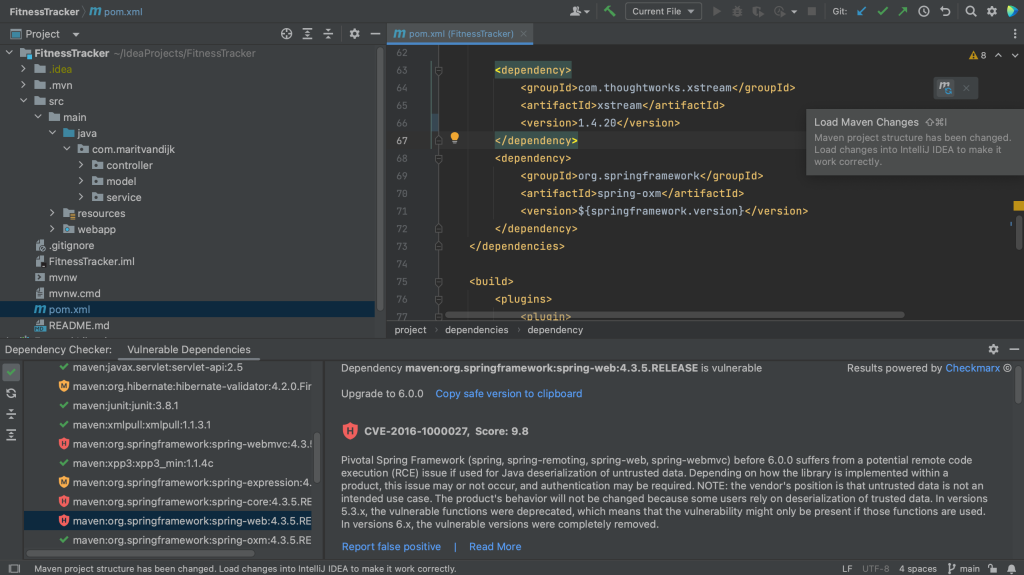
Upgrade dependency
Since we’re actually using the vulnerable API for this dependency in this example, we’ll definitely want to upgrade it! We can go to the file with the declared dependency, and use Intention actions (⌥⏎ on macOS or Alt+Enter on Windows/Linux) to upgrade to the unaffected version. If needed, Load Maven Changes (⌘⇧I on macOS or Ctrl+Shift+O in Windows/Linux) to import the updated dependency.
Conclusion
When we have resolved the vulnerable API usage, when we run the Vulnerable API inspection again, we will get the result: “Code inspection did not find anything to report.”
Knowing whether our code uses a vulnerable API can help us developers better prioritize which dependencies to update.
When dependencies in your project have known vulnerabilities, how do you know whether you’re actually using the vulnerable part of a dependency? Use IntelliJ IDEA’s Vulnerable API Usages inspection to find out!
IntelliJ IDEA is designed to help developers like us stay in the flow while we’re working. Like all IDEs, it has a lot of functionality available, but it’s designed to get out of your way to let you focus on the code.
Take a look at this overview of IntelliJ IDEA.
Introduction
Find Action: ⌘ ⇧ A (on macOS) / Ctrl+Shift+A (on Windows/Linux)
If you’re working on a real world project, you’re probably using external dependencies. You might need to analyze which dependencies your application uses. For example, you may want to find out how a particular version of a dependency ended up in your application. Let’s take a look at how IntelliJ IDEA can help you to analyze dependencies.
Using the Dependency Analyzer
We can view our dependencies in the Maven or Gradle tool window. Here, we can expand dependencies to show their transitive dependencies, or collapse them again.
Open the Dependency Analyzer
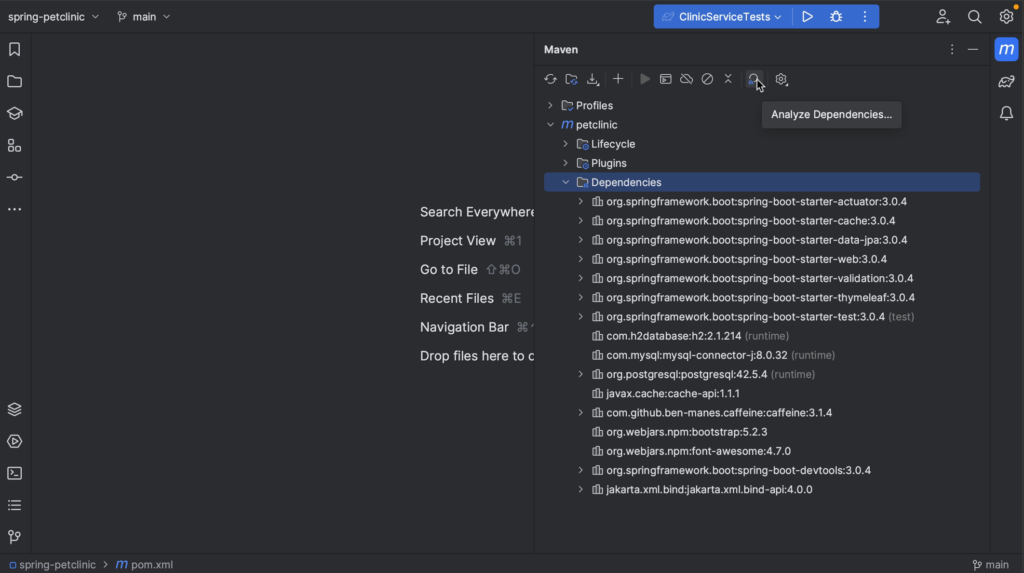
We can open the Dependency Analyzer from the Maven or Gradle tool window by clicking the Analyze Dependencies… button. This will open the Dependency Analyzer showing the Resolved Dependencies on the left and their Usages on the right.
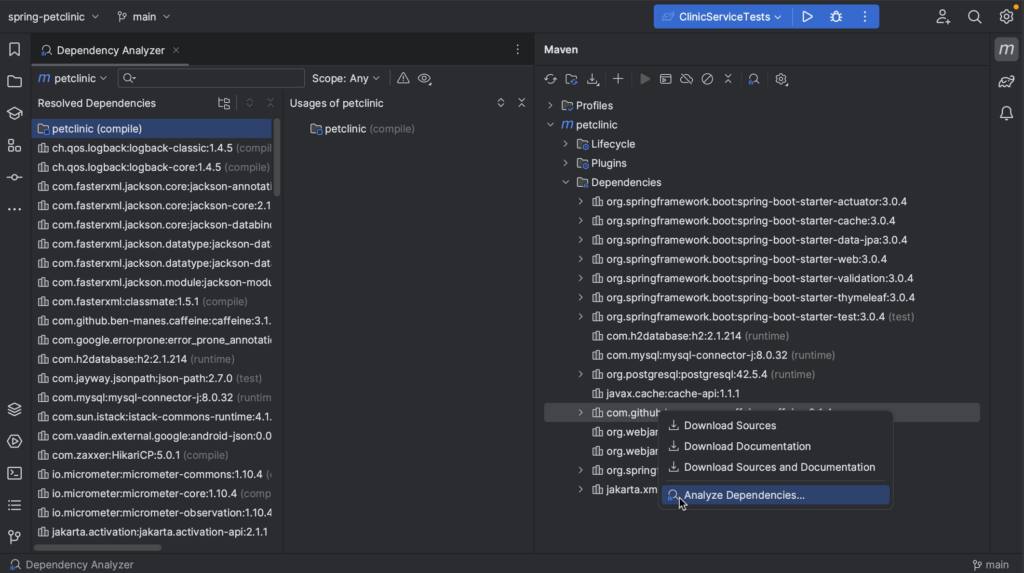
Alternatively, we can right-click a dependency in the Maven or Gradle tool window and select Analyze Dependencies from the context menu. This will open the Dependency Analyzer with the dependency selected.
We can hide all tool windows (⇧⌘F12 on macOS / Control+Shift+F12 on Windows/Linux), so we can focus on the dependencies.
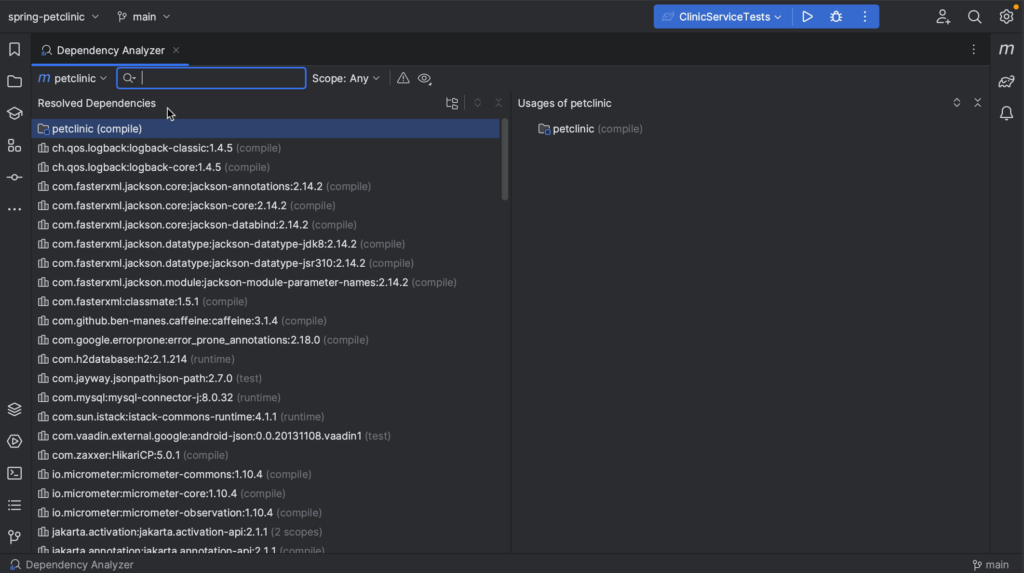
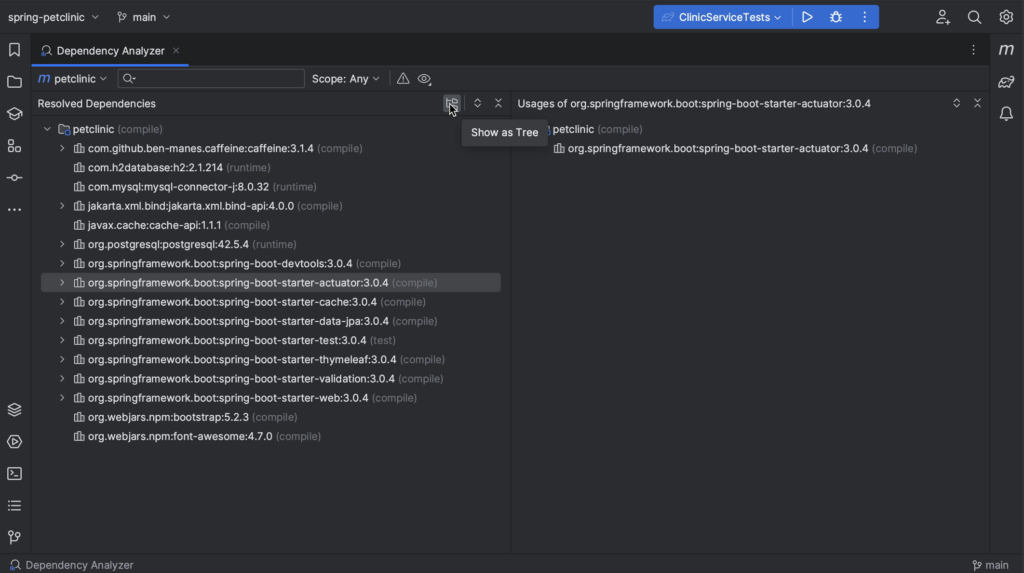
Viewing dependencies in the Dependency Analyzer
We can view the dependencies as a tree by clicking the Show as Tree button and Expand or Collapse them as needed by pressing the corresponding buttons.
We can also click the View Options button and toggle Show GroupId, to show the GroupId for dependencies or not.
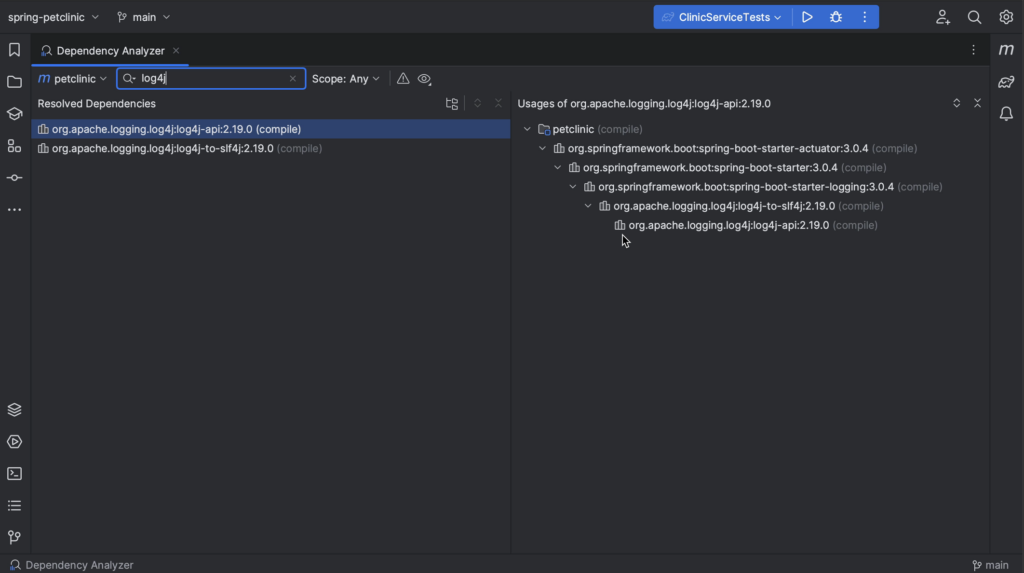
Finding a specific dependency
To see where we are getting a specific version of a particular library, we can search for that dependency. For example, when we search for “log4j” we see that we are only getting it via this spring-boot-starter, and it’s a version newer than the one where log4shell was fixed.
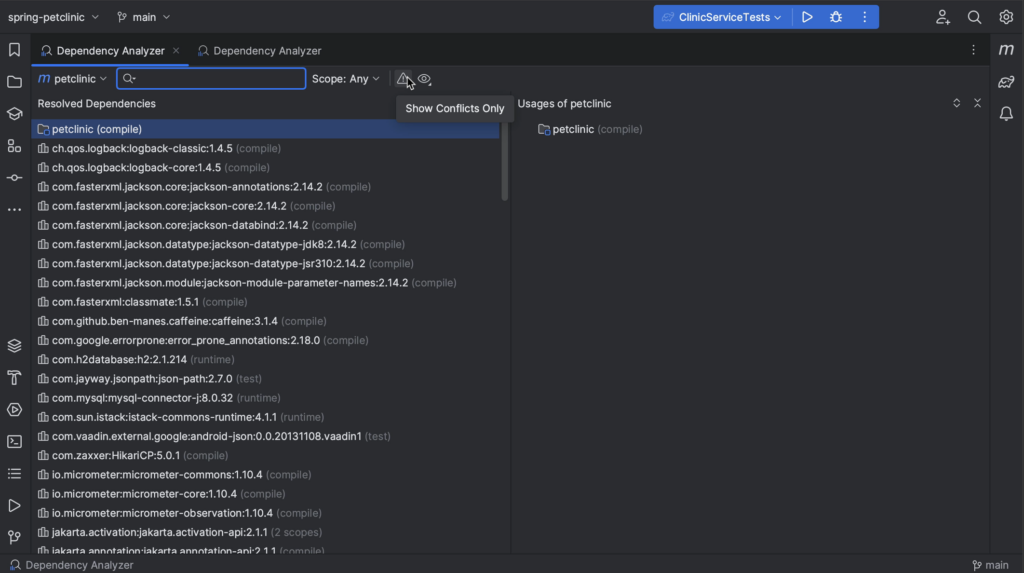
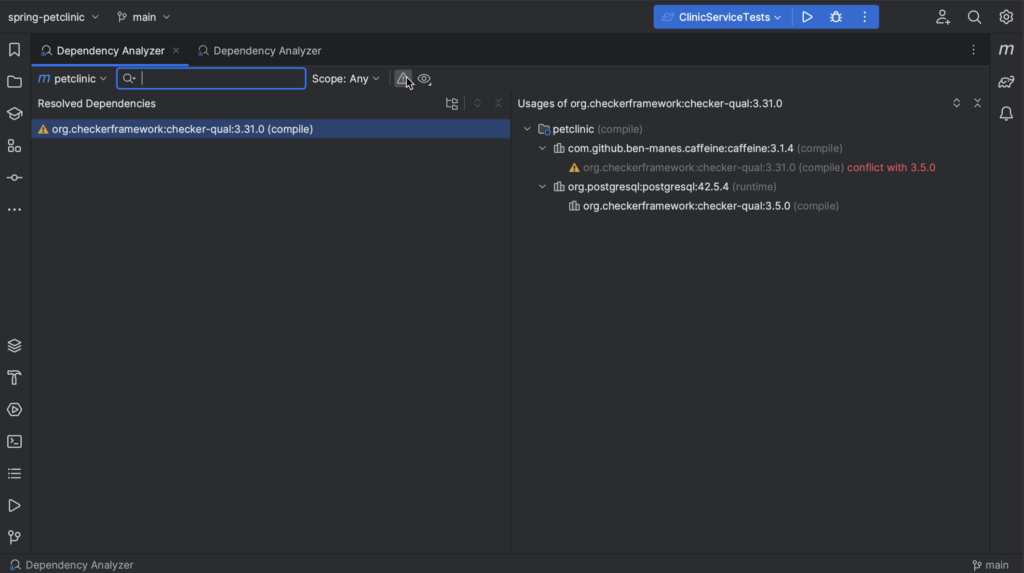
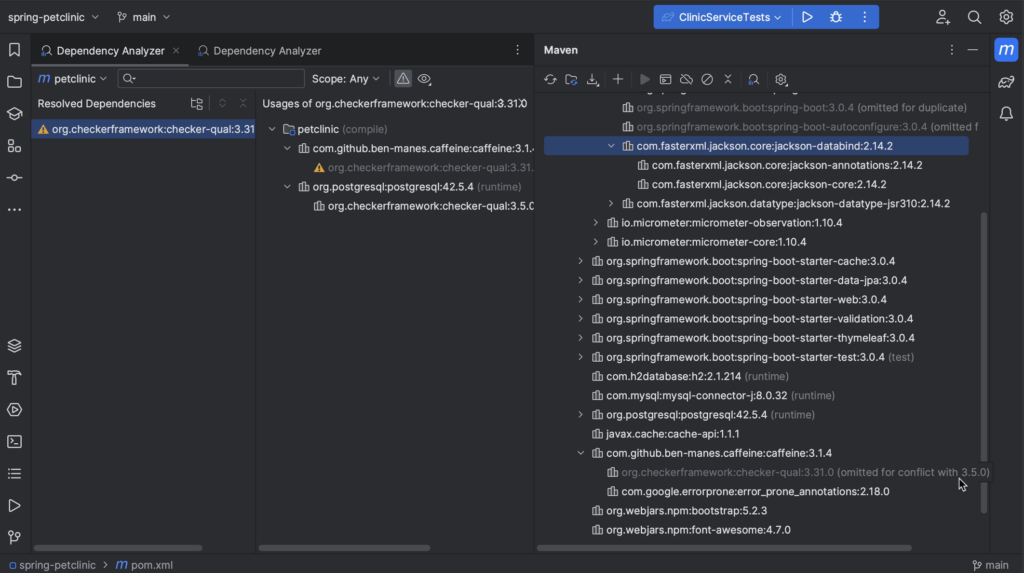
Finding conflicts
We might only want to look at dependencies that have conflicts. When we select the Show Conflicts Only button, we see only dependencies that have conflicts. In this example, we see that there is a conflict with the checker framework dependency. Fortunately, it’s been resolved; we see that one version is greyed out. If we go back to the Maven tool window, we see that this version has been omitted for conflict. We can see that the version we are using is 3.5.0 which we get from postgres.
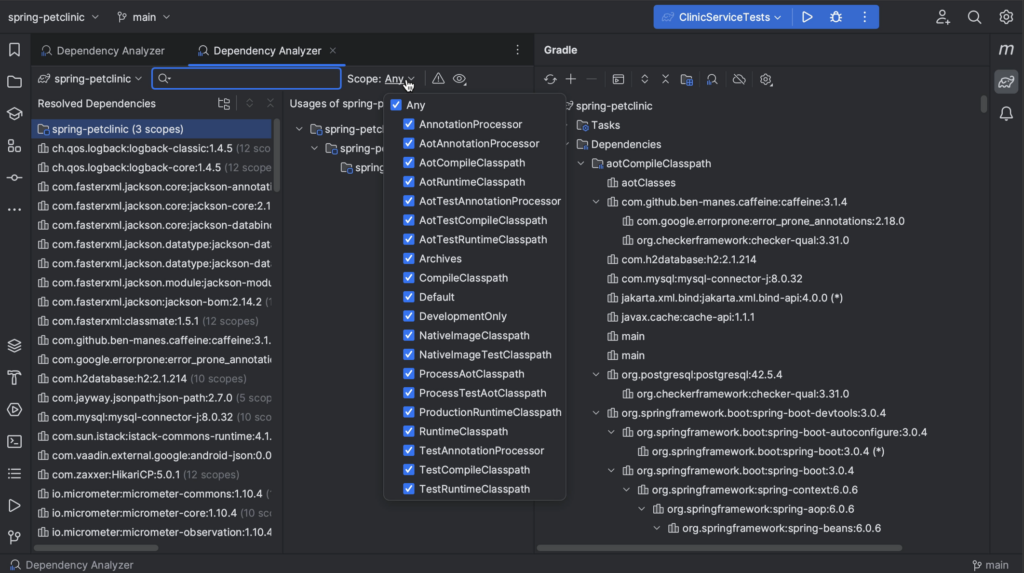
Selecting scopes
We can also select a scope (for example, if we want to look at our test dependencies or exclude them from analysis). Since we’ve opened the Dependency Analyzer from the Maven tool window, we see the Maven scopes.
When we open the Dependency Analyzer from the Gradle tool window, the list of scopes will contain Gradle scopes.
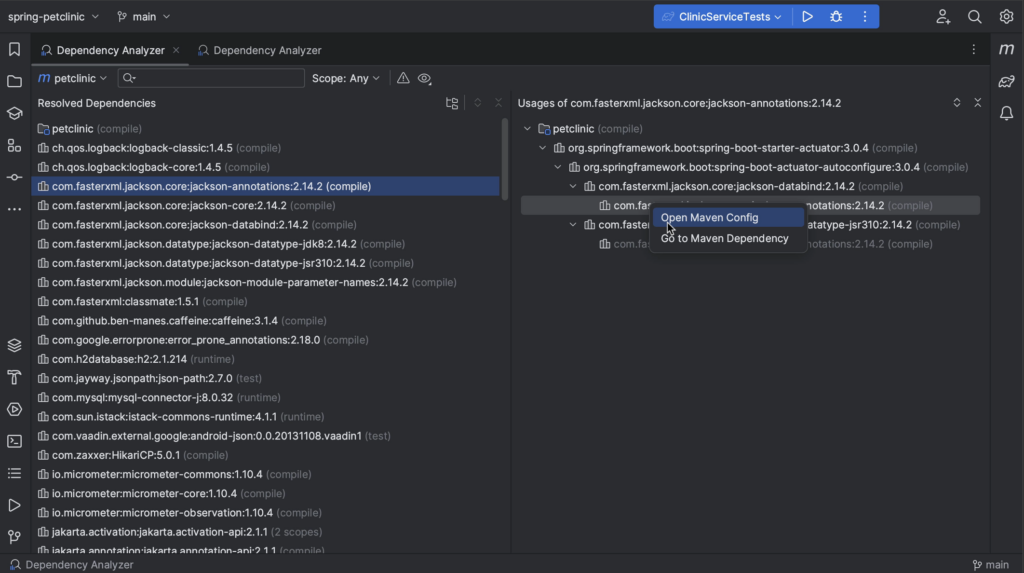
More context
For more context, we can click a specific dependency and select Open Maven Config to open its pom.xml or Go to Maven Dependency to open the location in the pom.xml where this dependency is declared.
Using the Dependency Diagram
If you are using IntelliJ IDEA Ultimate, you can also view your dependencies as a diagram.
Show Diagrams
We can open diagrams either by right-clicking the project in the Project tool window and selecting Diagrams | Show Diagrams, or by using the shortcut ⌥ ⇧ ⌘ U (on macOS) or Ctrl+Alt+Shift+U (on Windows/Linux). You’ll notice this gives you several diagram options to choose from. In this case, we’re interested in the Gradle Dependencies, so we select that one. We can hide all tool windows (⇧⌘F12 on macOS / Control+Shift+F12 on Windows/Linux), so we can focus on the diagram.
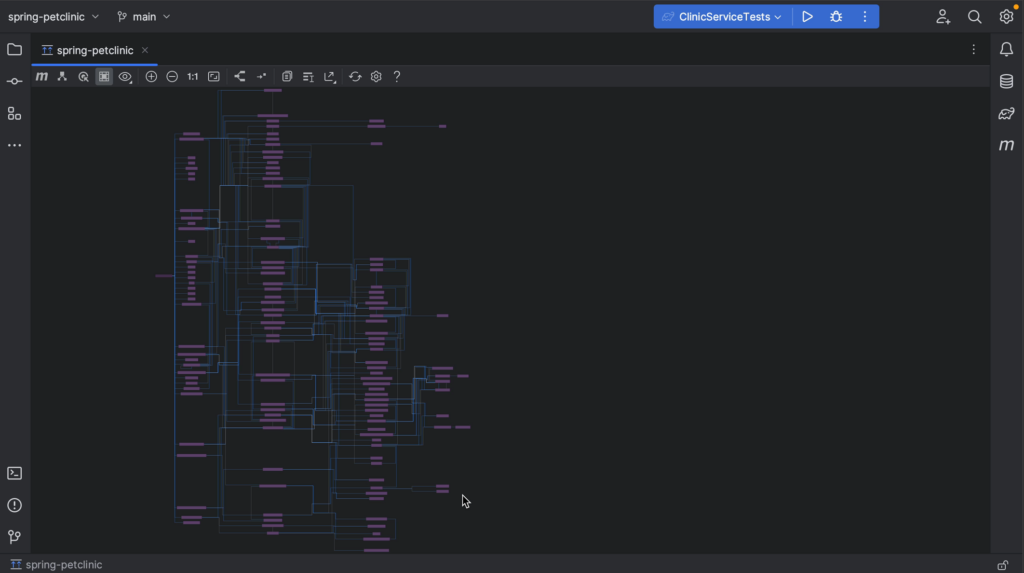
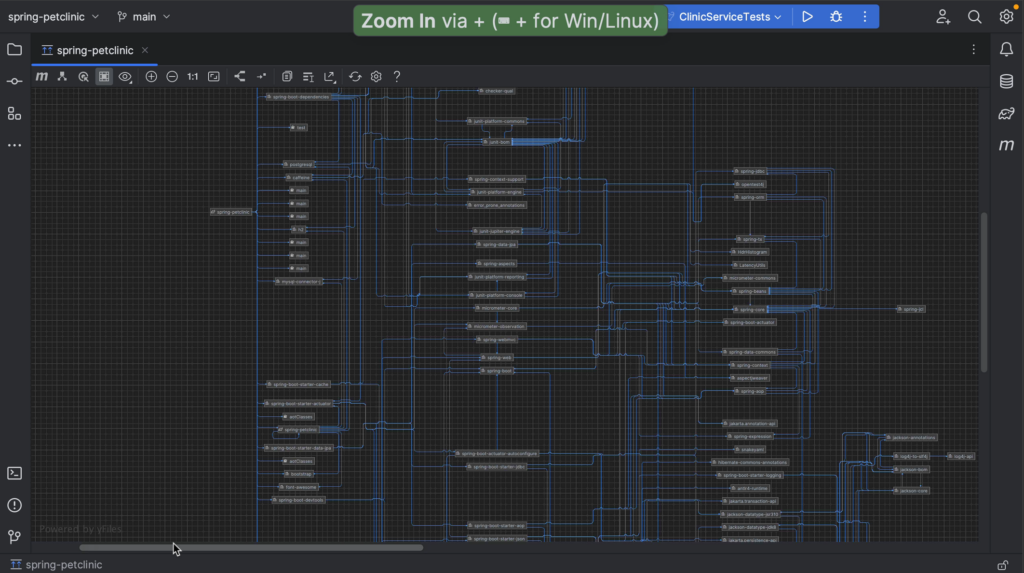
Zoom in
If the project we’re looking at pulls in a lot of transitive dependencies, like this example, the diagram can be quite large. We can zoom in and out using the + and – keys, or the + and – buttons in the diagram window.
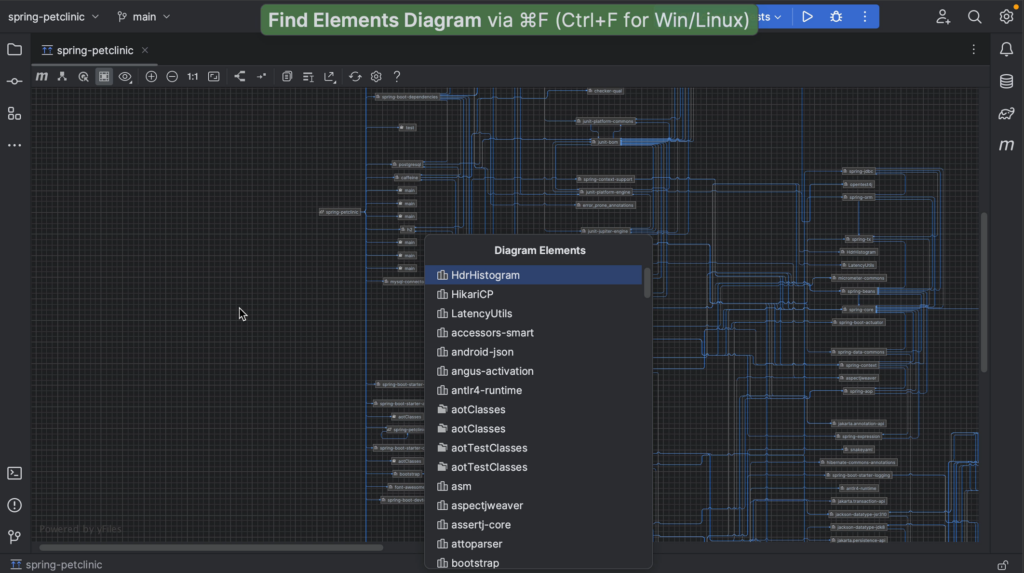
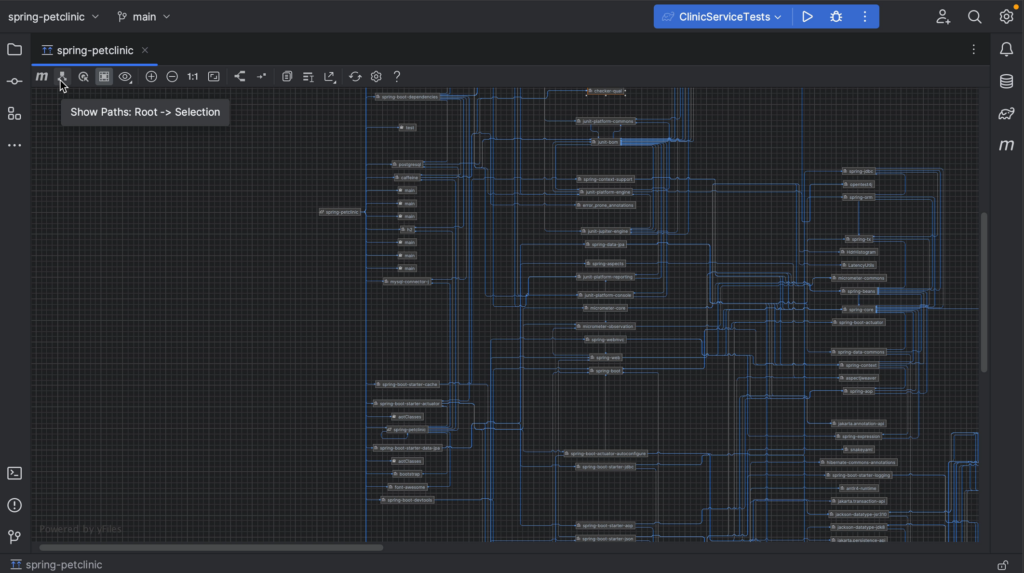
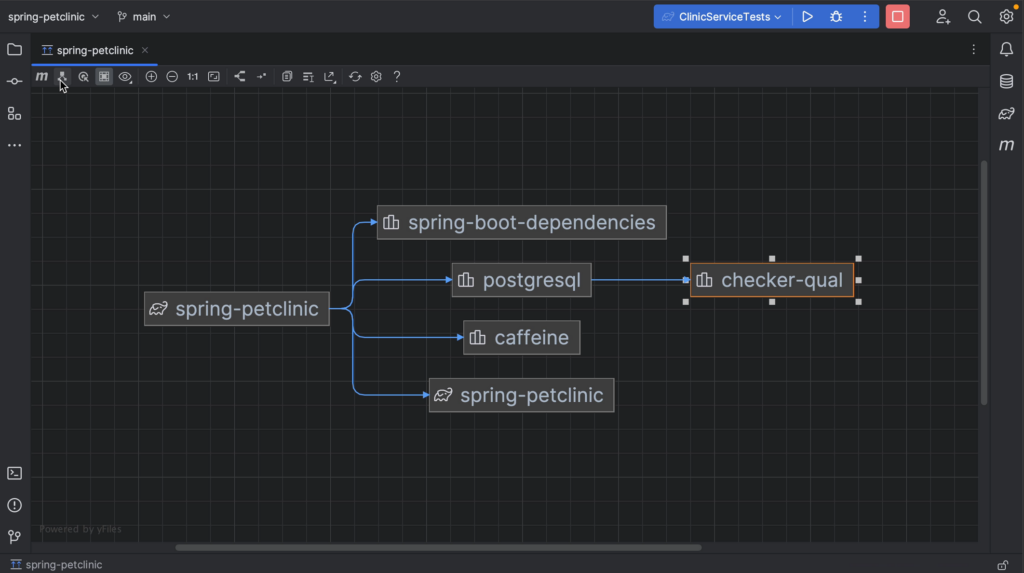
Finding a specific dependency
To look for a specific dependency and see where we get it from, we can search for this dependency using ⌘F (on macOS) or Ctrl+F (on Windows/Linux) to find it in the diagram. Using the button Show Paths: Root -> Selection, we can check the path for this dependency and click related dependencies to follow the path to the root.
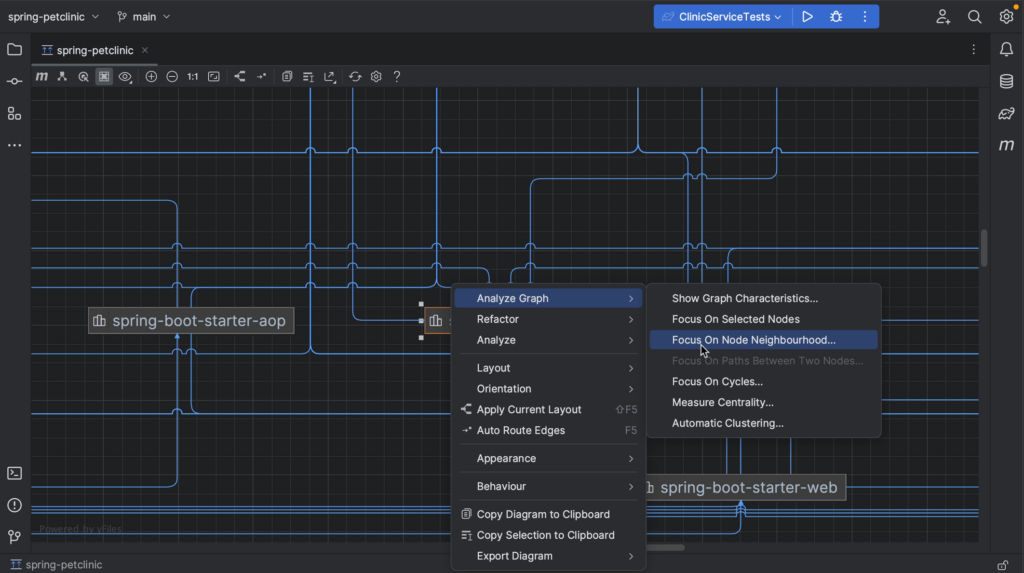
Focus on related nodes
We have other options to look into specific dependencies. For example, we can zoom in on a specific dependency and the related nodes. Right-click the dependency you’re interested in, and from the context menu, select Analyze graph > Focus on Node Neighbourhood. This will give you several options. In this example, we’ll look at both directions. When we are done, we can reopen Analyze graph context menu and select Drop focus.
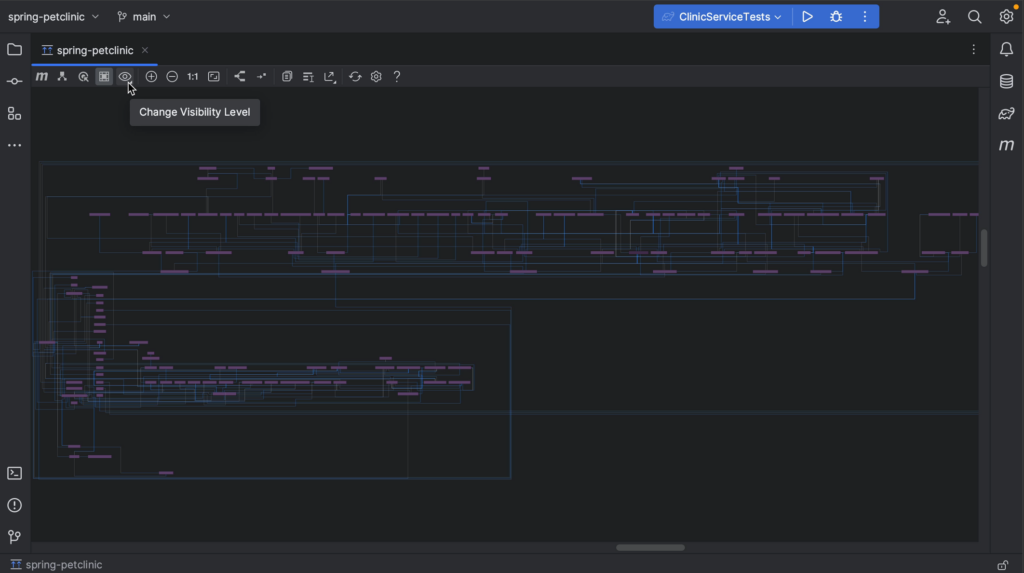
Select scopes
We can change the visibility level, by clicking the Change Visibility Level button for example if we want to focus on compile or runtime dependencies only.
Summary and Shortcuts
Now we know several ways to analyze our project’s dependencies in IntelliJ IDEA.
IntelliJ IDEA Shortcuts Used
Here are the IntelliJ IDEA shortcuts that we used.
If you’re working on a real world project, you’re probably using external dependencies. You might need to analyze which dependencies your application uses. For example, you may want to find out how a particular version of a dependency ended up in your application. Let’s take a look at how IntelliJ IDEA can help you to analyze dependencies.
Any real world Java project will likely use external dependencies. As we’ve seen over the last few years, it’s important to keep these dependencies up to date. We used to have to manually check for updates, but fortunately these days there are tools available that can help us with this. Because, let’s be honest, most developers don’t enjoy maintaining applications. We’d much rather be using cool new tools and/or language features, and solving interesting problems. Sorry, I mean: delivering business value! But we are responsible for keeping our dependencies up to date, so let’s make that as easy as possible. In this blog post we will look at one category of tools that can help us: bots that can automatically create pull requests (PRs) to keep dependencies secure and up to date.
For Java, we currently have three options: Dependabot, Renovate and Snyk Open Source. They each support other programming languages too, but as I mostly use Java and other JVM languages I have limited myself to these. Let’s take a look at which features they provide and their similarities and differences.
Sidenote: In order to try out and compare these bots, I’ve added them one by one to my personal GitHub profile and will describe here how to add them to your GitHub profile, as well as link to information about other integration options.
Dependabot
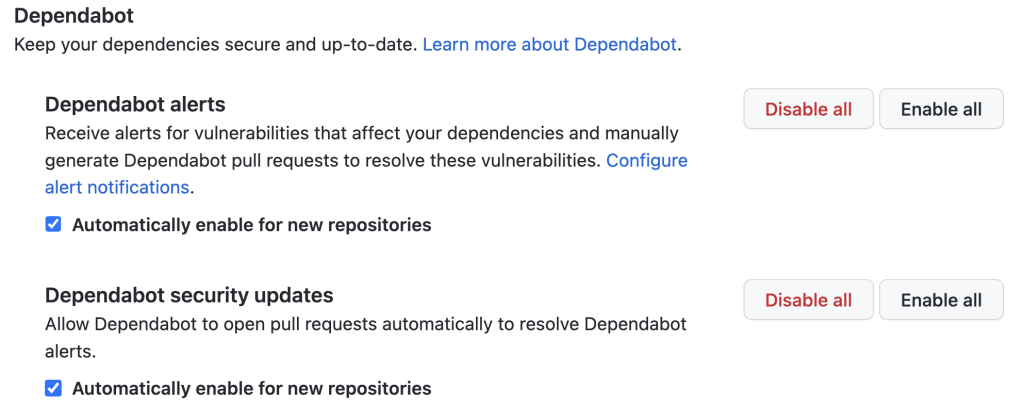
The first bot we will look at is Dependabot. Since Dependabot is GitHub native, we can enable most of its features from the Settings > Security > Code security and analysis. Here we can enable (or disable) the available features, and select which ones we would like to automatically enable for new repositories.
Dependabot settings on GitHub
Features
Dependabot offers the following features: Alerts, security updates and vulnerability updates.
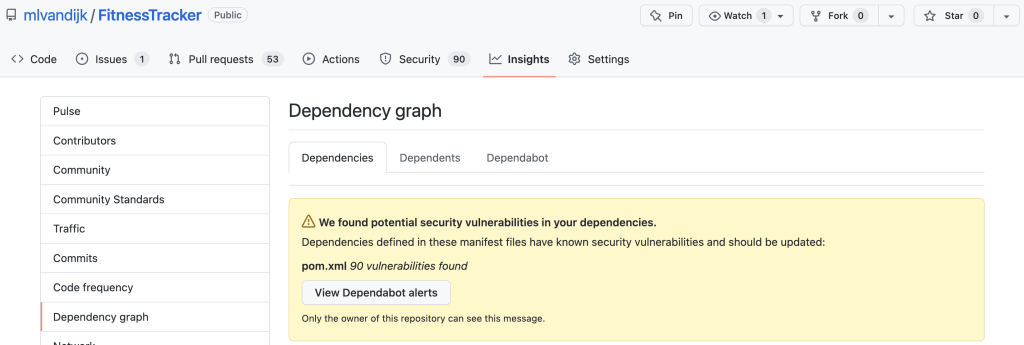
When Dependabot is enabled, it provides a Dependency Graph under the Insights tab of your project. The Dependencies tab shows any alerts to the owner of the repository. The Dependents tab shows any projects that depend on your project. In the Dependabot tab version updates can be configured.
When we enable Dependabot alerts, we will receive alerts for vulnerabilities in our repositories and we can manually generate pull requests (PRs) to resolve them. We can configure how we would like to receive these alerts. We can also view them in the Dependency Graph in the Dependencies tab.
Dependabot Dependencies graph
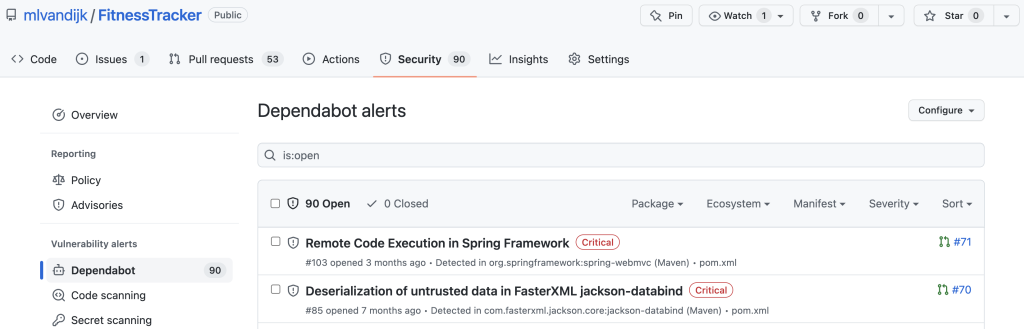
We can click the button to View Dependabot alerts to see more information about the alerts.
Dependabot alerts
Pull requests
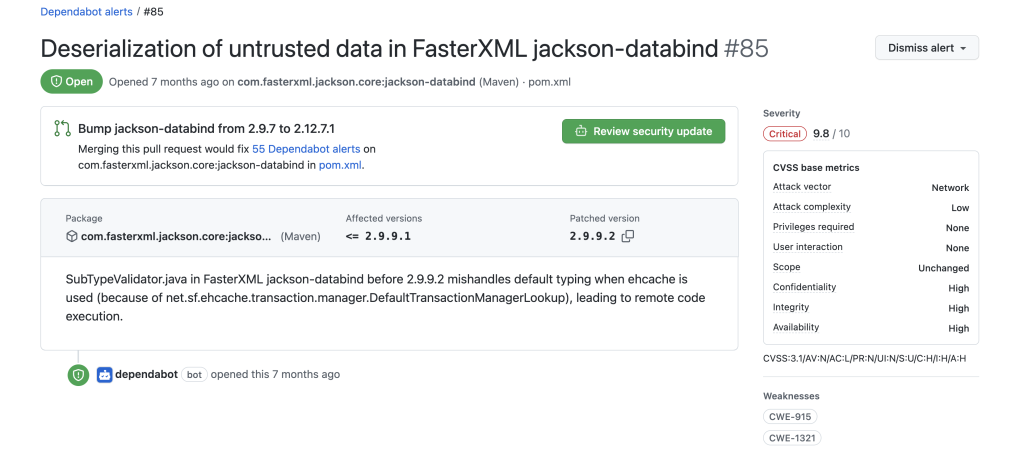
When we enable Dependabot security updates, Dependabot will open pull requests (PRs) automatically to resolve vulnerabilities. These PRs provide information about the severity of the vulnerability, CVSS base metrics, and CVEs. We can hover over the CVSS base metrics and CVEs to get more information. We can review the changes, or dismiss the alert.
Dependabot security update
To enable version updates, you need to add a dependabot.yml file to your repository.
Configuration
In this configuration file, you need to provide the package manager, the directory that contains your manifest file and a scheduling interval (daily, weekly, or monthly). You can configure more options, like when it should be scheduled (date, time, timezone), the maximum number of PRs (the default is 5), rebase strategy, settings that can help you manage the PRs like target branch, assignees, reviewers, commit messages and labels, and more. For more information on configuration options, see the Dependabot documentation on configuration.
Like Dependabot, Renovate offers security updates and version updates. In addition, Renovate will also create a project dashboard listing all updates needed on a particular project.
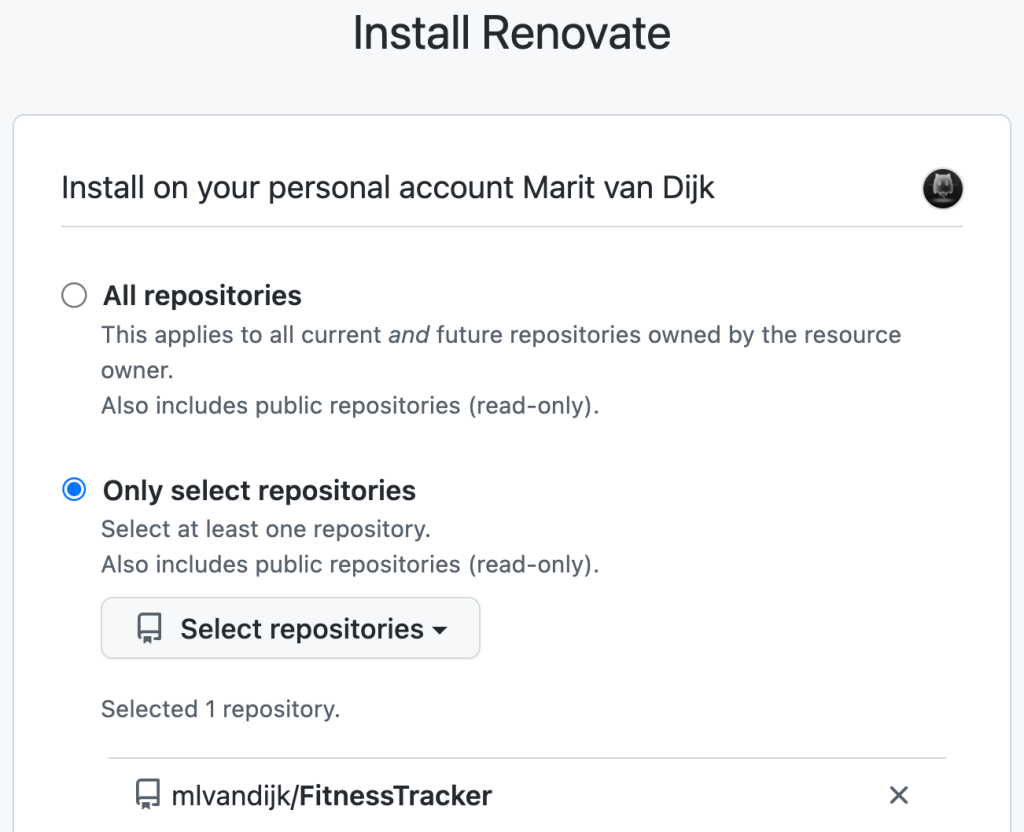
Renovate is available on GitHub via a GitHub app. To configure Renovate for your GitHub account, go to https://github.com/apps/renovate. Renovate allows you to set Repository access to either All repositories or Only select repositories. Renovate is the only one of these three options that allows you to try it out on only one repository first, so if you’ve never used one of these bots, I’d recommend starting with Renovate on one repository.
Install Renovate
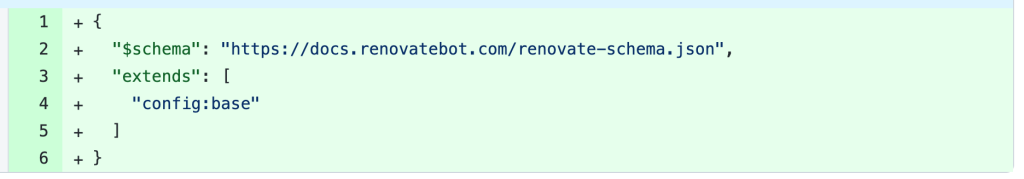
Renovate will create an onboarding pull request to the selected repositories. The onboarding PR contains basic configuration for Renovate to run. It describes the configuration in a Configuration Summary, and provides some information about What to Expect when the PR is merged (in this example, a list of PRs that will be opened).
Renovate Onboarding PRRenovate What to ExpectRenovate basic configuration
Note: These screenshots were taken from the PR created in September 2022. It may have changed since then.
Configuration
Renovate offers additional configuration options. In addition to setting a maximum number of PRs, Renovate allows you to to set a maximum number of concurrent branches or even an hourly limit, which can help to keep the number of open PRs and branches manageable. Renovate also lets you configure when to rebase (or not), and settings to help you manage the PRs assignees, reviewers, commit messages, labels, and more. Overall, Renovate offers more configuration options, and these options are more fine-grained than Dependabot’s options.
Once the onboarding PR is merged and the configuration file is added to your repository, Renovate will start opening pull requests with updates on the selected repositories.
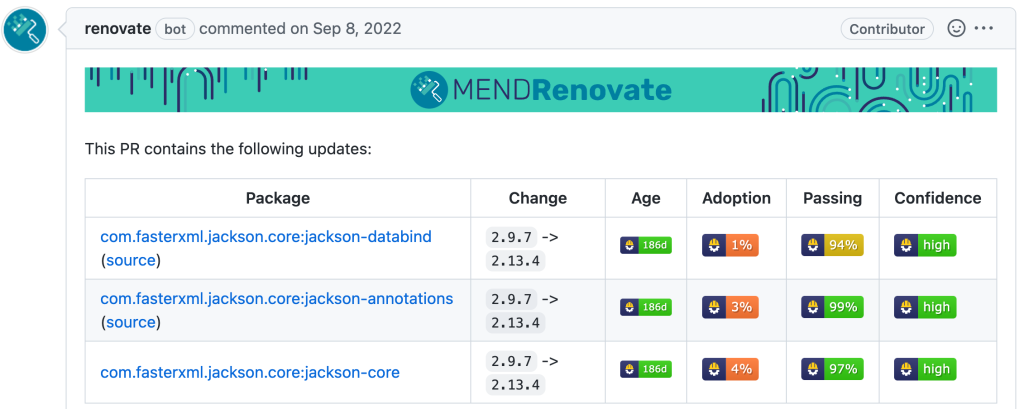
Renovate pull request
Pull requests
These PRs contain information about the reason a PR was created including which package was updated, the current and new version, as well as the following information to help you decide whether or not to merge the PR and apply the update (apart from your build being green).
Age: The age of the package
Adoption: The percentage of this package’s users (within Renovate) which are using this release
Passing: The percentage of updates which have passing tests for this package
In addition, Renovate offers the option for rule based auto merging of PRs; a feature that lets you automate upgrading dependencies. When auto merging is enabled, Renovate tries to merge the proposed update once the tests pass. Renovate recommends that you enable auto merge only for any type of dependency updates which you would just merge anyway, and keeping auto merge disabled for updates where you want to review the release notes and/or code before merging. Of course, great test coverage is also very helpful here! Renovate is currently the only of these three options that offers this feature.
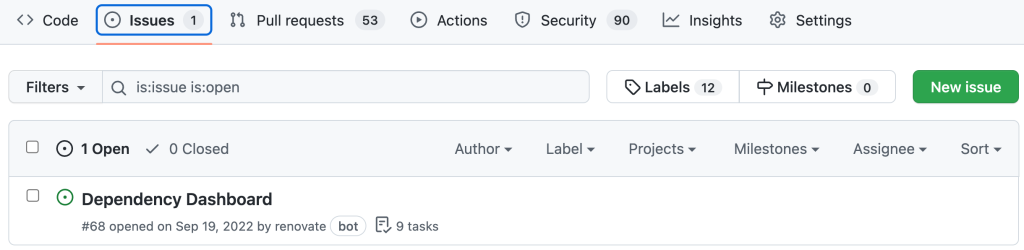
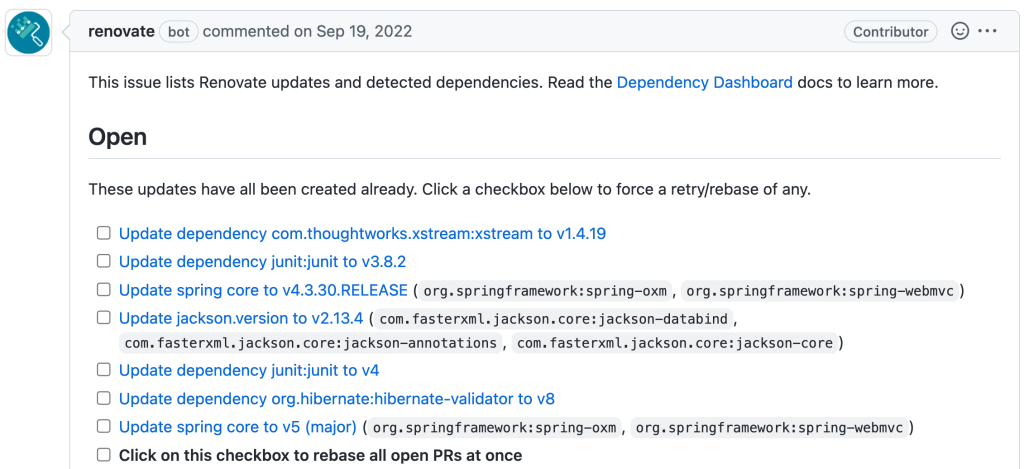
Dashboards
Finally, Renovate will add a Dependency Dashboard to your project, listing all Renovate updates and detected dependencies. This dashboard can be enabled or disabled as desired.
In addition, Renovate provides a general dashboard with all projects & jobs run, which you can find under https://app.renovatebot.com/dashboard if you have Renovate enabled.
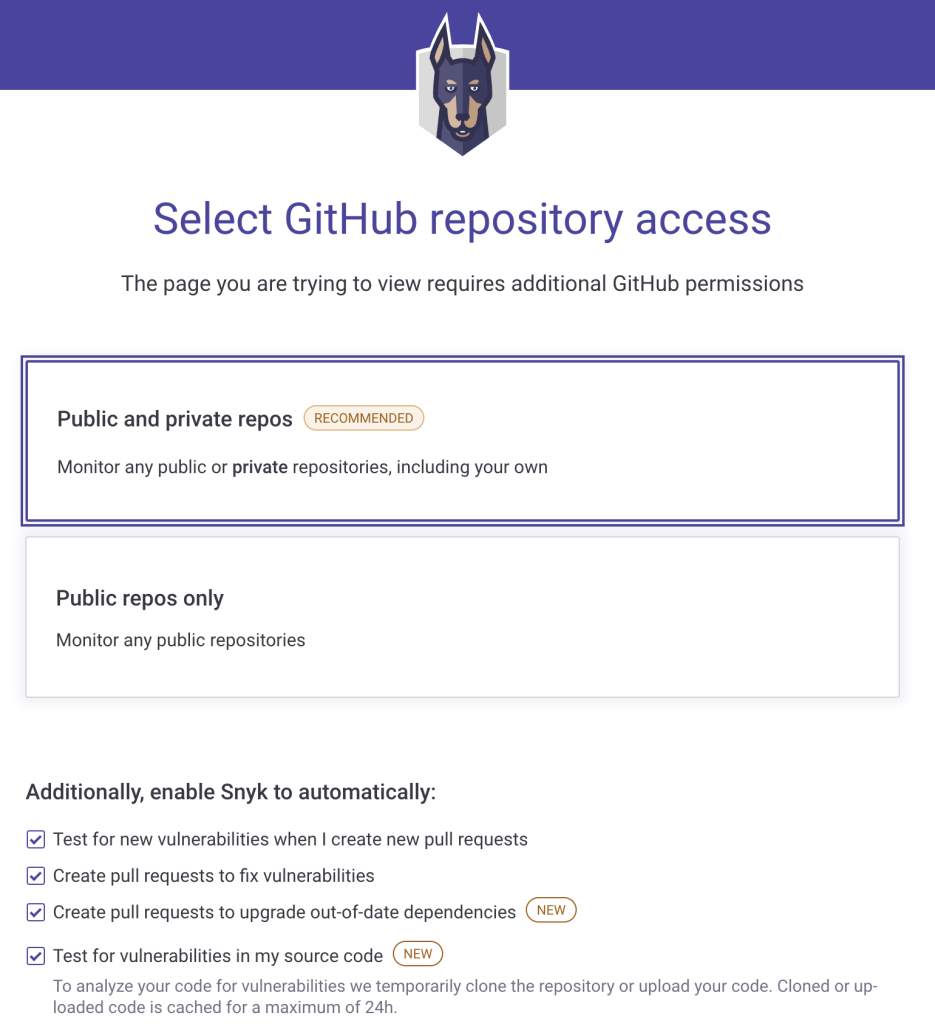
Snyk Open Source is available from Snyk. There are more steps to enable it for your GitHub Profile, but it also offers more features. To enable Snyk Open Source, go to https://snyk.io/product/open-source-security-management/ and select Start free. You will need to Authorize snyk on your GitHub profile, select repository access (either Public and private repos or Public repos only), select other available features you want to use, and provide a Personal access token on GitHub.
Snyk Open Source Start free
Features
In addition to security updates, version updates, and dashboards, Snyk Open Source offers to test for new vulnerabilities and/or test for vulnerabilities in source code. These options are currently not offered by Dependabot or Renovate. As this blog post focussed on tools to help you detect possible vulnerabilities in your dependencies and automatically create PRs to upgrade them, we will not look at scanning the source code for vulnerabilities here.
Snyk Open Source GitHub repository access and additional features
Pull requests
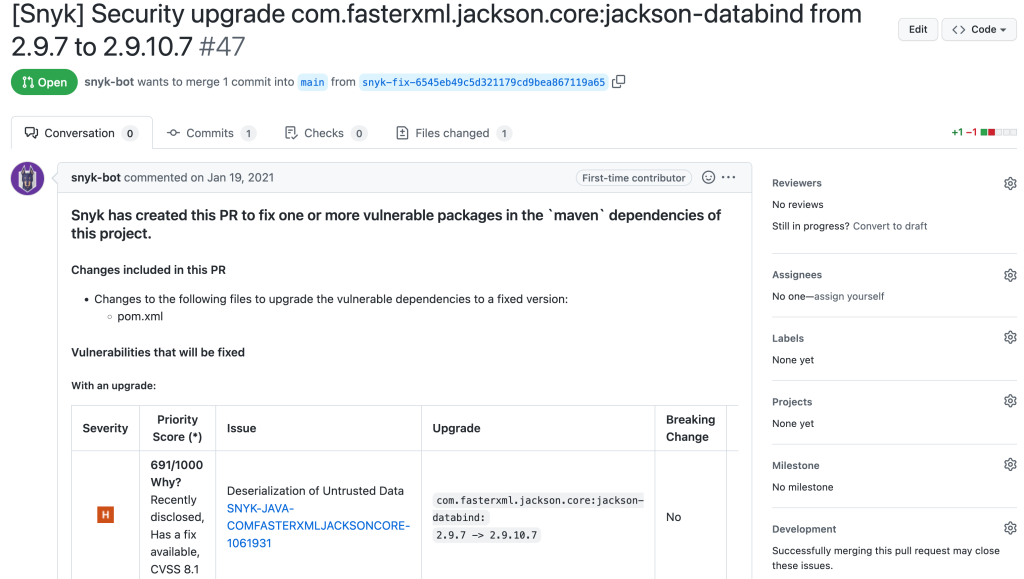
When enabled, Snyk Open Source will open PRs on the selected repositories. These PRs also include information about the reason for the PR, severity of a vulnerability, priority score and why it has this score, details of the version upgrade (current and new version), and more.
Snyk Open Source pull request
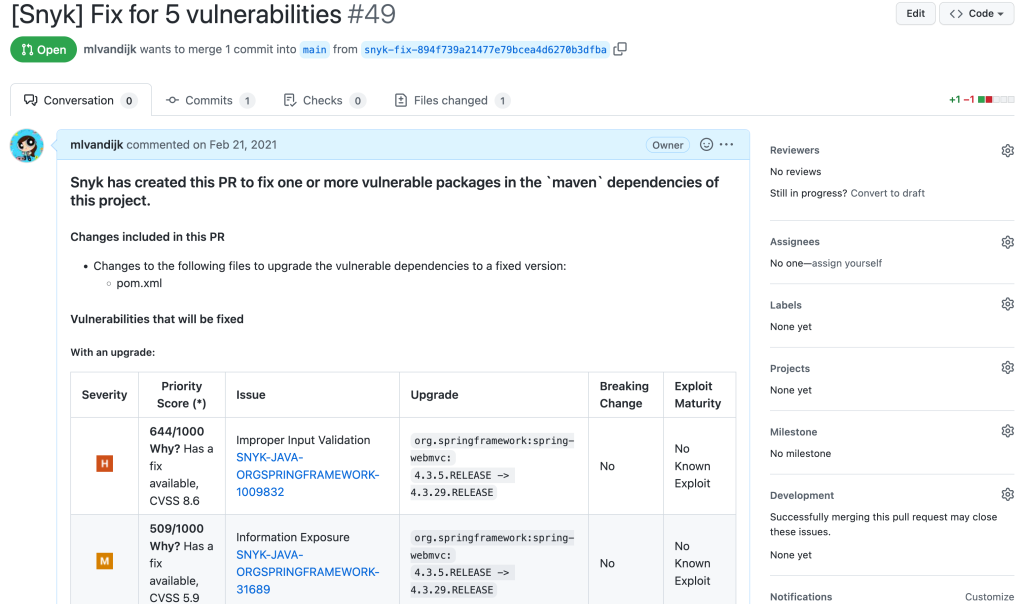
By default, Snyk Open Source will combine related updates into one single PR to help reduce the noise. Dependabot does not currently offer this option, while Renovate can be configured to do something similar.
Snyk Open Source combined PR
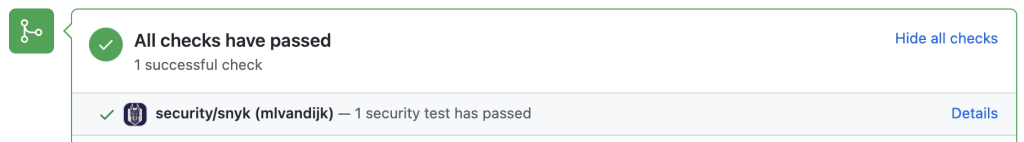
Snyk Open Source also has the option to test for new vulnerabilities. When enabled, incoming PRs will be checked for known vulnerabilities to make sure that no known vulnerabilities are added to the code base. Dependabot and Renovate do not currently offer this feature.
Snyk Open Source security test on PRs
Configuration
We can configure the frequency with which Snyk Open Source should run (daily, weekly, never). We can enable or disable scanning for new and/or known vulnerabilities, so we can clear our backlog of known vulnerabilities separately from making sure we don’t get any new vulnerabilities. This might help getting started with updating outdated dependencies without getting overwhelmed with too many updates. Dependabot and Renovate do not currently offer this option. Finally, we can also enable or disable PRs for a single project, so we can start using Snyk Open Source on a single project like we can with Renovate, but this is not a default option.
Dashboards
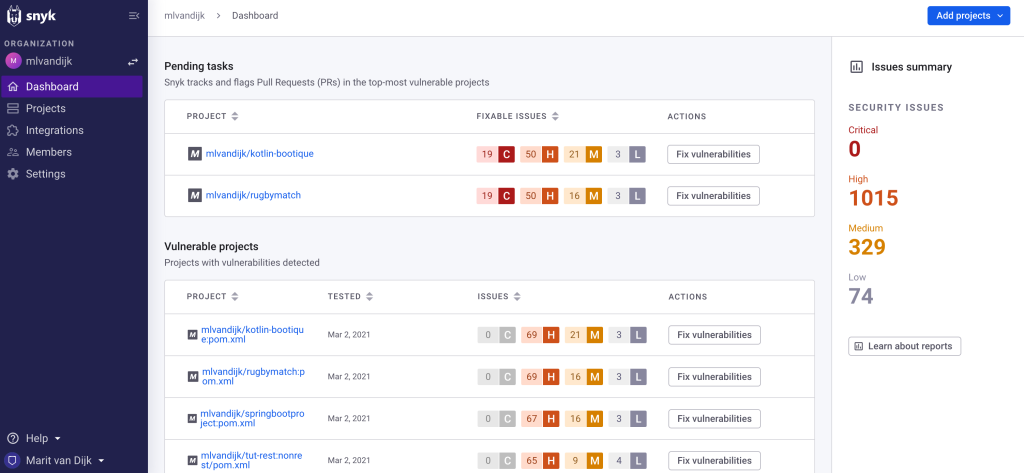
The dashboards offered by Snyk Open Source are the most extensive of these three options. The dashboards provide an overview of known vulnerabilities found in your repositories with the number of vulnerabilities and their severity visible per project and overall.
Snyk Open Source Dashboard
Integration
You can use Snyk Open Source in the Snyk Web UI, with the Snyk CLI, in your IDE, or with an API. For more information, see the Snyk Open Source documentation.
Conclusion
As we have seen, the different bots offer different features. All of the options discussed here can automatically open pull requests for vulnerable dependencies and version upgrades. The information they provide with these PRs differs, as do the number and type of configuration options. Which bot is right for you will depend on needs and preferences.
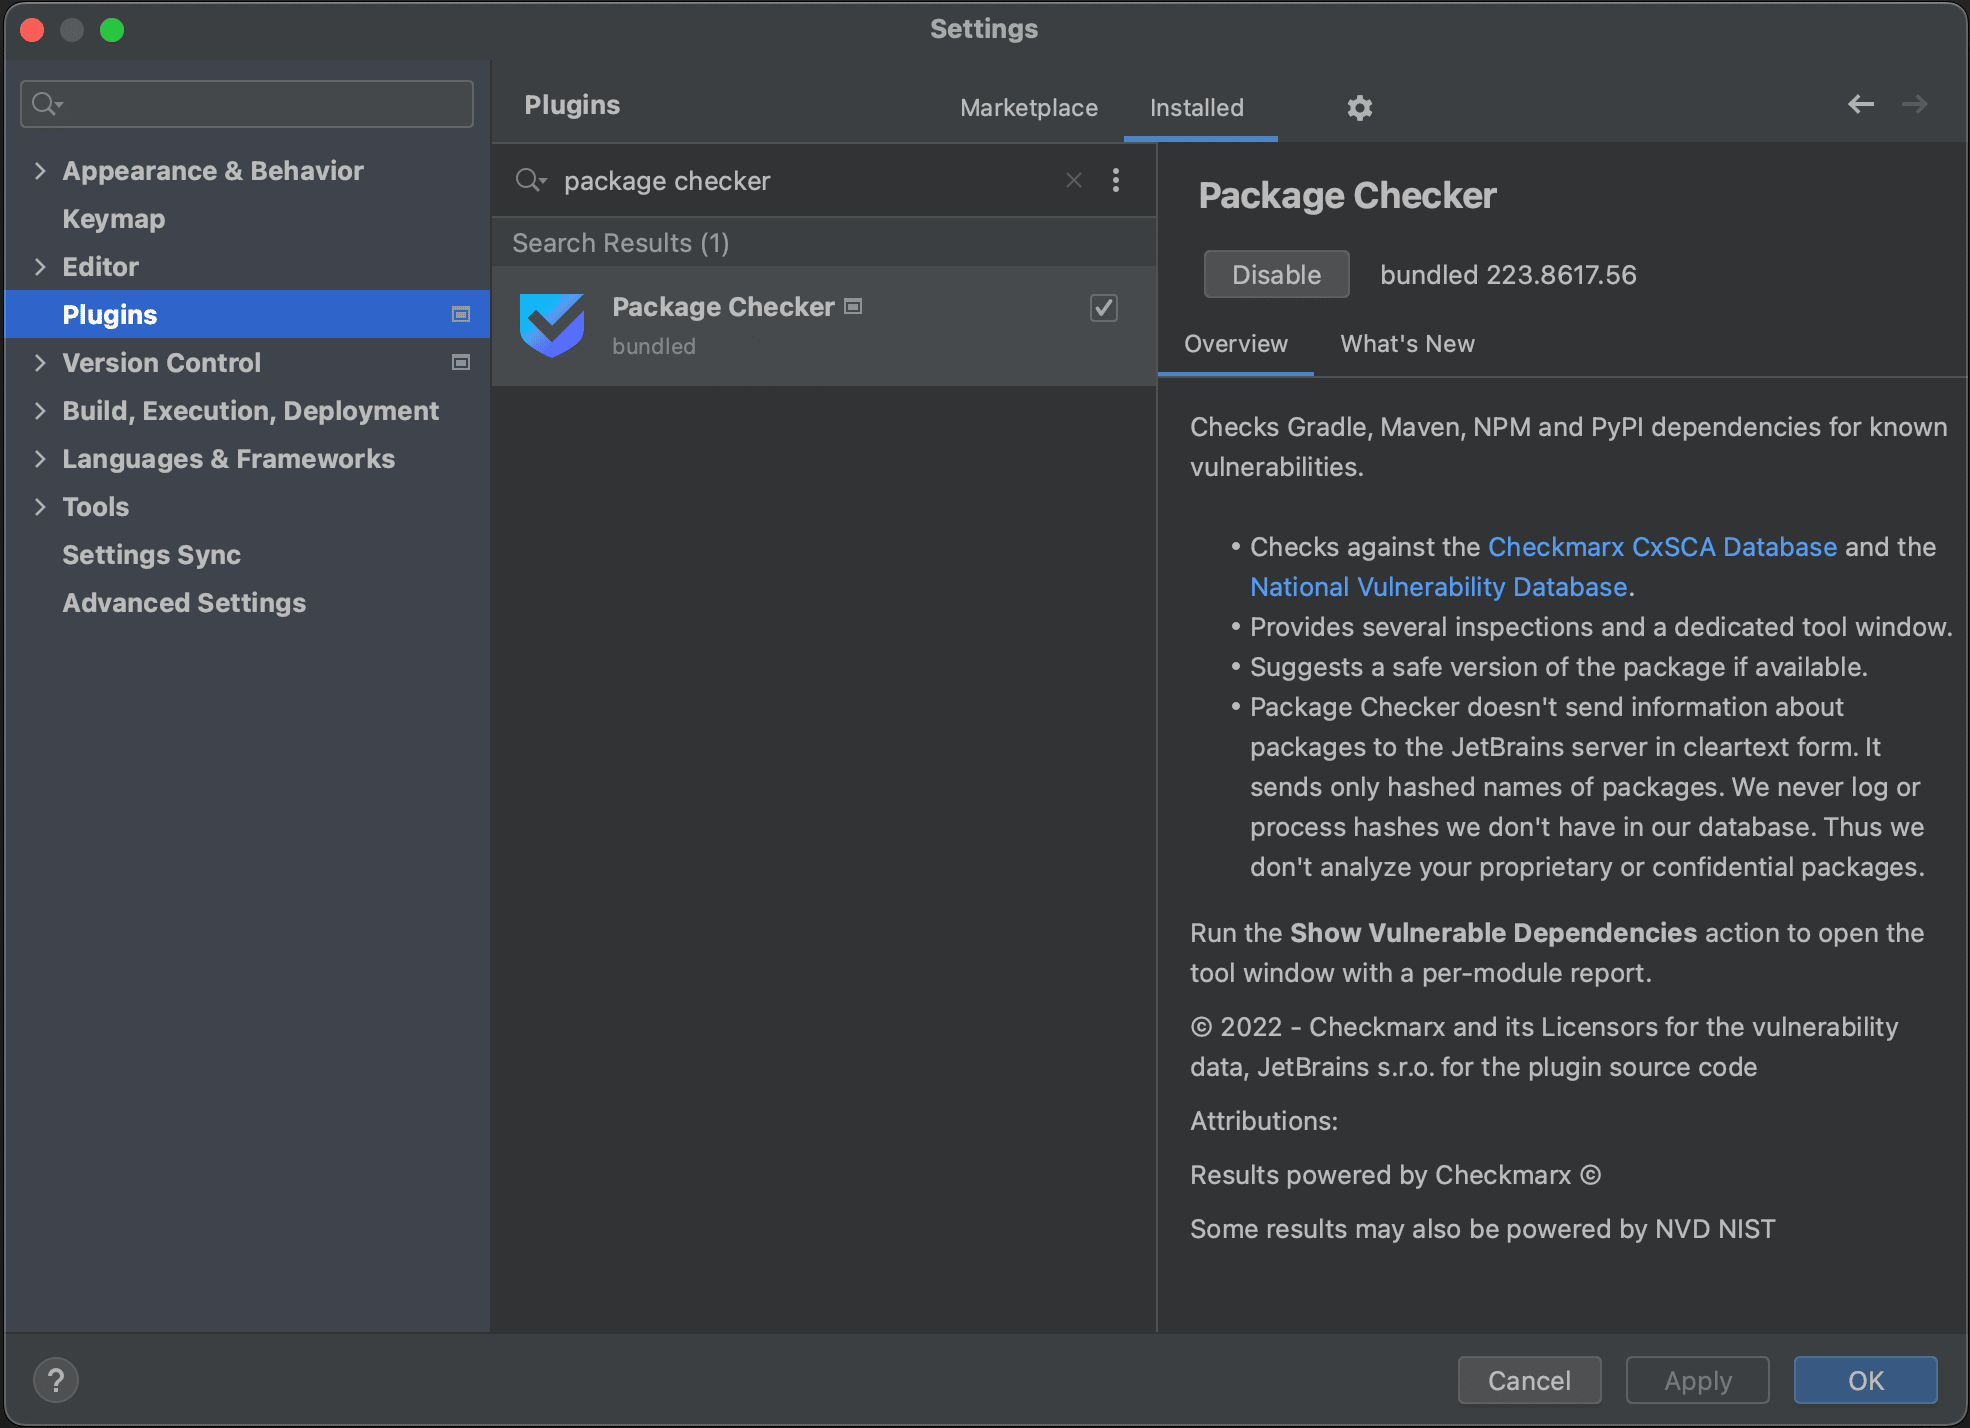
In this blogpost, we’re going to take a look at the Package Checker plugin, that’s bundled with IntelliJ IDEA Ultimate. We’ll have a look at how to view known vulnerabilities in your Maven or Gradle projects, how to get more information about the known vulnerabilities in a specific dependency and how to remediate these vulnerabilities inside IntelliJ IDEA Ultimate if a new version with a fix is available.
Package Checker plugin
There are several ways to view known vulnerabilities for the dependencies to your project.
View vulnerable dependencies in Maven projects
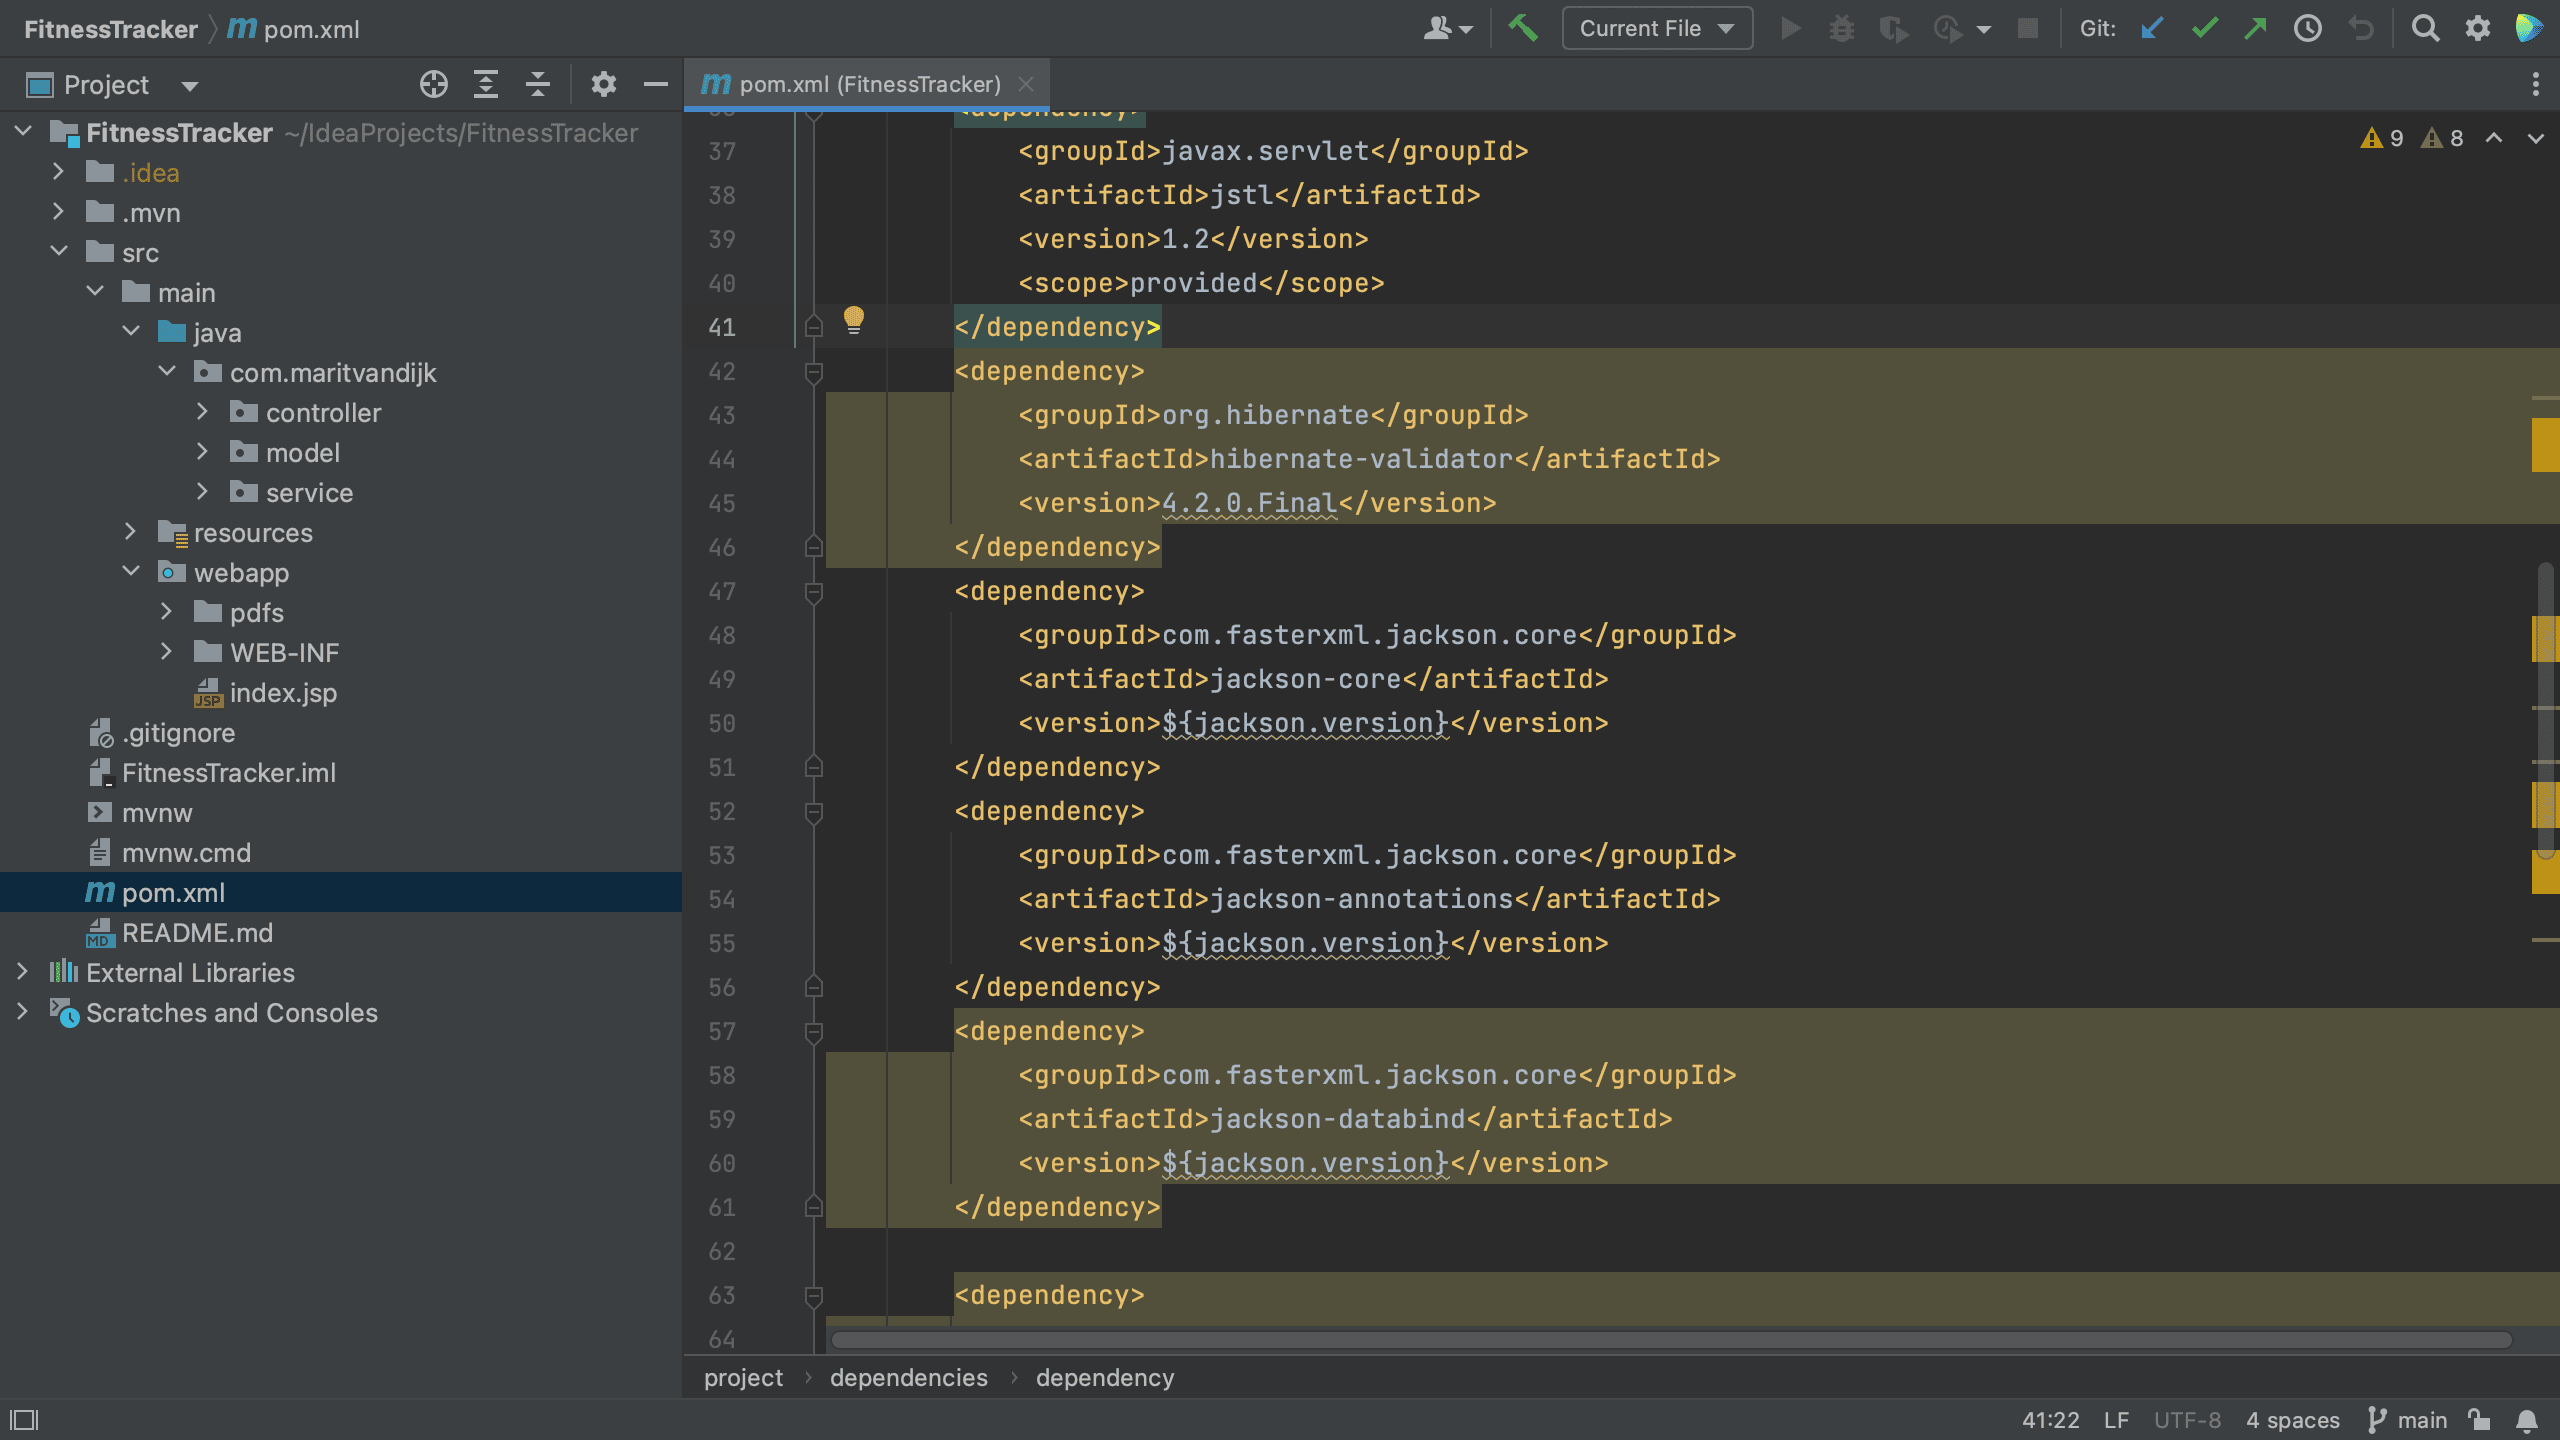
In a Maven project, all of your project’s dependencies are declared in the pom.xml. When we open the pom.xml file for a project which contains vulnerable dependencies, we see that several dependencies are highlighted.
Maven pom.xml with vulnerable dependencies highlighted
The Package Checker plugin highlights vulnerable dependencies and when we hover over the highlighted dependency, IntelliJ IDEA Ultimate shows all the vulnerabilities that were identified in this particular dependency. When we click on link for the CVE for a particular vulnerability, we’re redirected to the Checkmarx Advisory to learn more about this specific vulnerability.
Maven pom.xml with hover
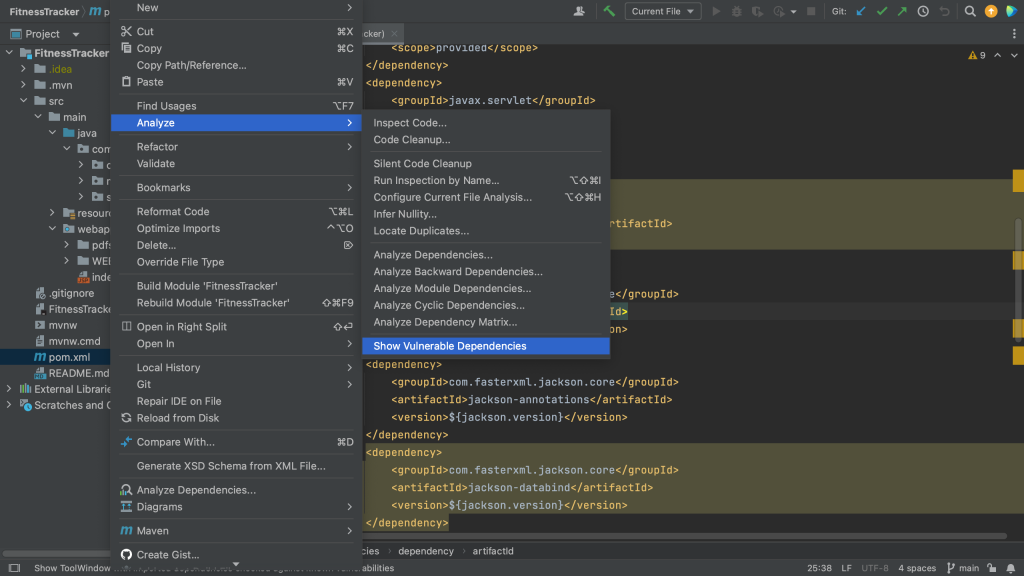
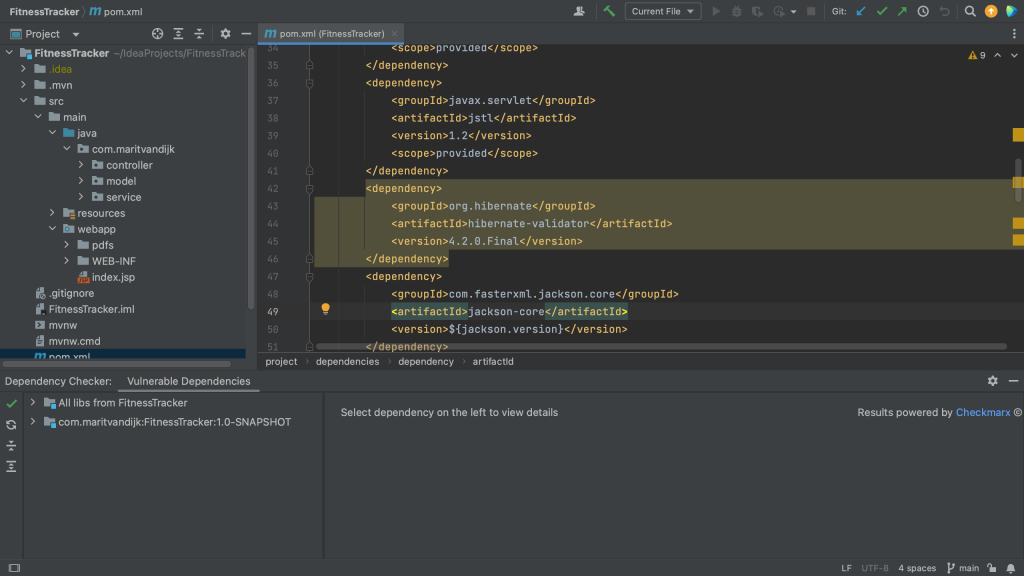
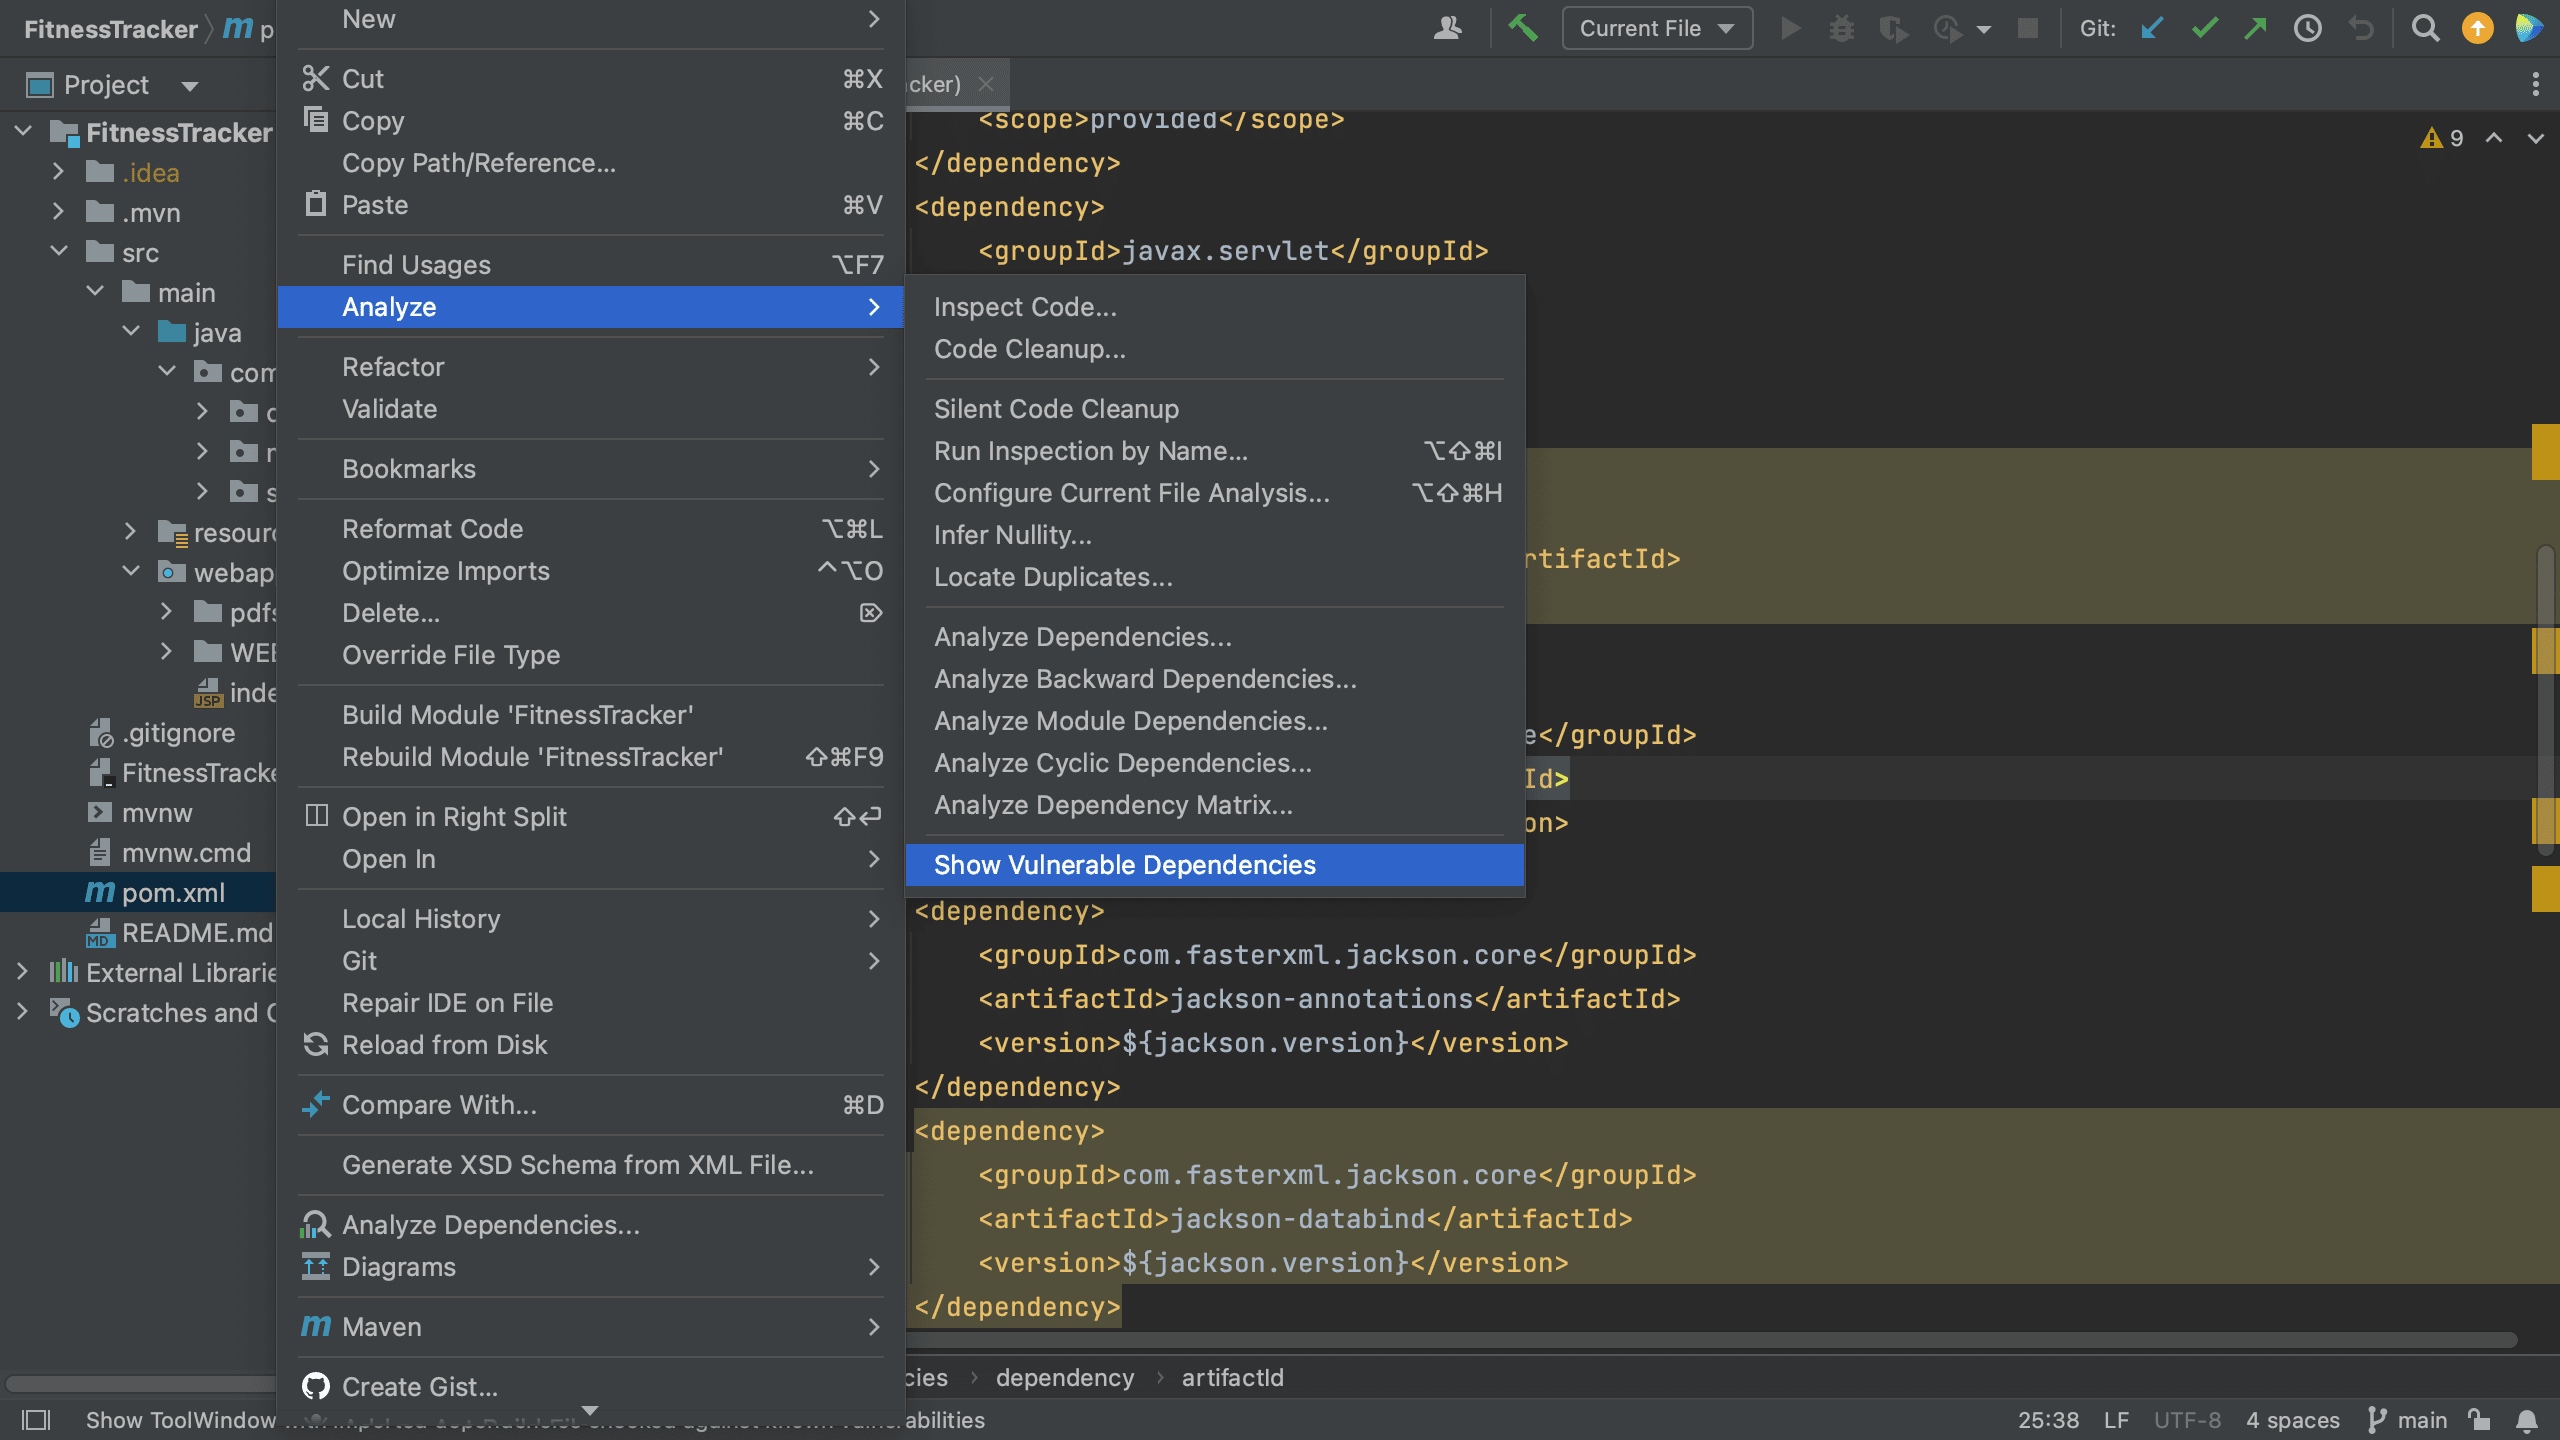
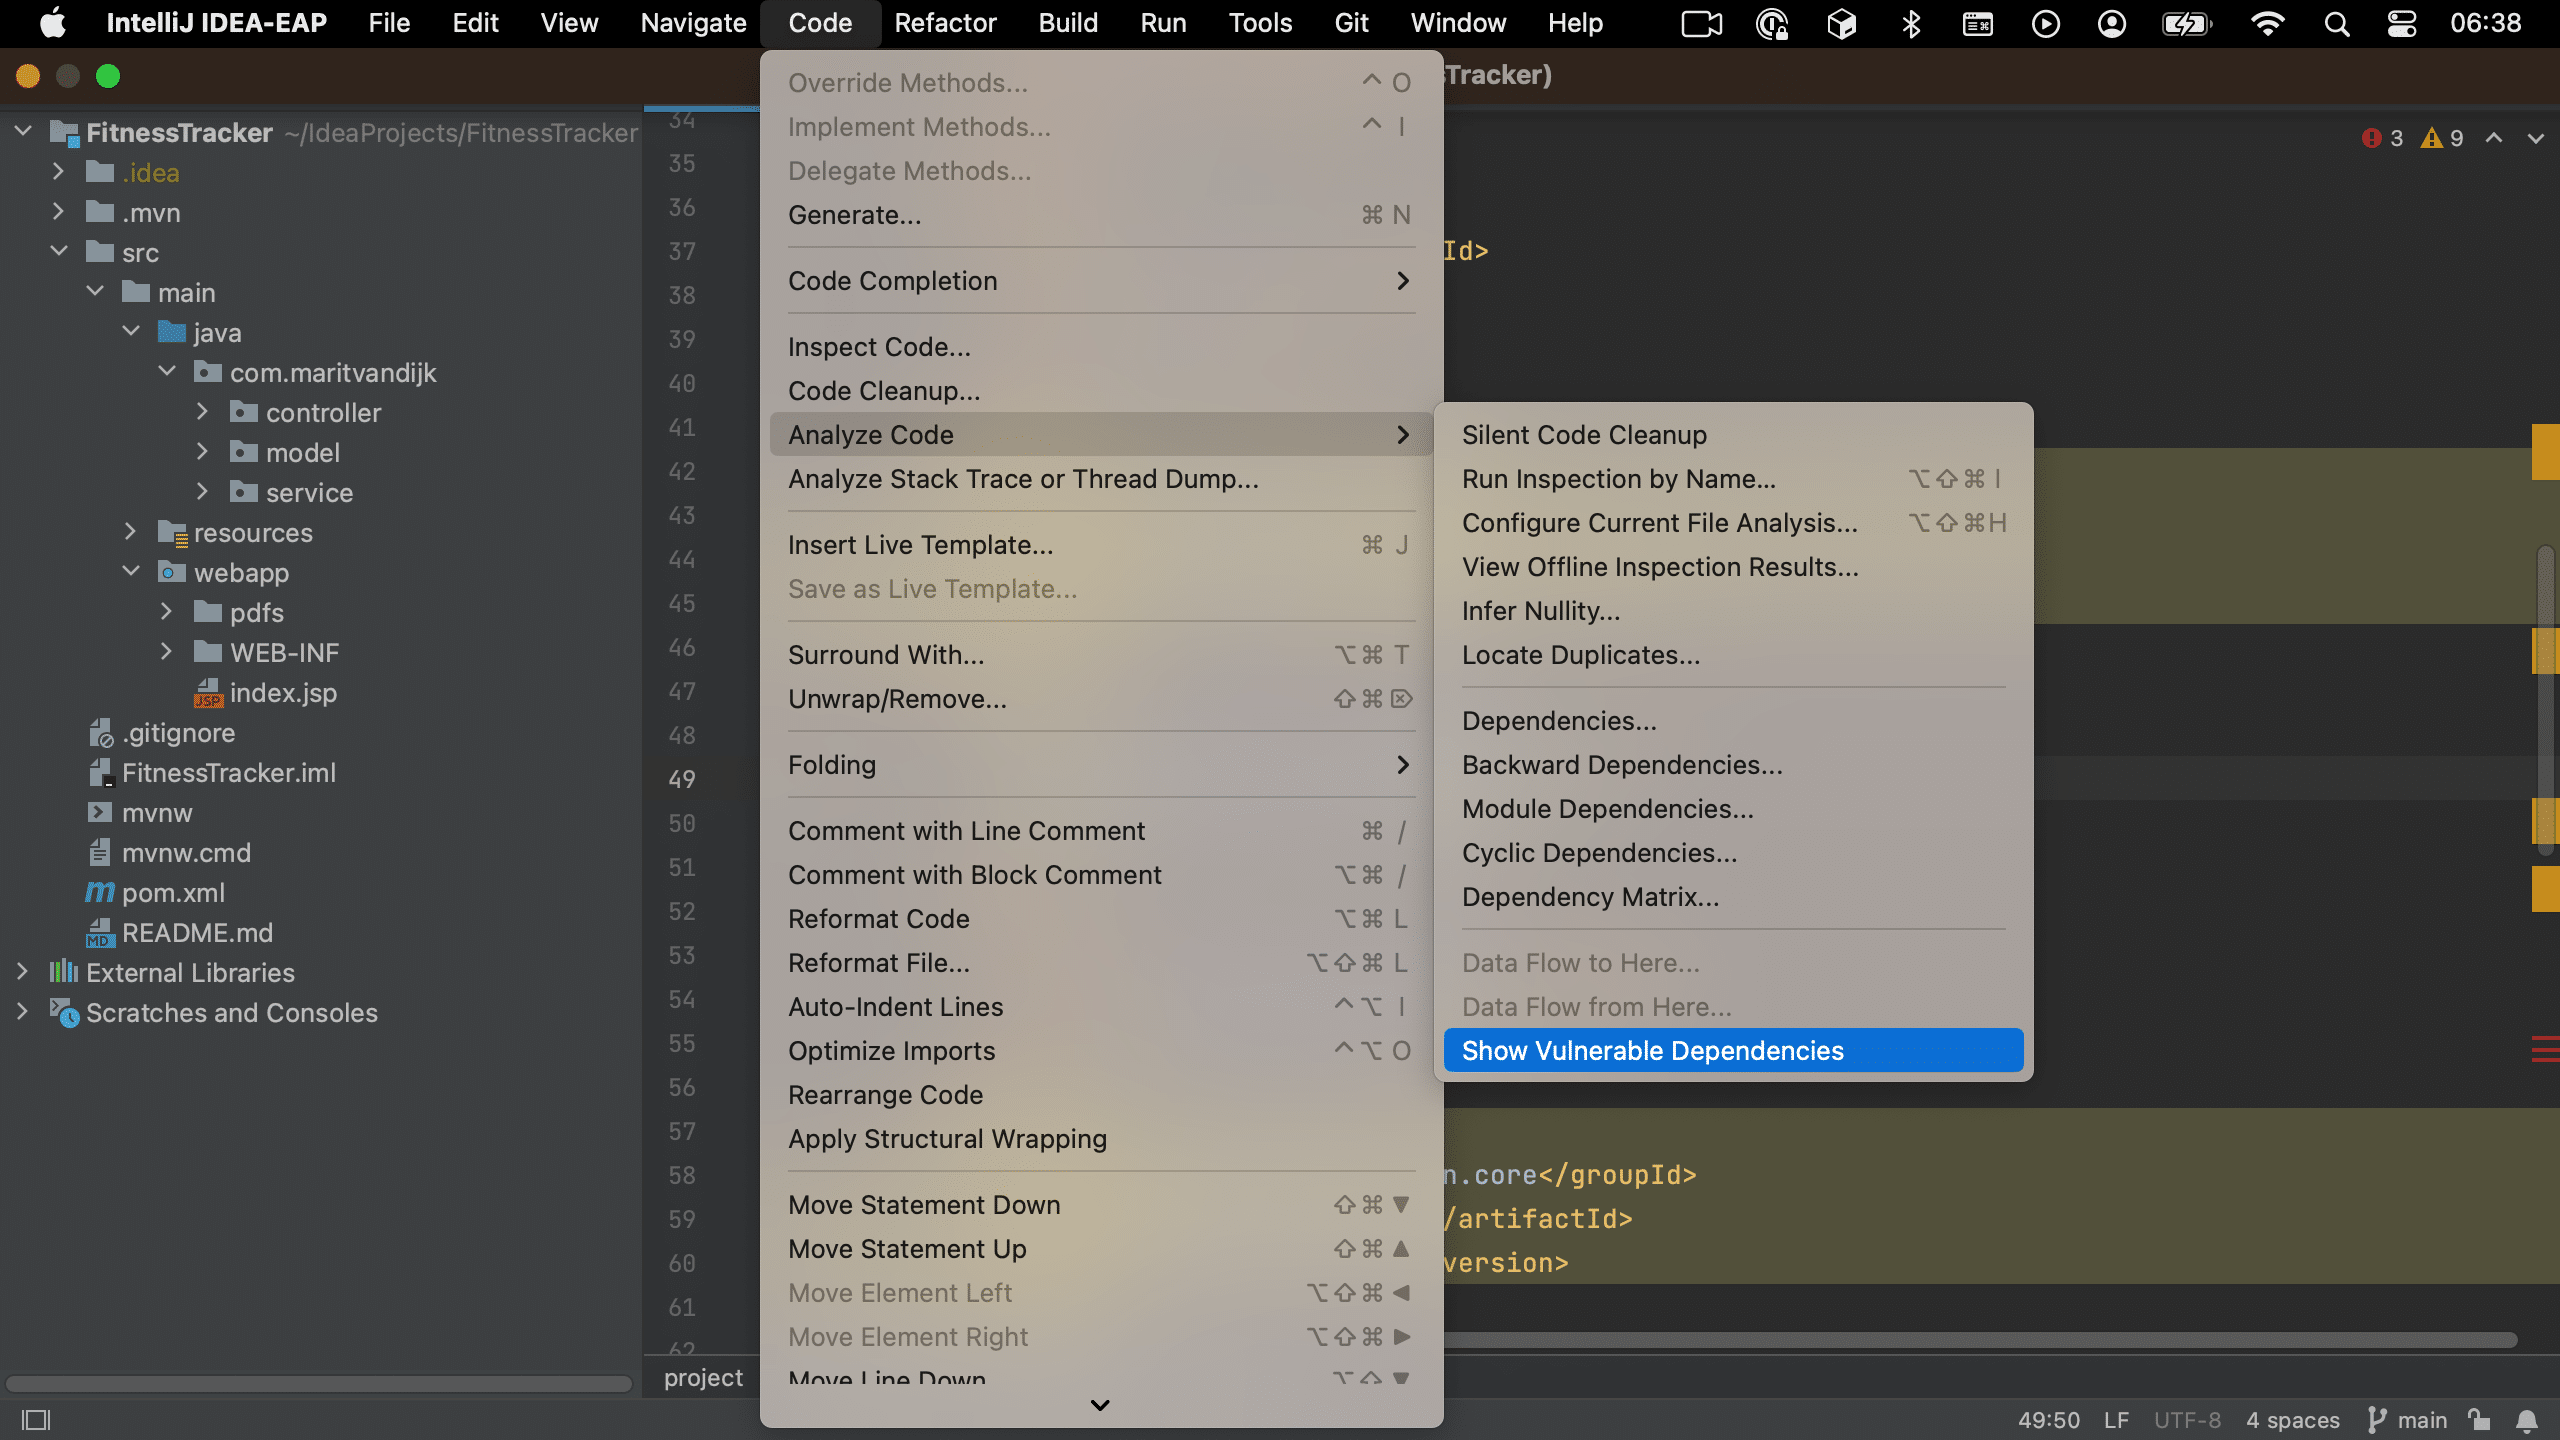
Another way to see all the vulnerable packages is by right-clicking on the pom.xml file and selecting Analyze > Show Vulnerable Dependencies. This will open the Vulnerable Dependencies tool window.
Open Vulnerable Dependencies tool window from pom.xmlVulnerable Dependencies tool window
View vulnerable dependencies in Gradle projects
In a Gradle project, all of your project’s dependencies are declared in the build.gradle. When we open the build.gradle file for a project which contains vulnerable dependencies, we see that several dependencies are highlighted.
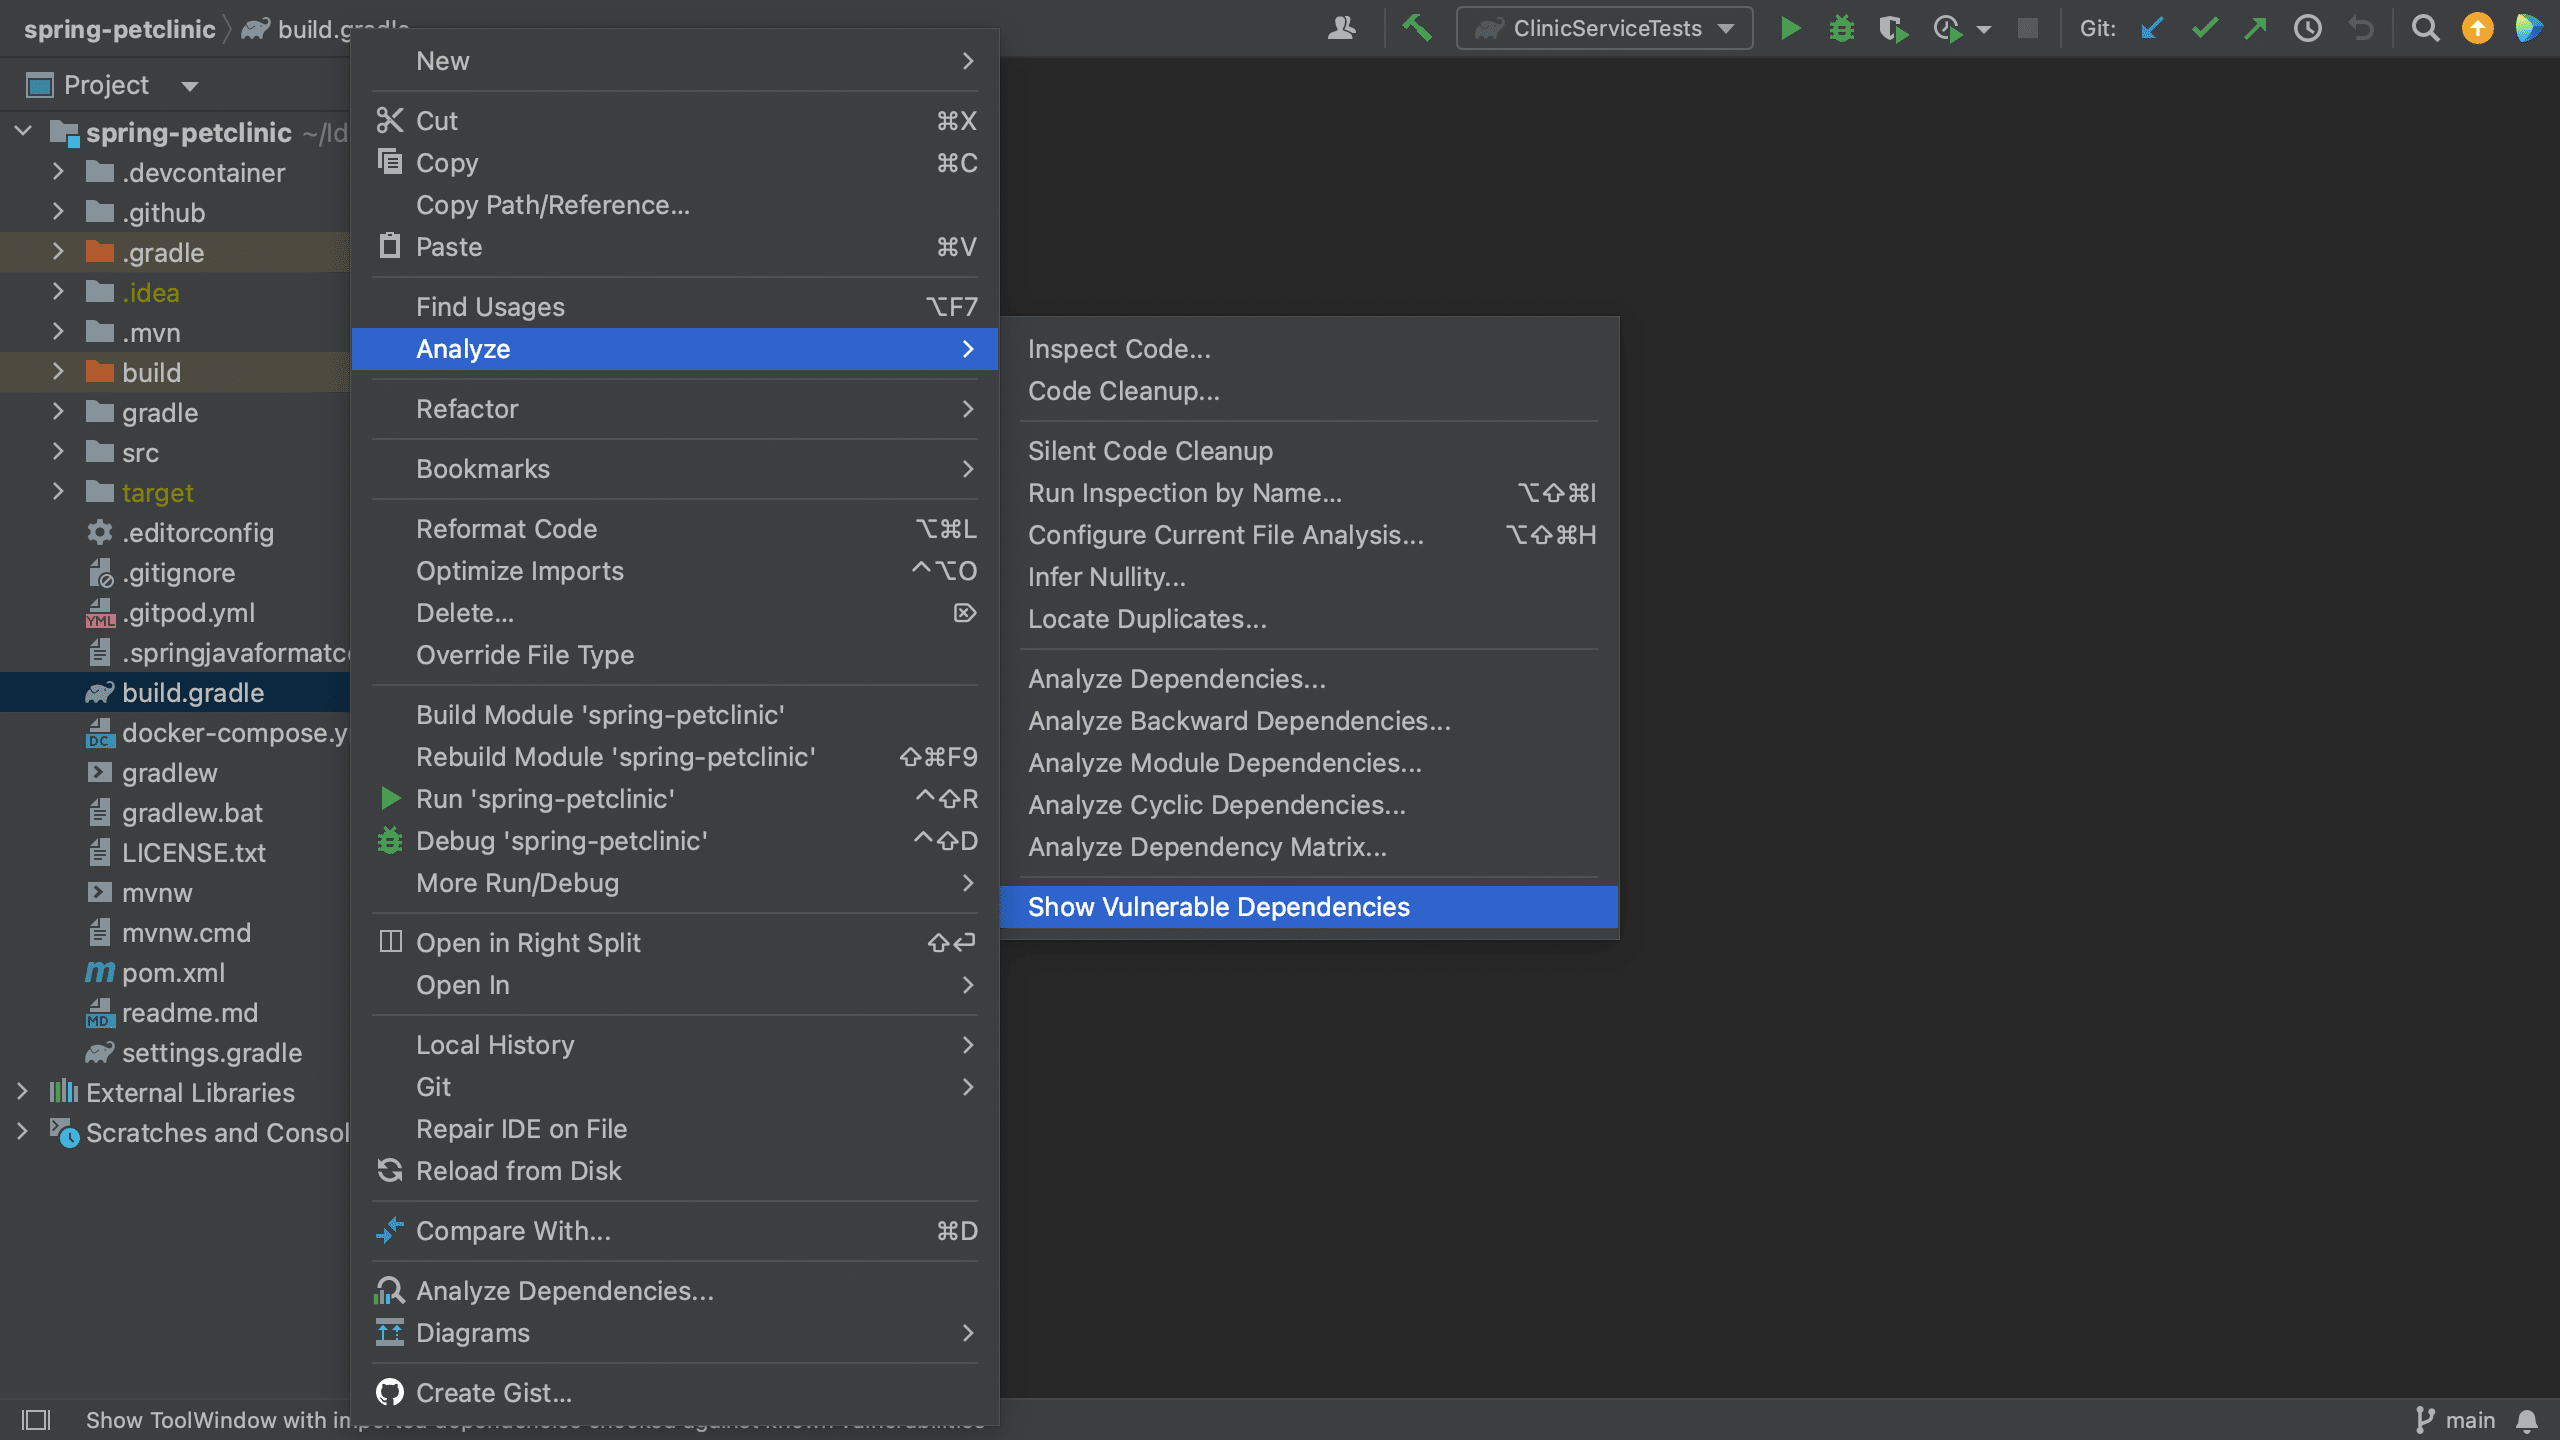
We can open the Vulnerable Dependencies tool window from the build.gradle file. For example, let’s have a look at the Spring PetClinic, which uses Gradle. We can right-click the build.gradle file and go to Analyze > Show Vulnerable Dependencies. This will open the Vulnerable Dependencies tool window.
Open Vulnerable Dependencies tool window from build.gradleVulnerable Dependencies tool window
View vulnerable dependencies in the Vulnerable Dependencies tool window
We can also open the Vulnerable Dependencies tool window without having to open the files where our dependencies are declared. To open the Vulnerable Dependencies tool window straight from the main menu, go to Code > Analyze Code > Show Vulnerable Dependencies.
Open Vulnerable Dependencies tool window from menu
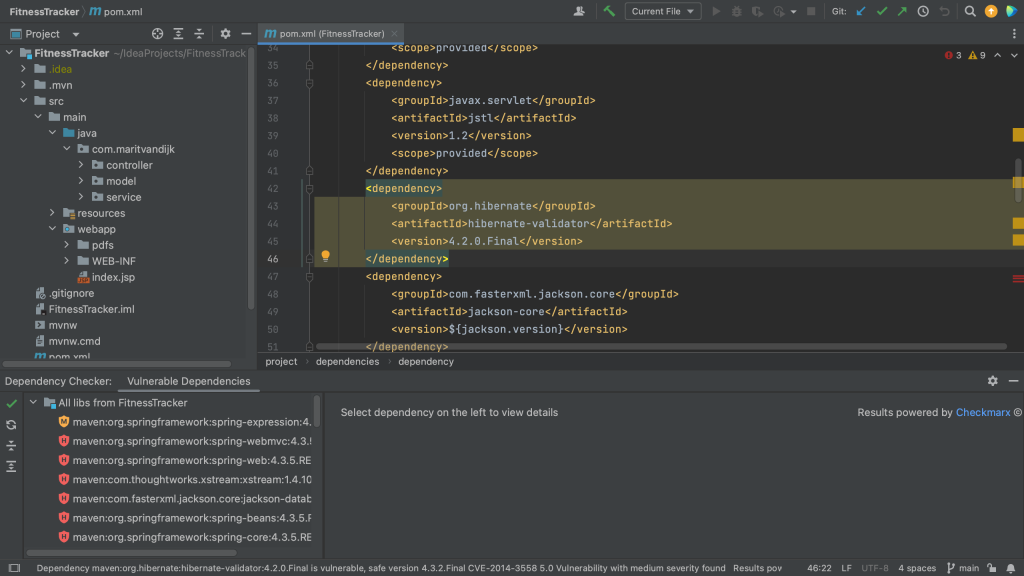
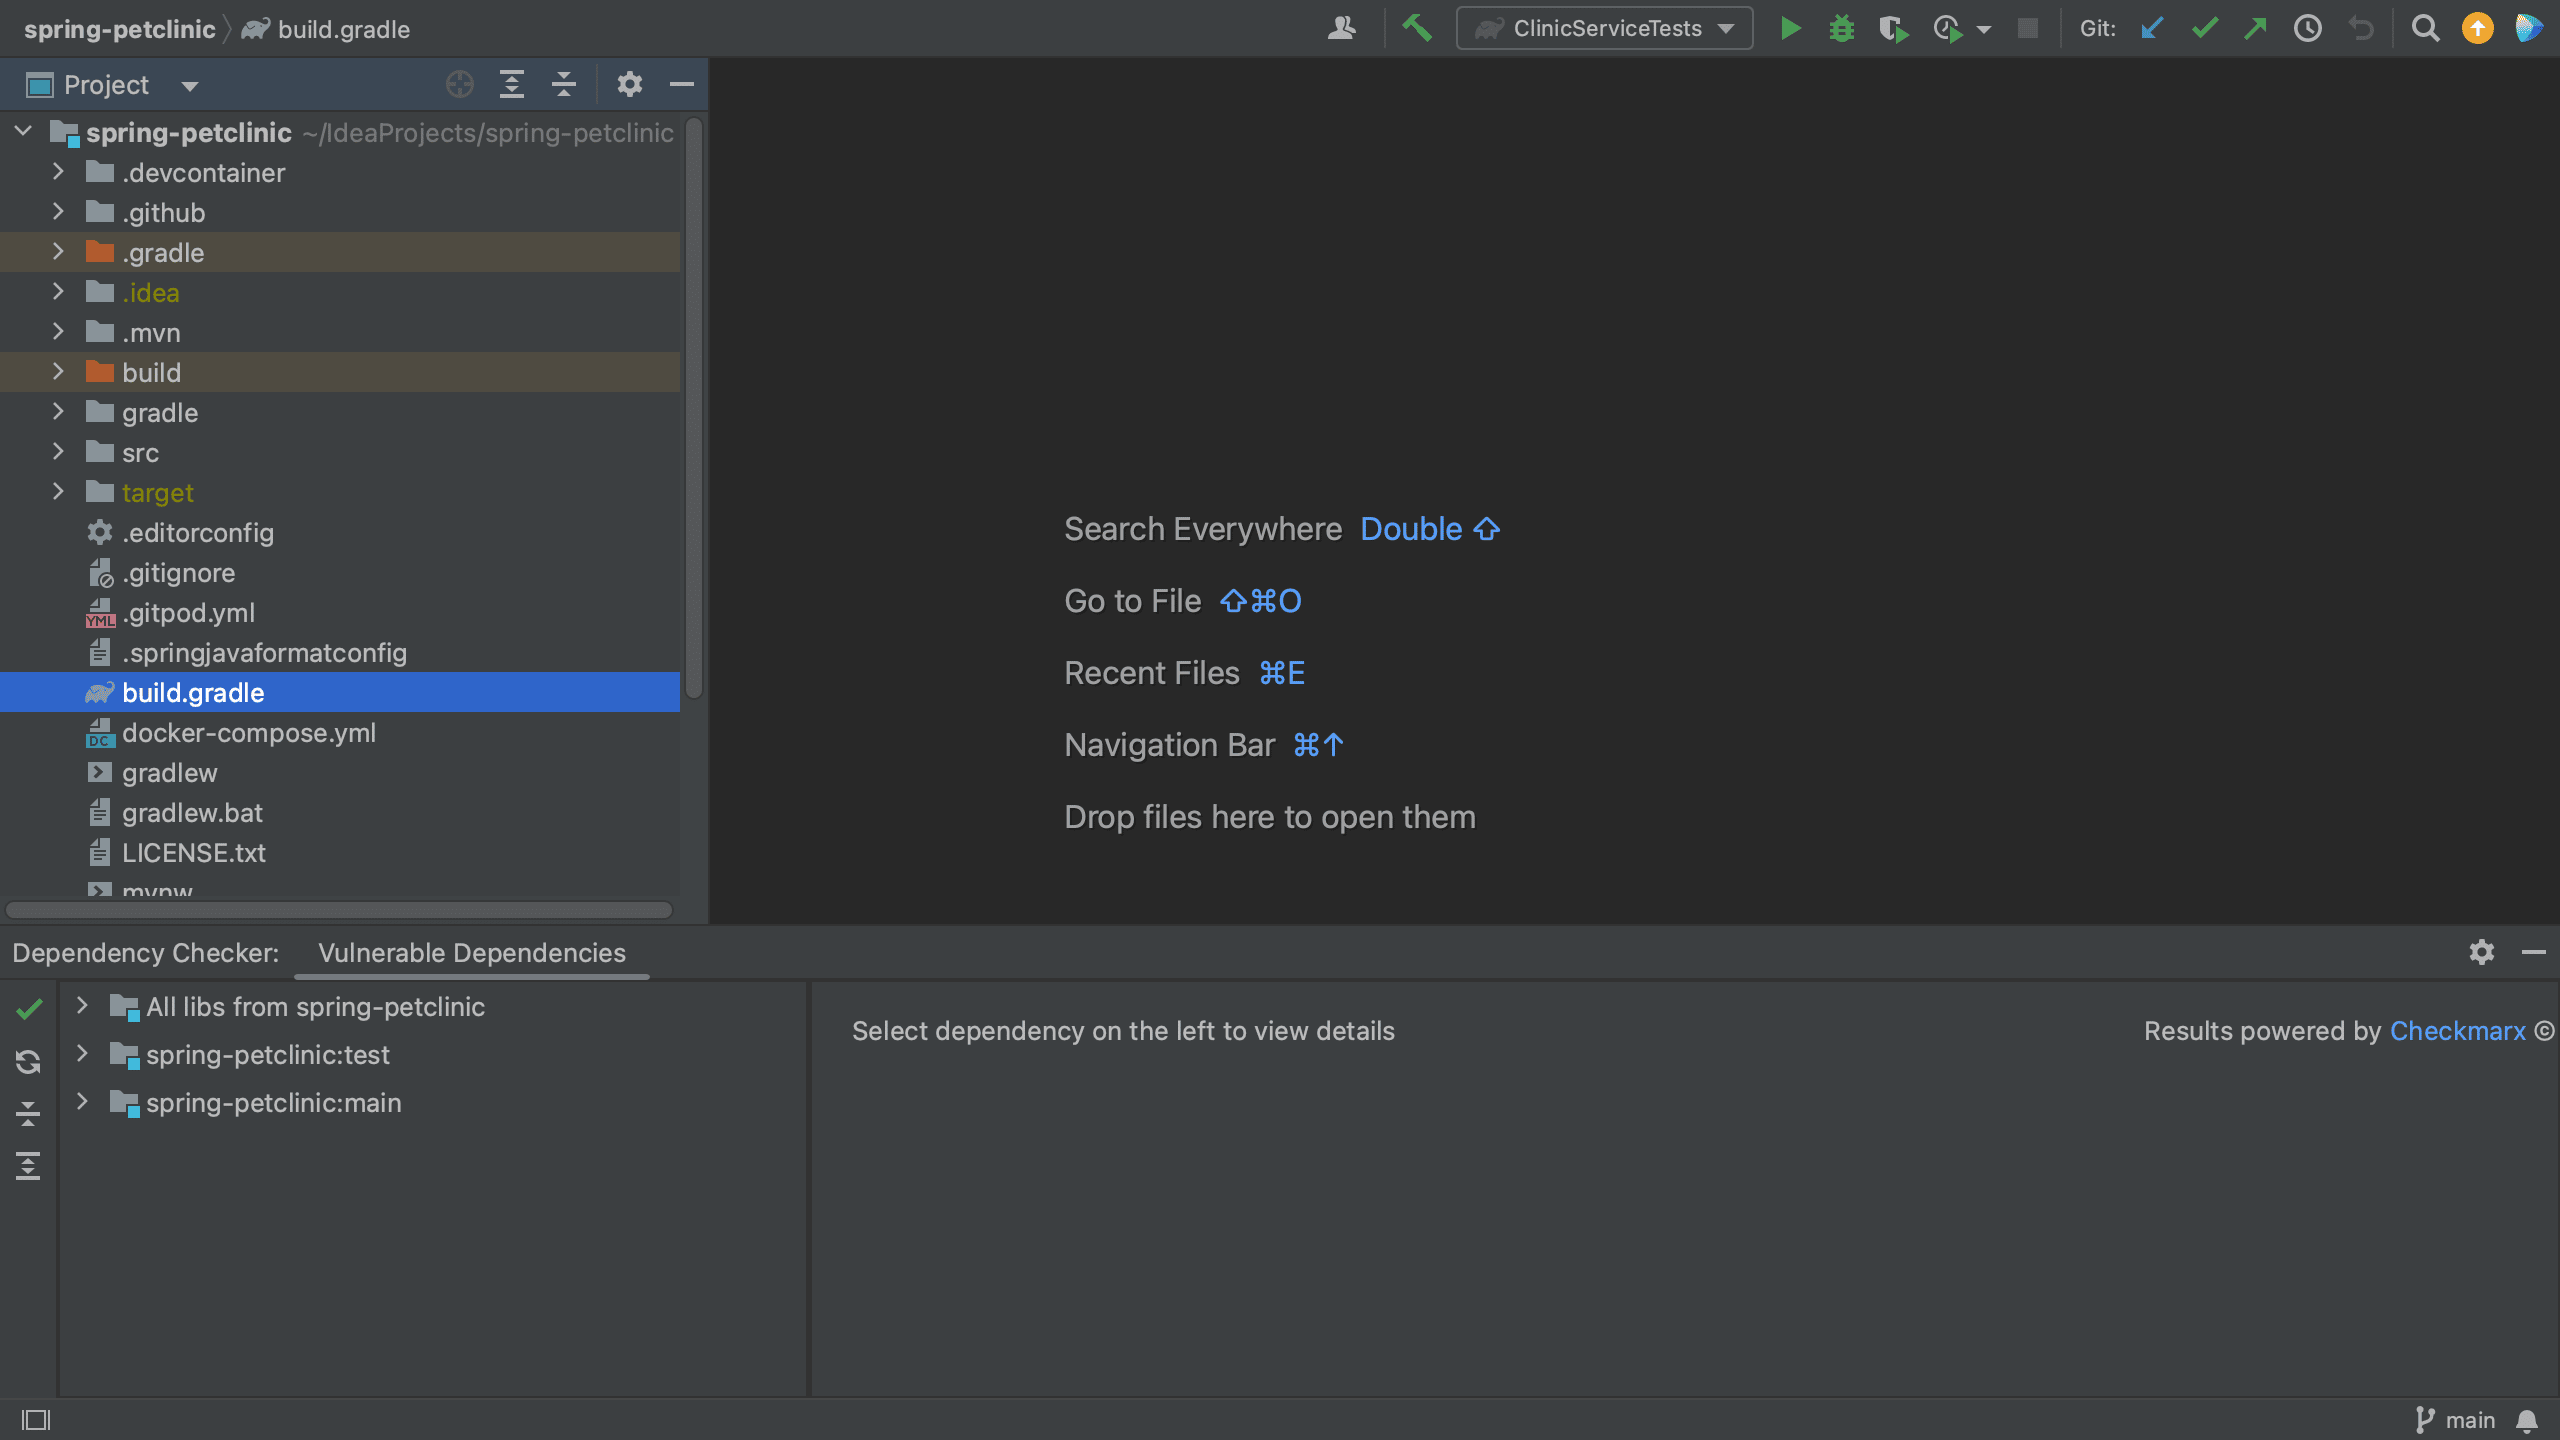
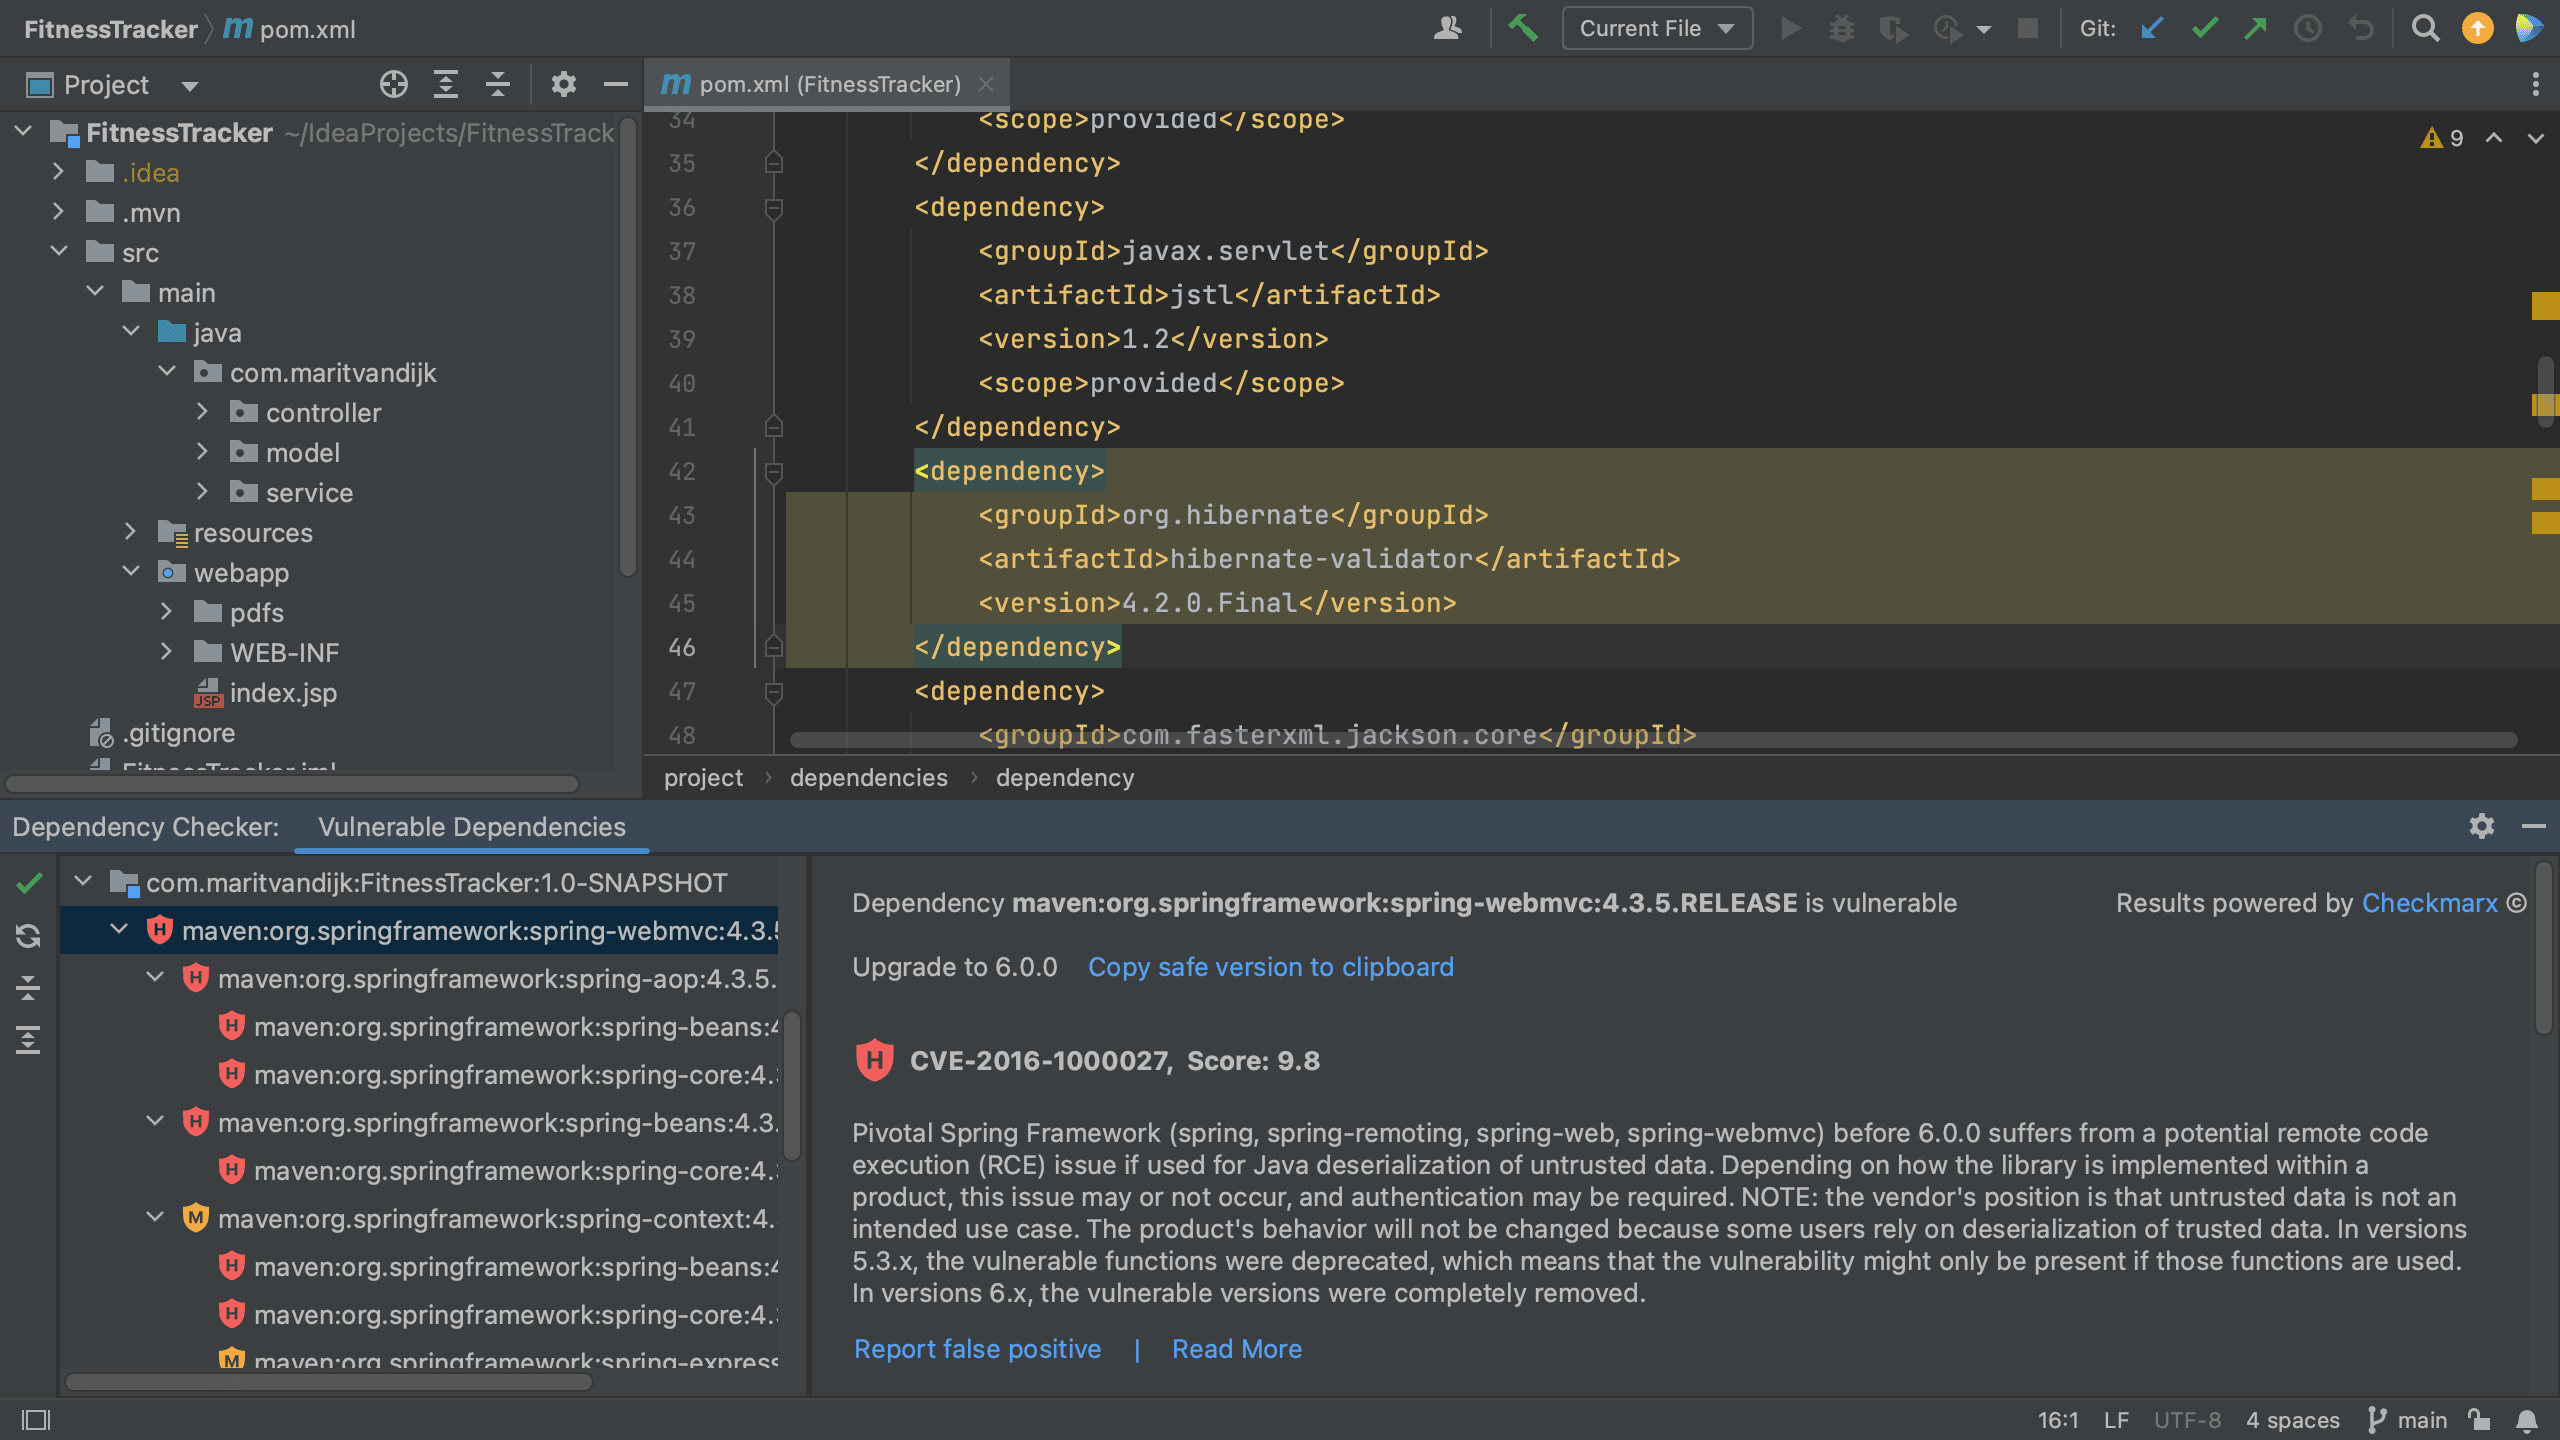
The Vulnerable Dependencies tool window shows all the vulnerable dependencies for the project. For each vulnerability, we can see an indication of the severity. There are two different views; the flat view shows all the vulnerable dependencies in this project and the dependency hierarchy view shows the dependency tree and the hierarchy between dependencies.
When we click a specific dependency, we can see more information about the vulnerabilities that were found in that dependency. In the Vulnerable Dependencies tool window details pane on the right, we can click the link to Read more under the information about a particular dependency, which will take us to the information about this specific vulnerability in the Checkmarx Advisory.
Vulnerable Dependencies tool window details
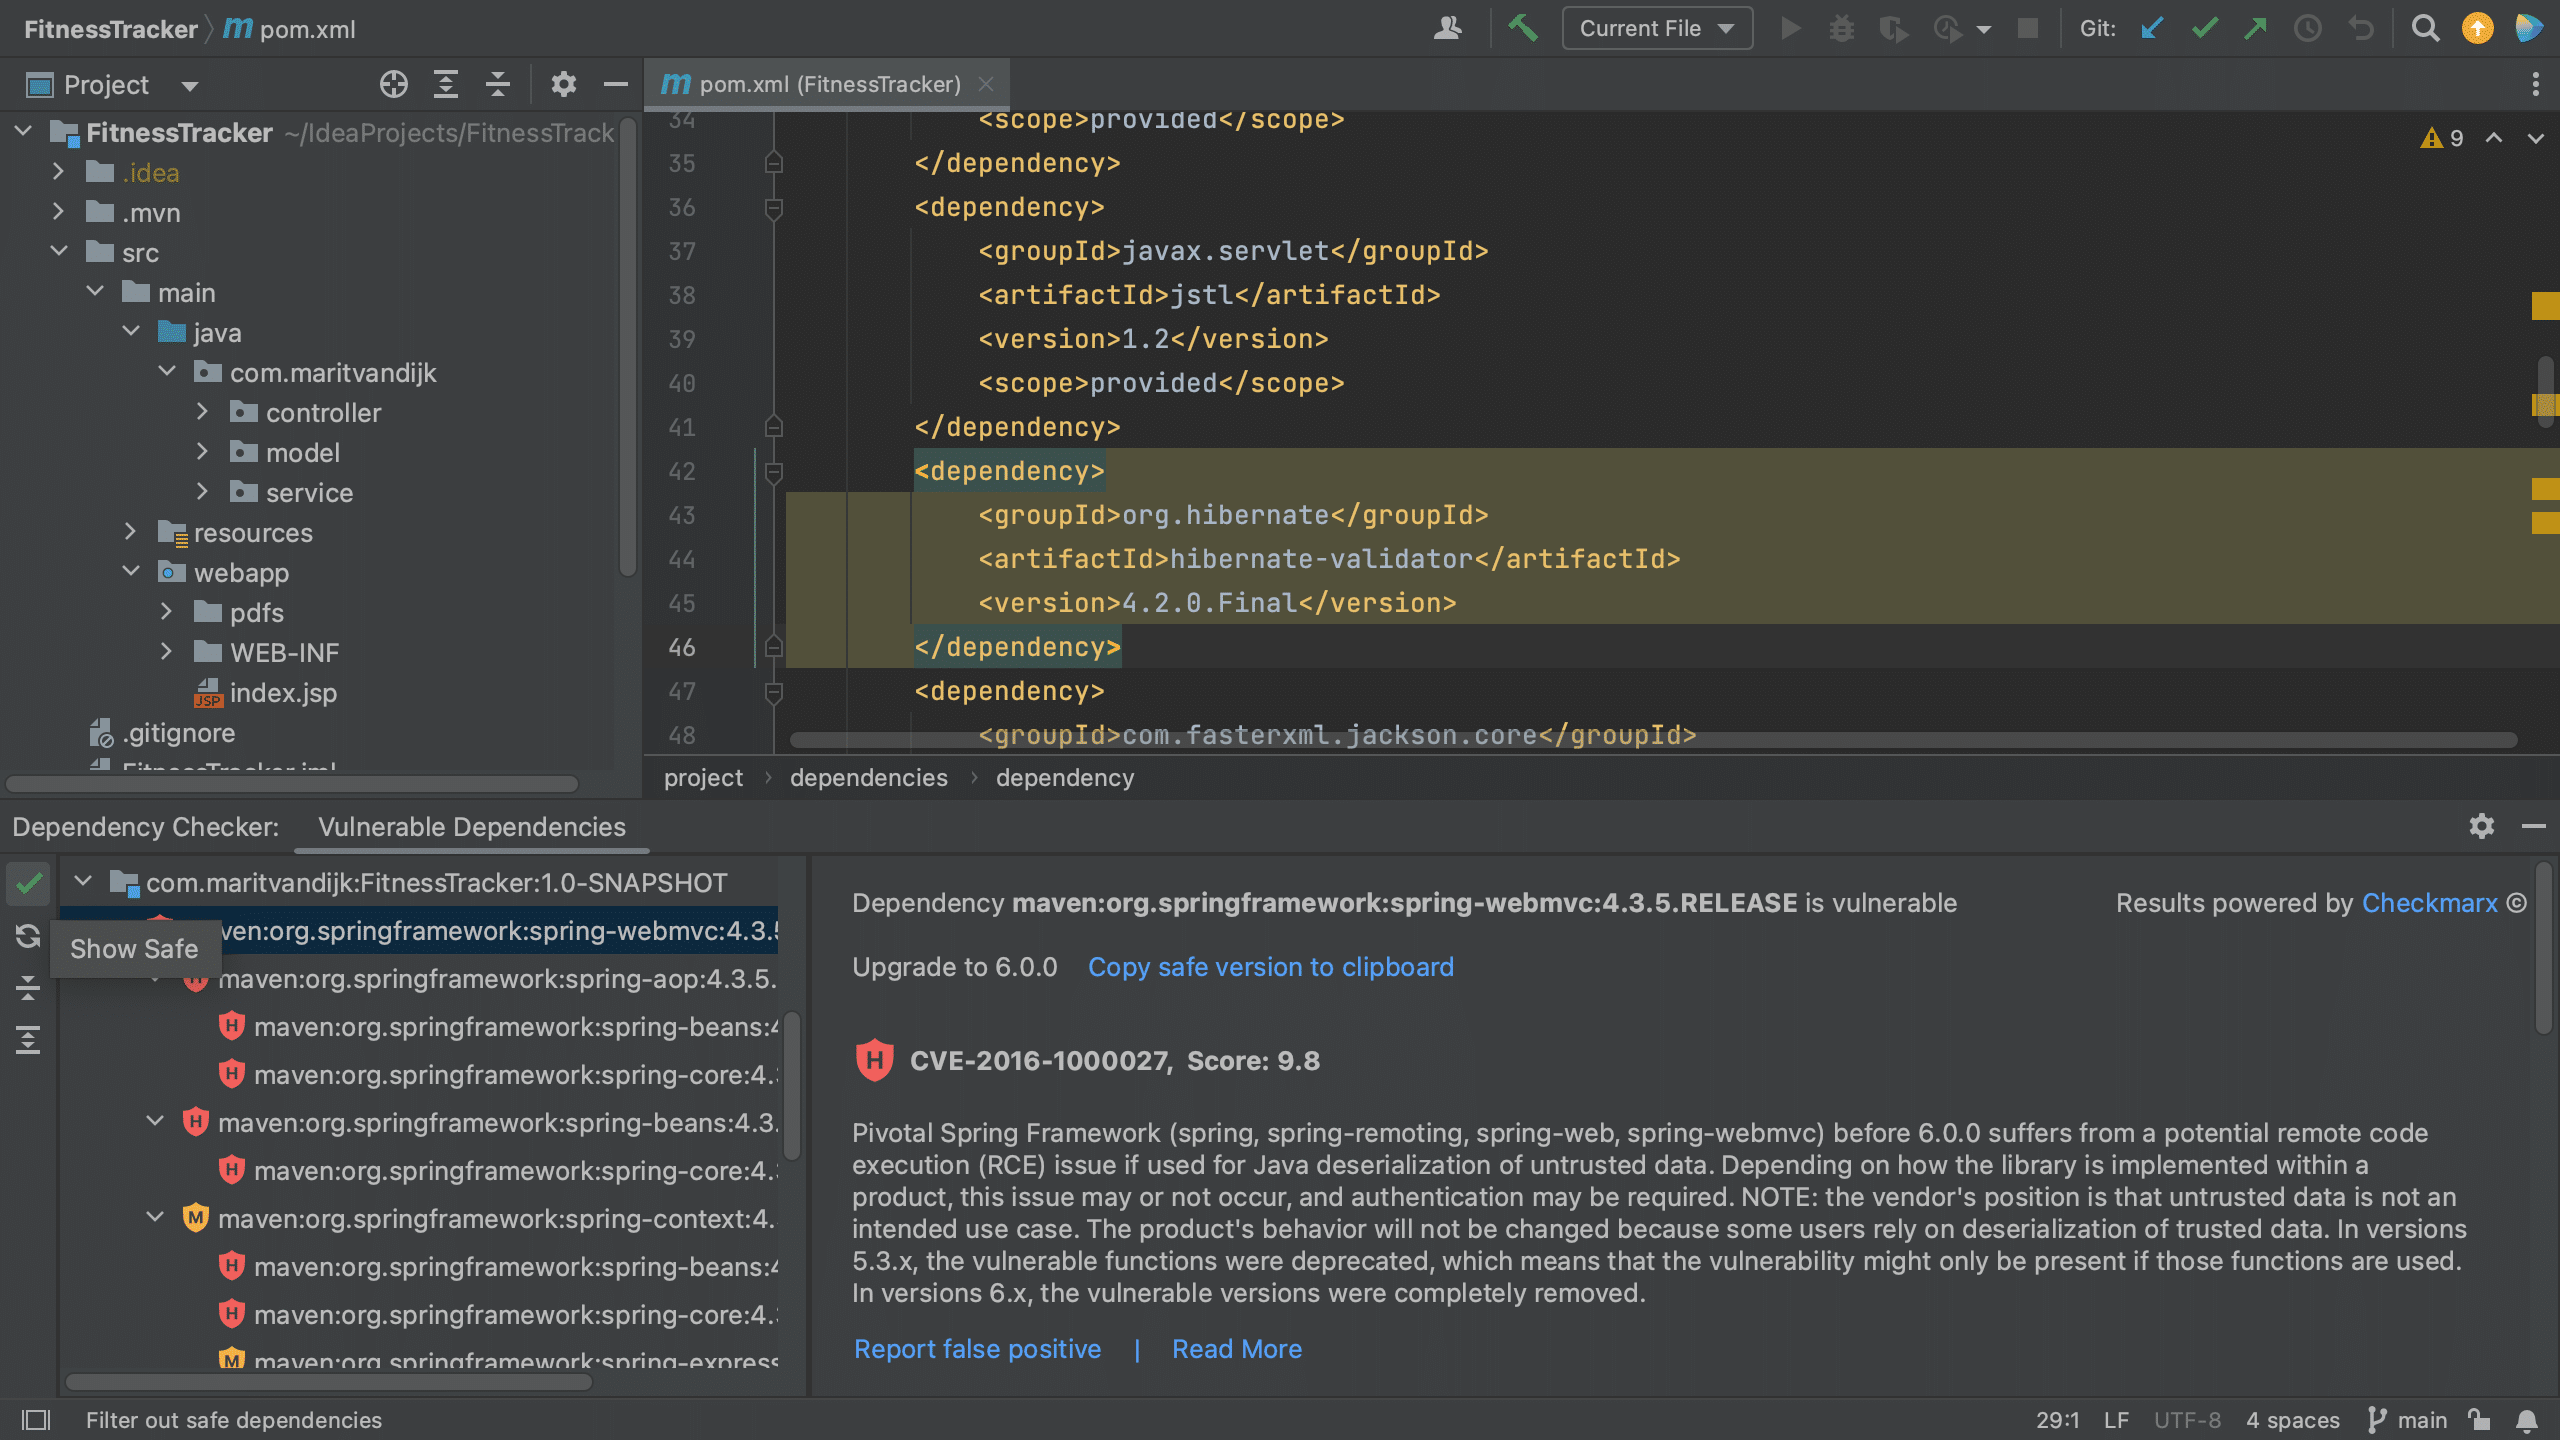
To see all the dependencies of the project regardless of whether they’re vulnerable or not, we can click the Show safe button on the top left of the Vulnerable Dependencies tool window.
Show safe button
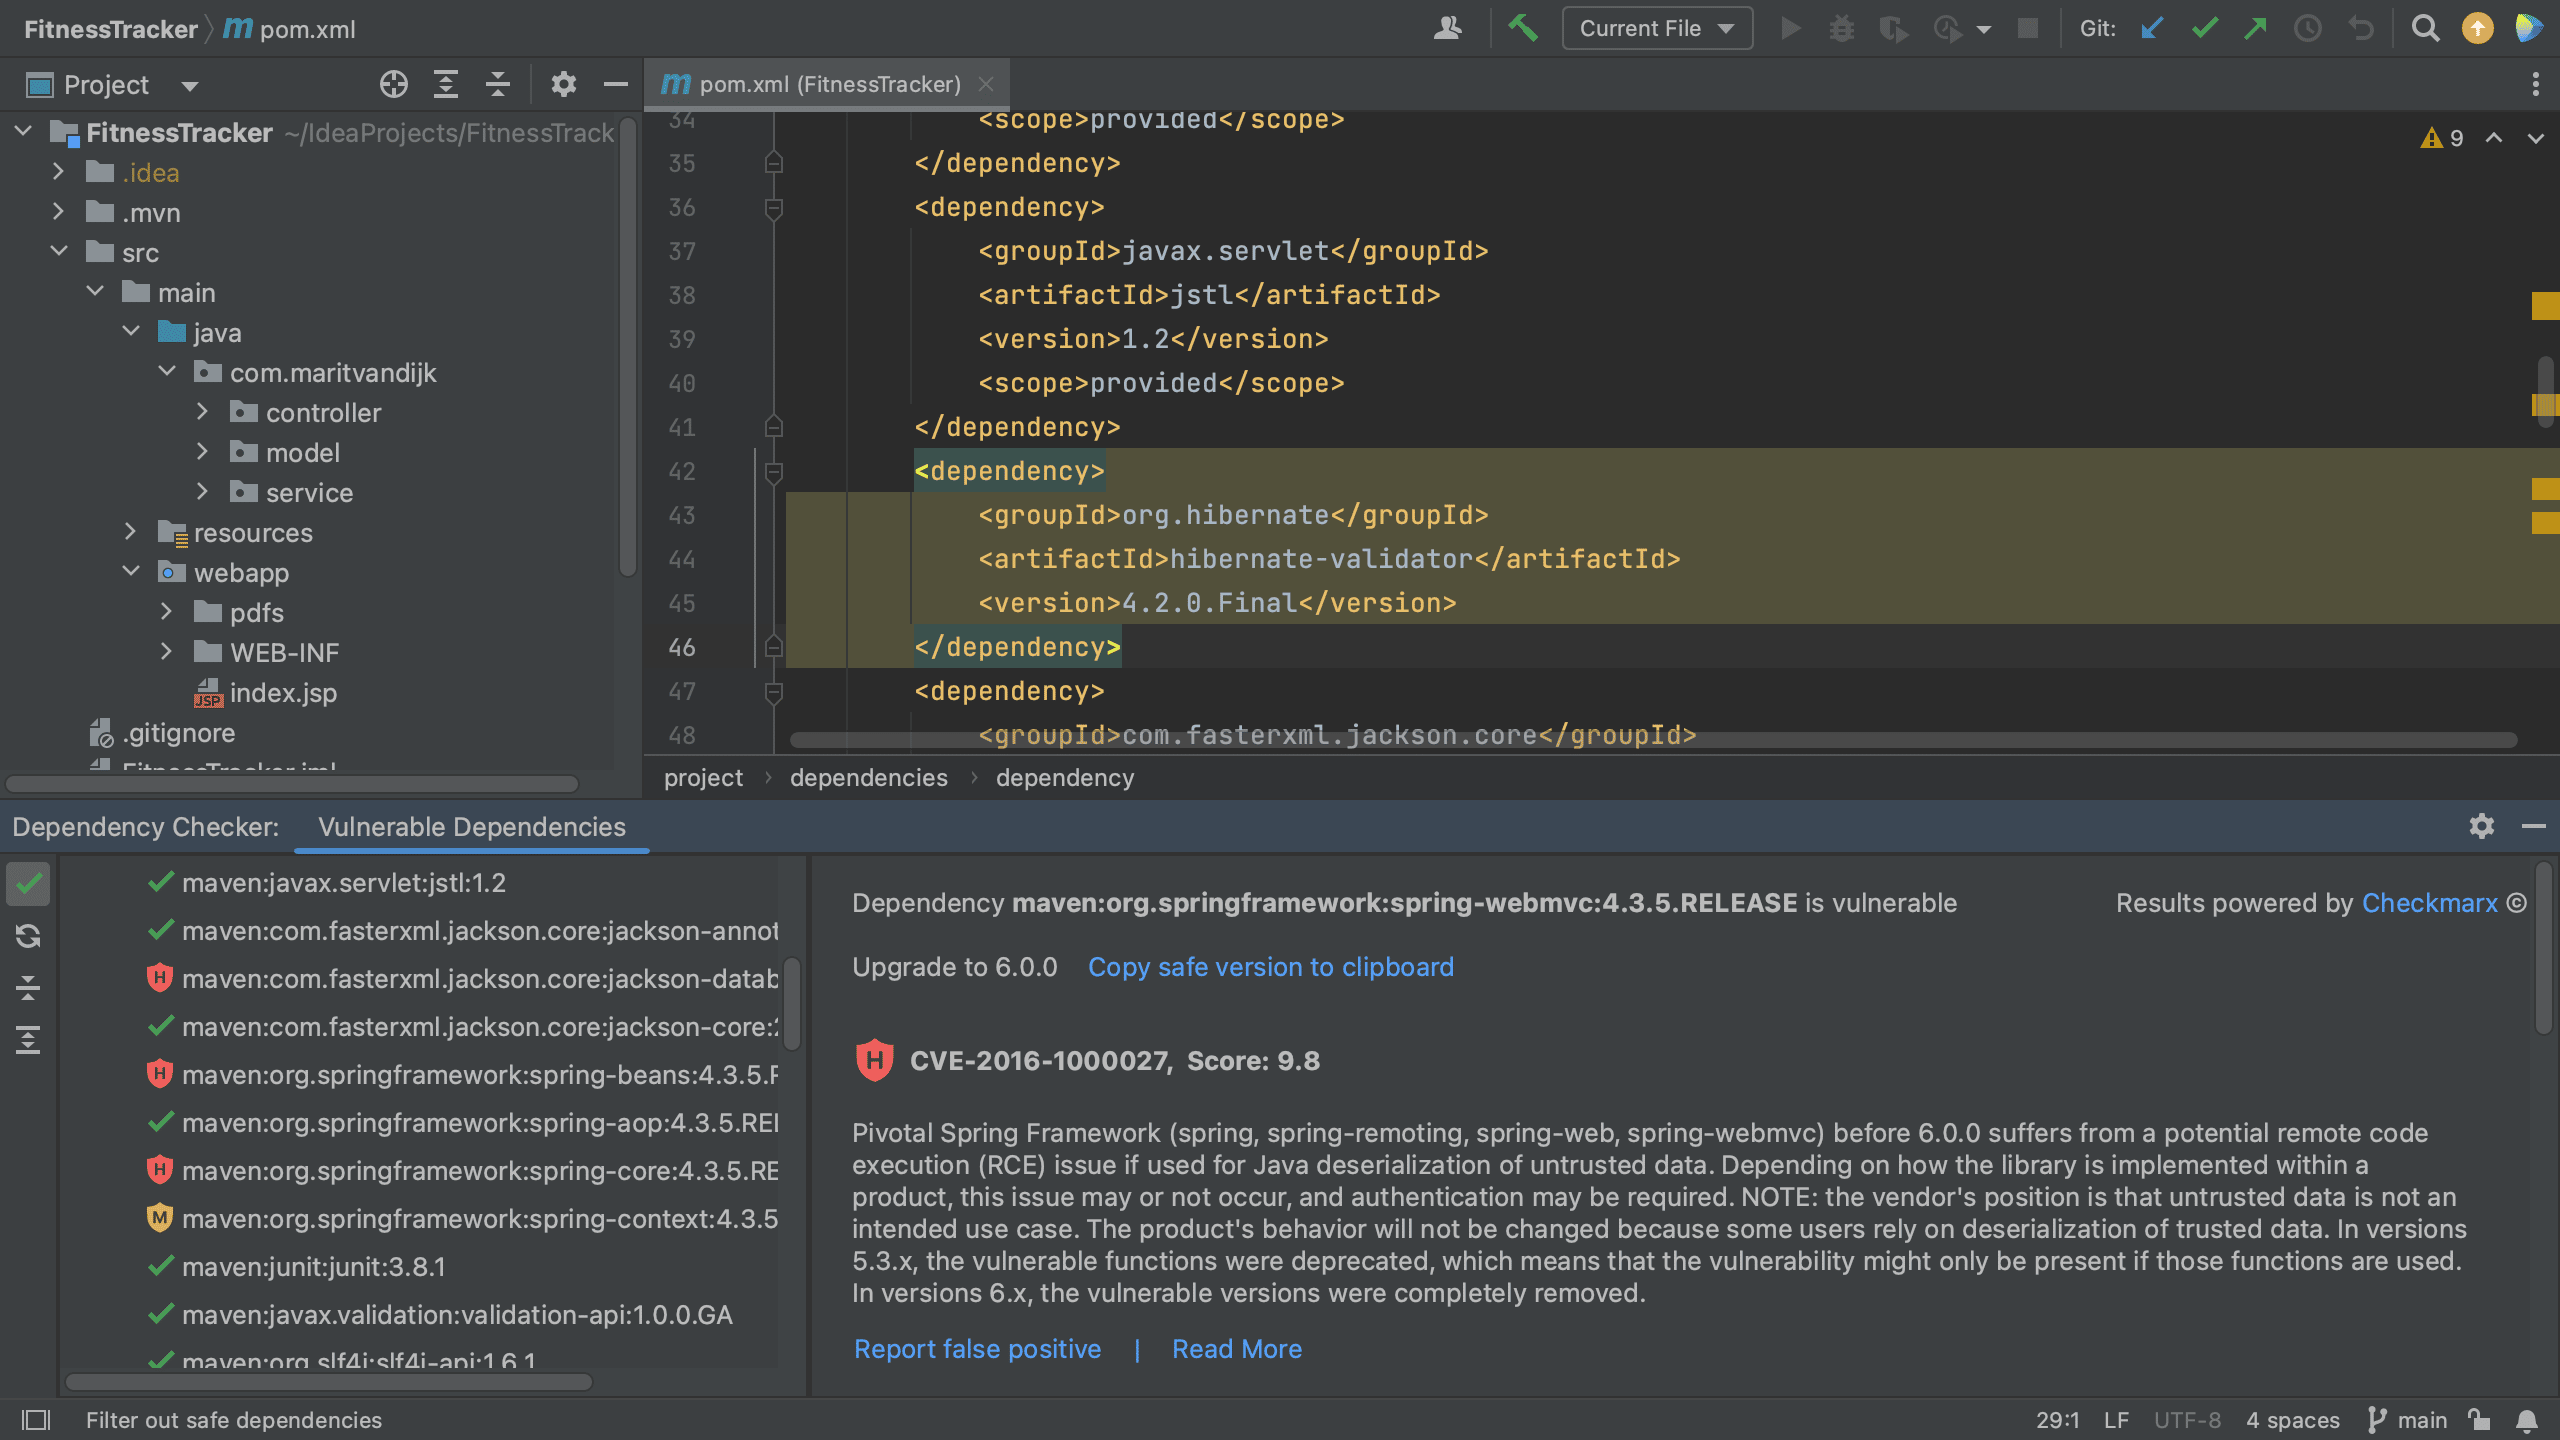
The dependencies without known vulnerabilities are shown with a green checkmark next to it. We still have the same two views; the flat view and the dependency hierarchy view. We can use the Show safe button to toggle between showing all dependencies or vulnerable dependencies only. We can use the Collapse all or Expand all buttons to collapse or expand the views.
Show safe dependencies
Remediate dependencies using IntelliJ IDEA Ultimate
Finally, we can remediate these vulnerabilities. We can click Copy safe version to clipboard in the Vulnerable Dependencies tool window details pane to copy the safe version and paste it into our build file.
Copy safe version to clipboard
We can also fix it directly in our build file. When we hover over a specific vulnerable dependency, the hover menu includes an action that we can click to upgrade the version (if a new version is available).
Show hover
Fixed version from hover
Alternatively, we can use the intention action shortcut, ⌥ ⏎ on MacOs, or Alt+Enter on Windows/Linux and select the action to upgrade the version (if a new version is available).
Show context actionsFixed version from context actions
After we update the versions, we can Load Maven Changes, using ⌘⇧I on MacOs or Ctrl+Shift+O on Windows/Linux. We see that the overview in the Vulnerable Checker tool window is updated, and we see that dependencies that we have upgraded and are no longer vulnerable are removed, or shown with a green checkmark if we have enabled Show safe dependencies.
Load Maven Changes
Updated
Summary and Shortcuts
As we have seen, the Package Checker plugin bundled with IntelliJ IDEA Ultimate offers several different ways in which we can view vulnerable dependencies in our project inside IntelliJ IDEA Ultimate, get more information about these vulnerabilities, and remediate them. This plugin can help keep your projects safe and secure right inside your IDE!
We’ll have a look at how to view known vulnerabilities in your Maven or Gradle projects, how to get more information about the known vulnerabilities in a specific dependency and how to remediate these vulnerabilities inside IntelliJ IDEA Ultimate if a new version with a fix is available.
In this tutorial, we’re going to take a look at managing dependencies in IntelliJ IDEA. We’ll look at different ways to add dependencies to your project, and how to add, upgrade and remove dependencies using Package Search.
Add dependencies
There are several ways to add new dependencies to your project.
From the build file using copy-paste
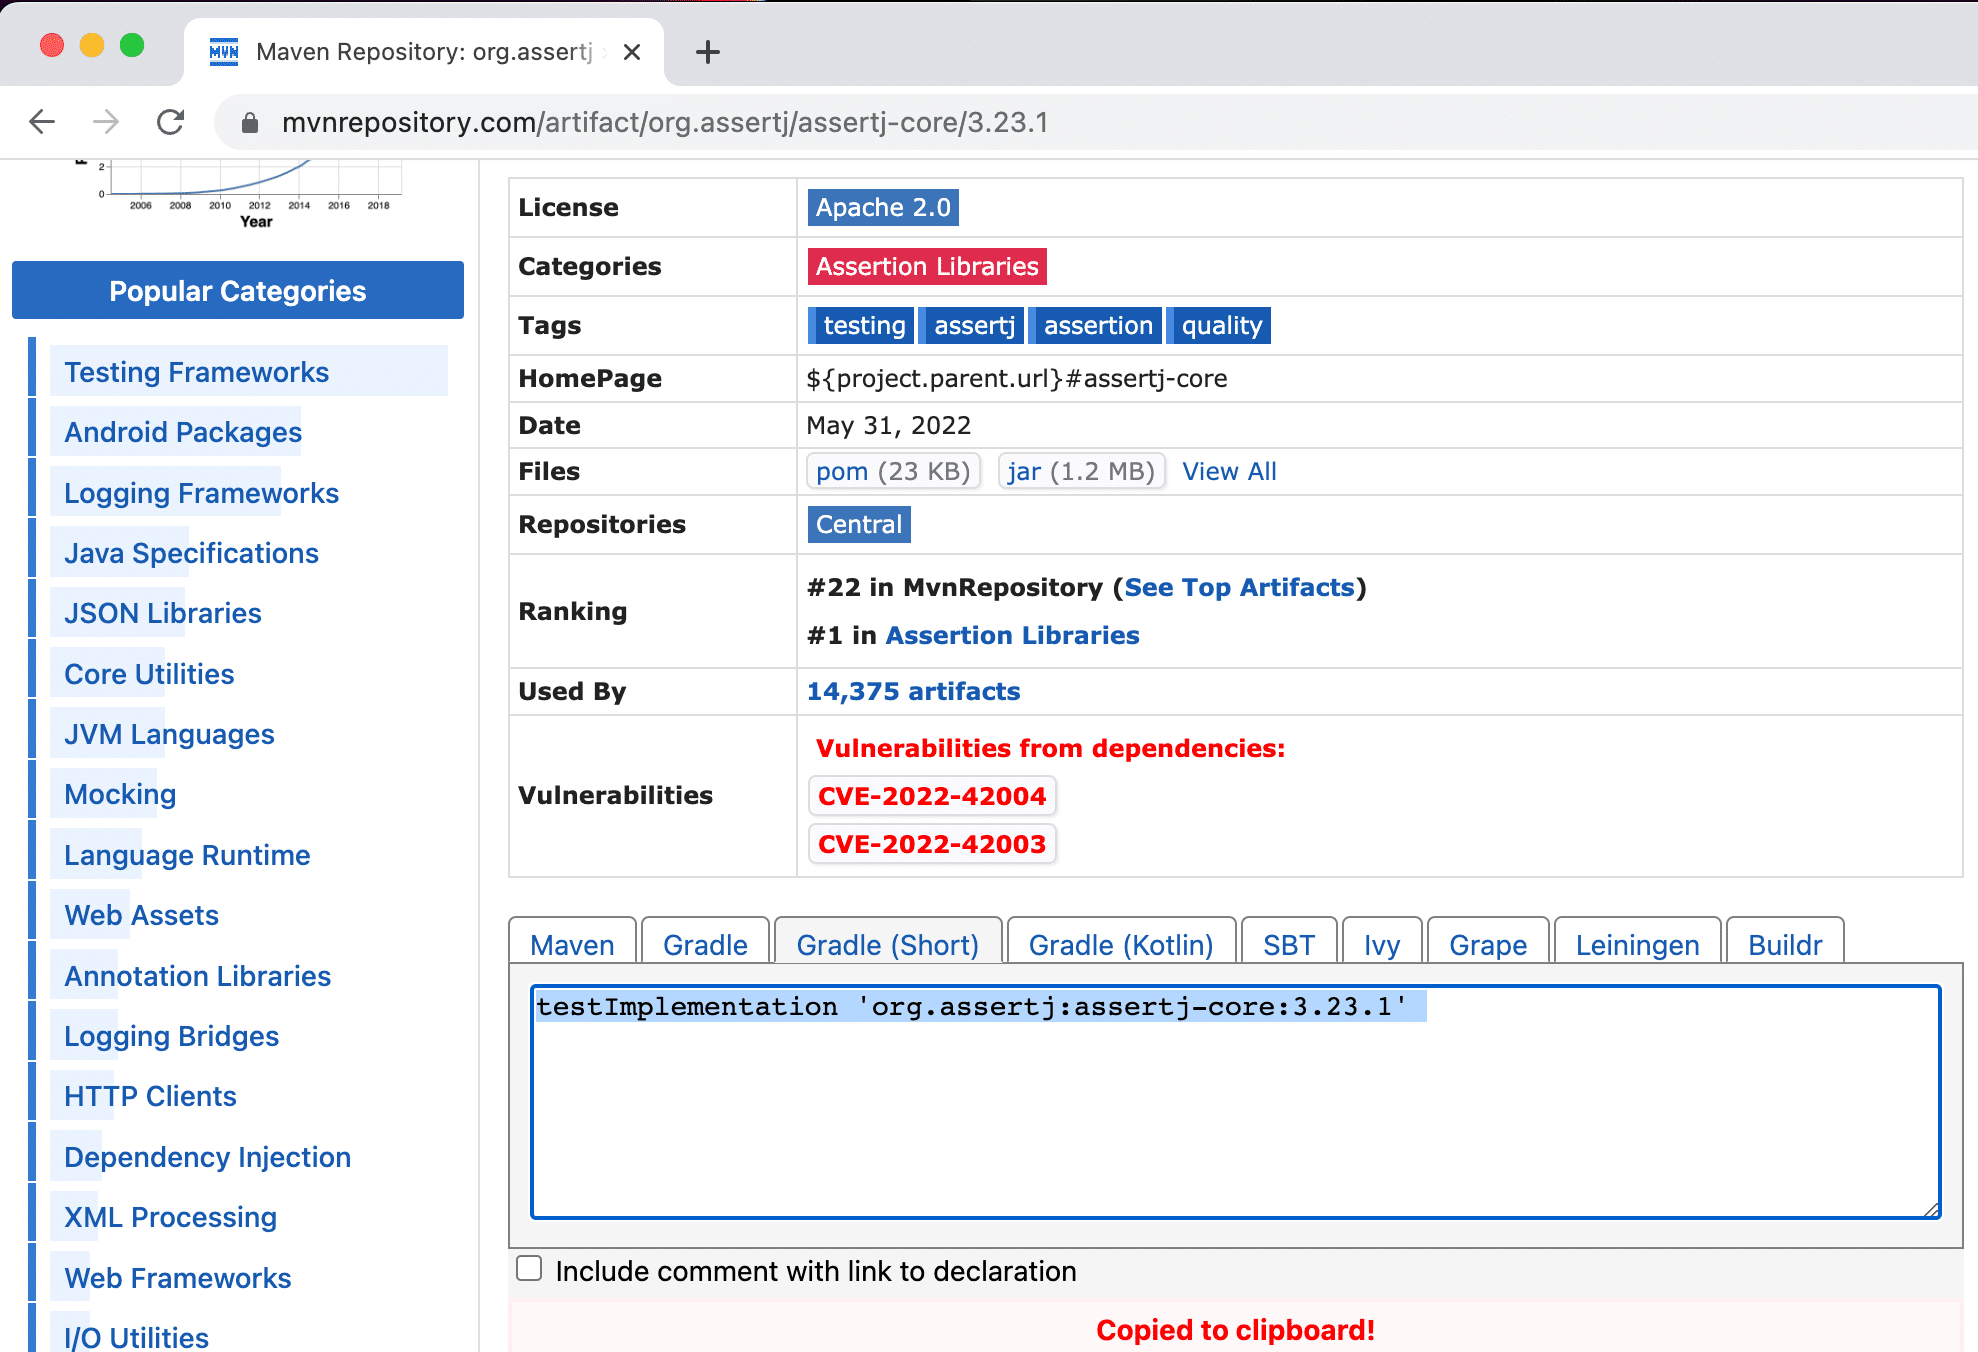
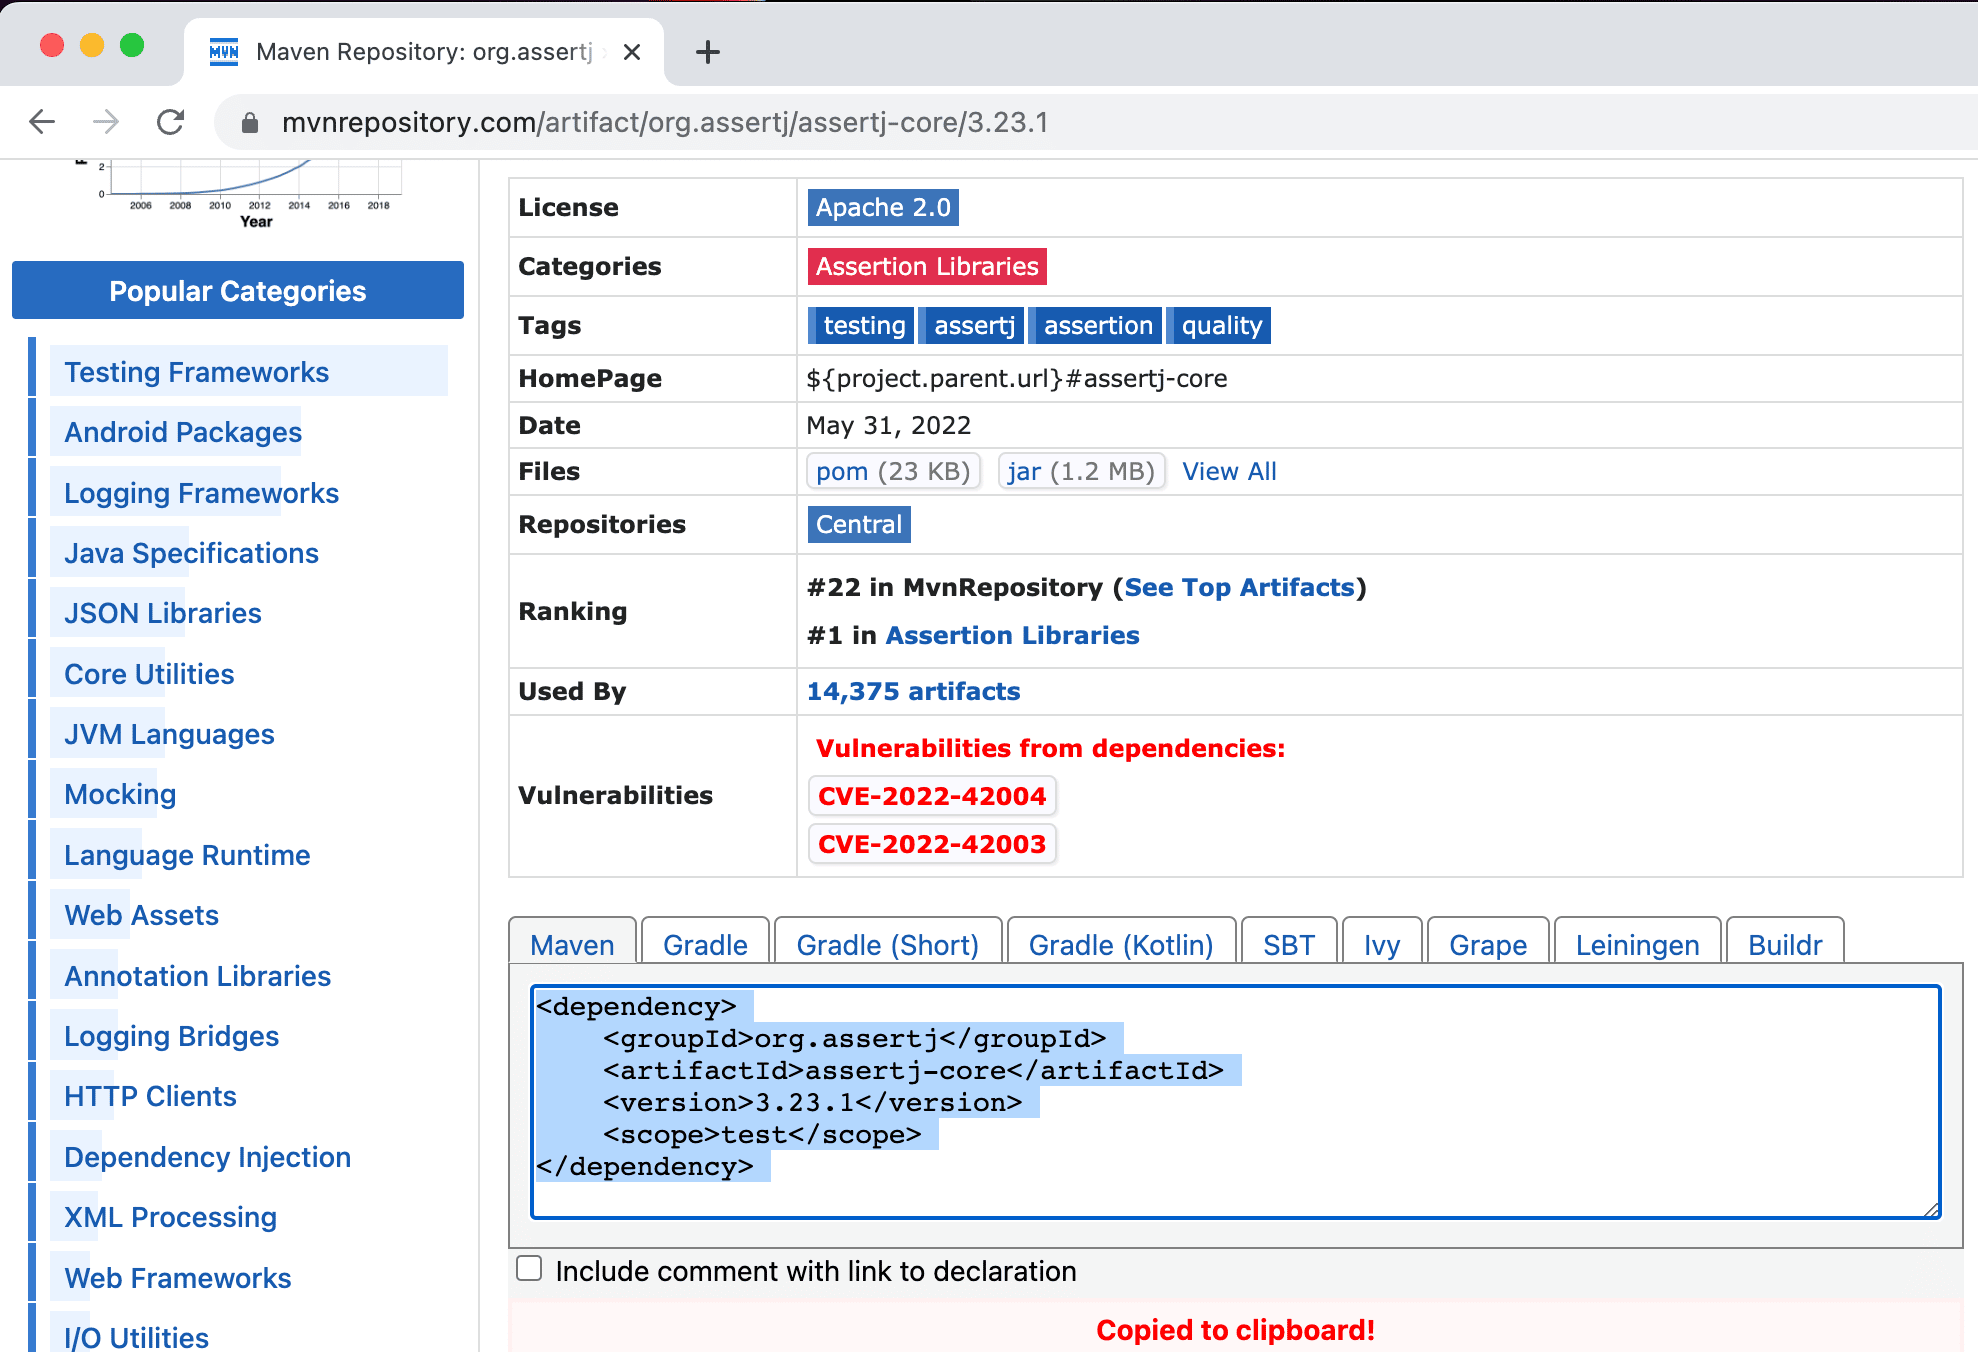
You have probably copied a dependency from Maven Repository (or another website) and pasted into your build file.
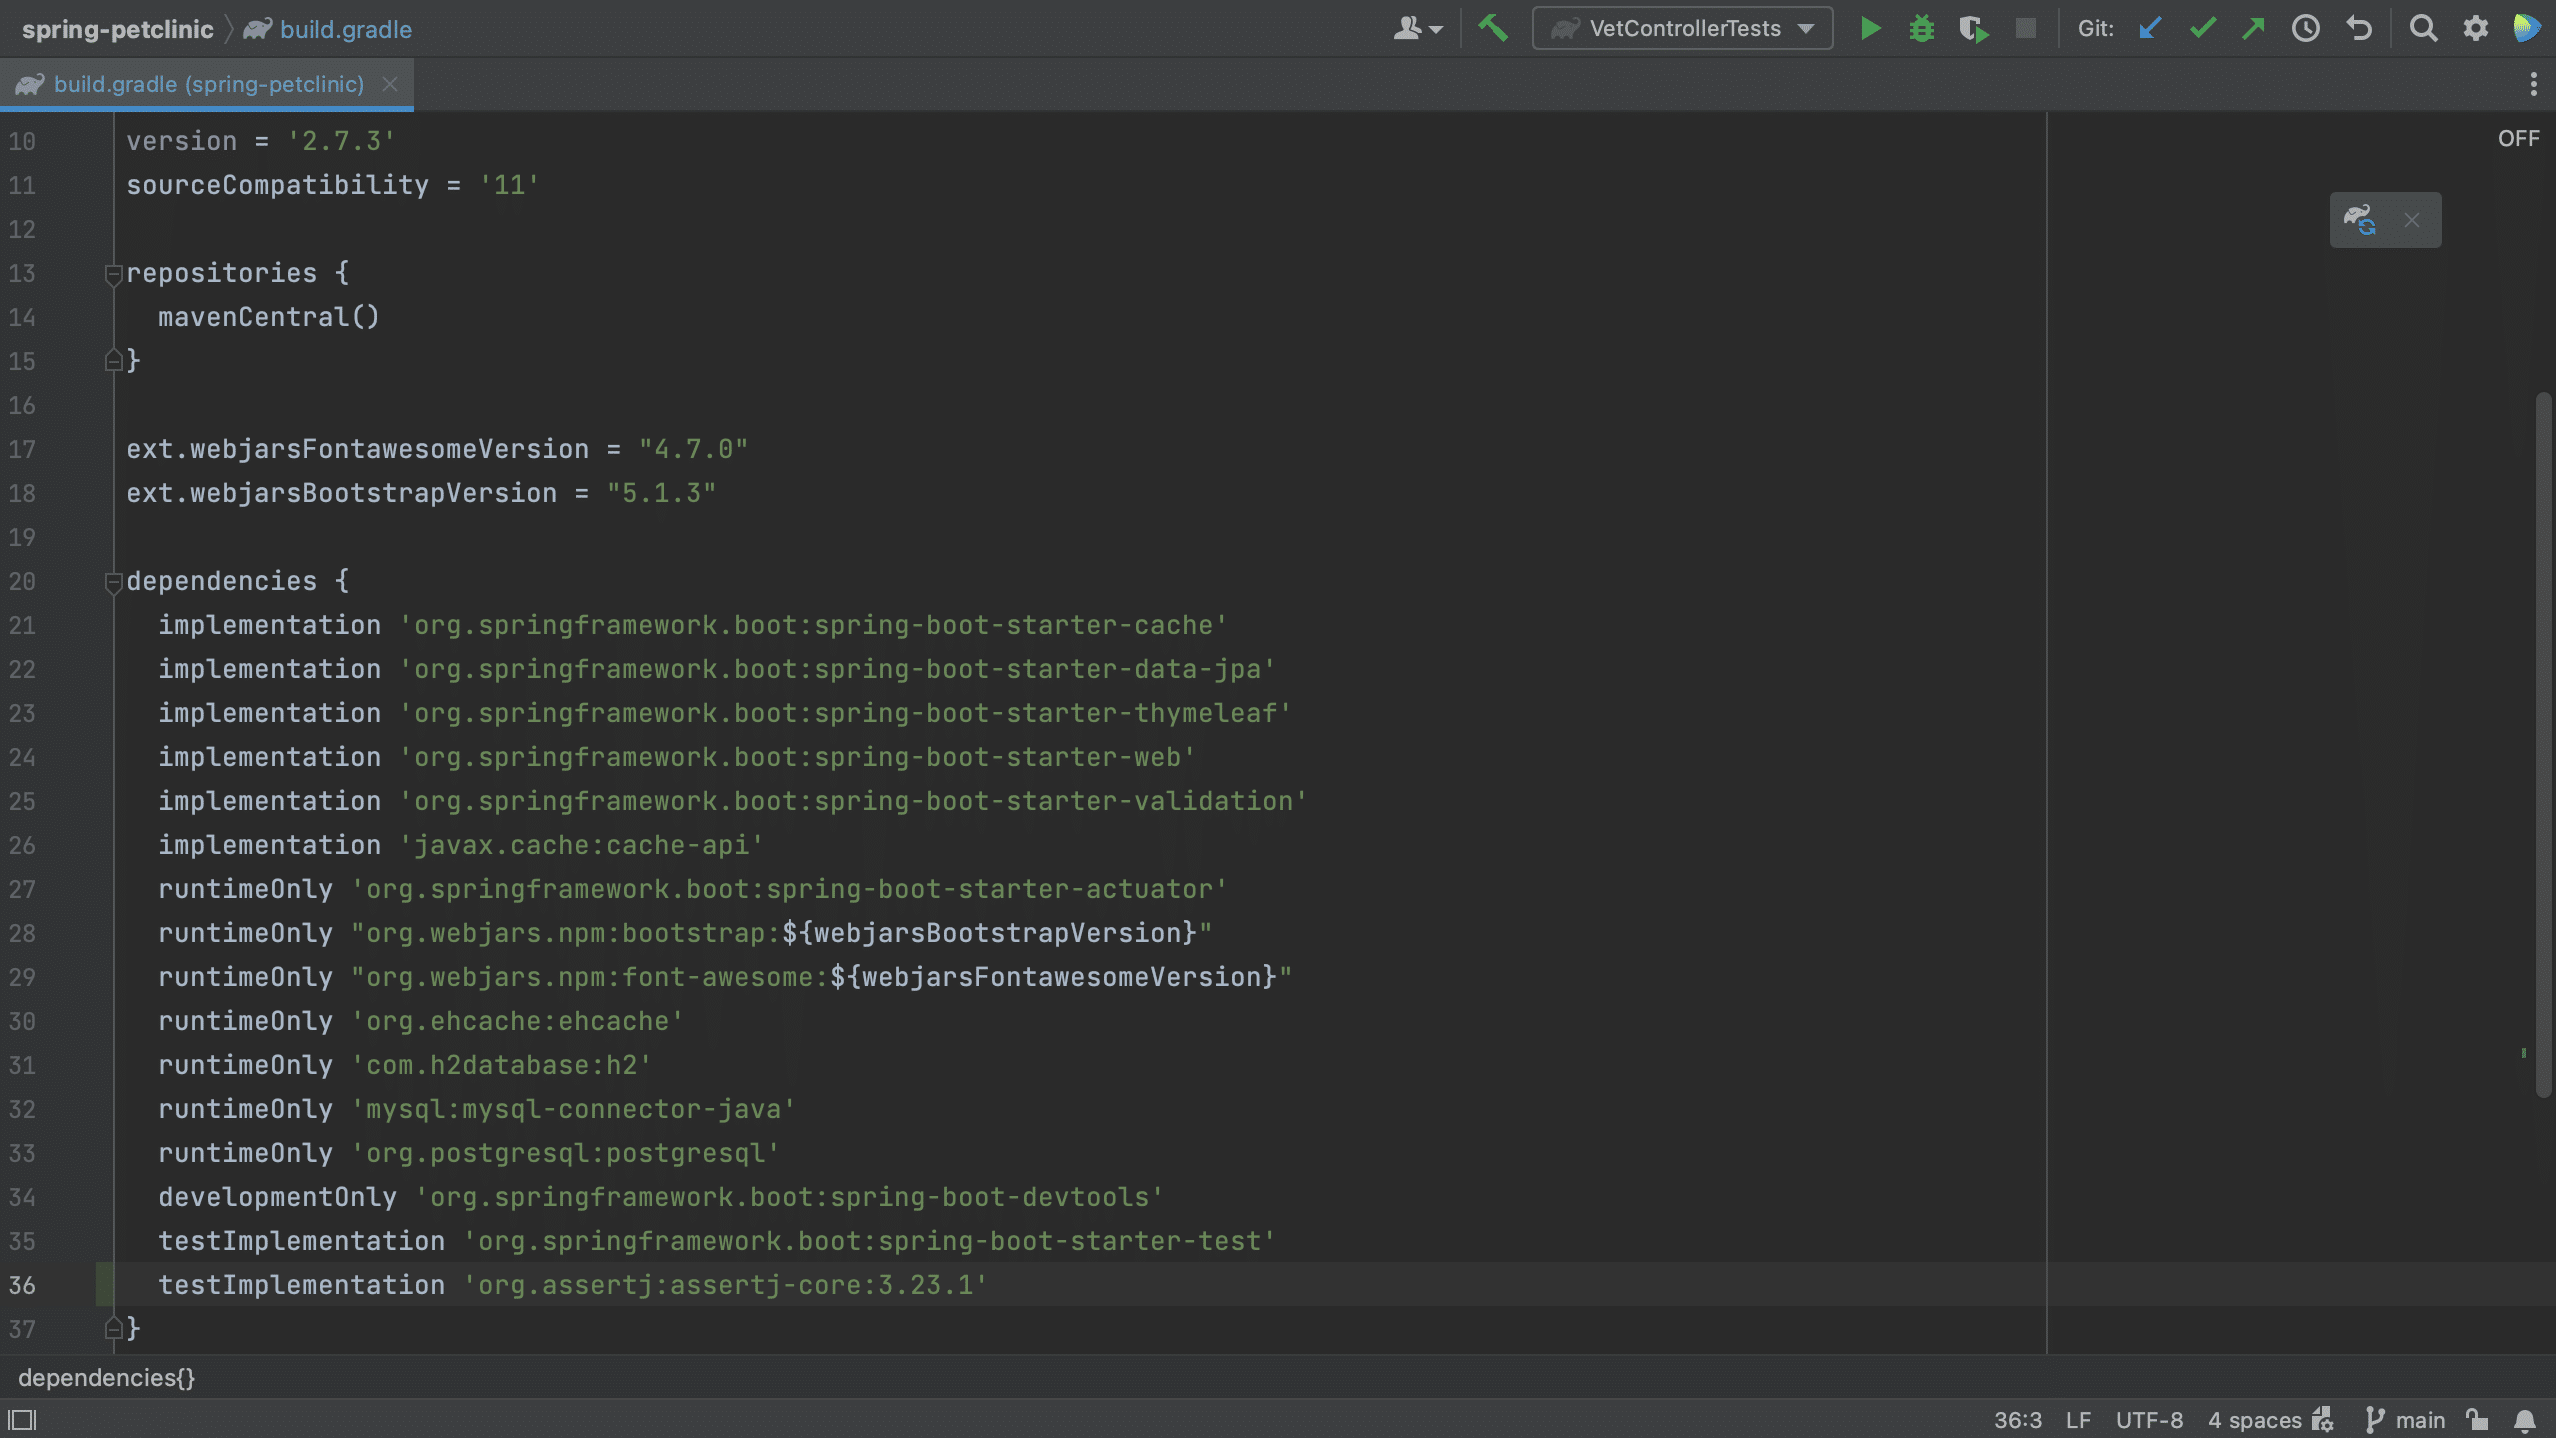
For example, we can copy the Gradle format for this dependency and paste it into our build.gradle file.
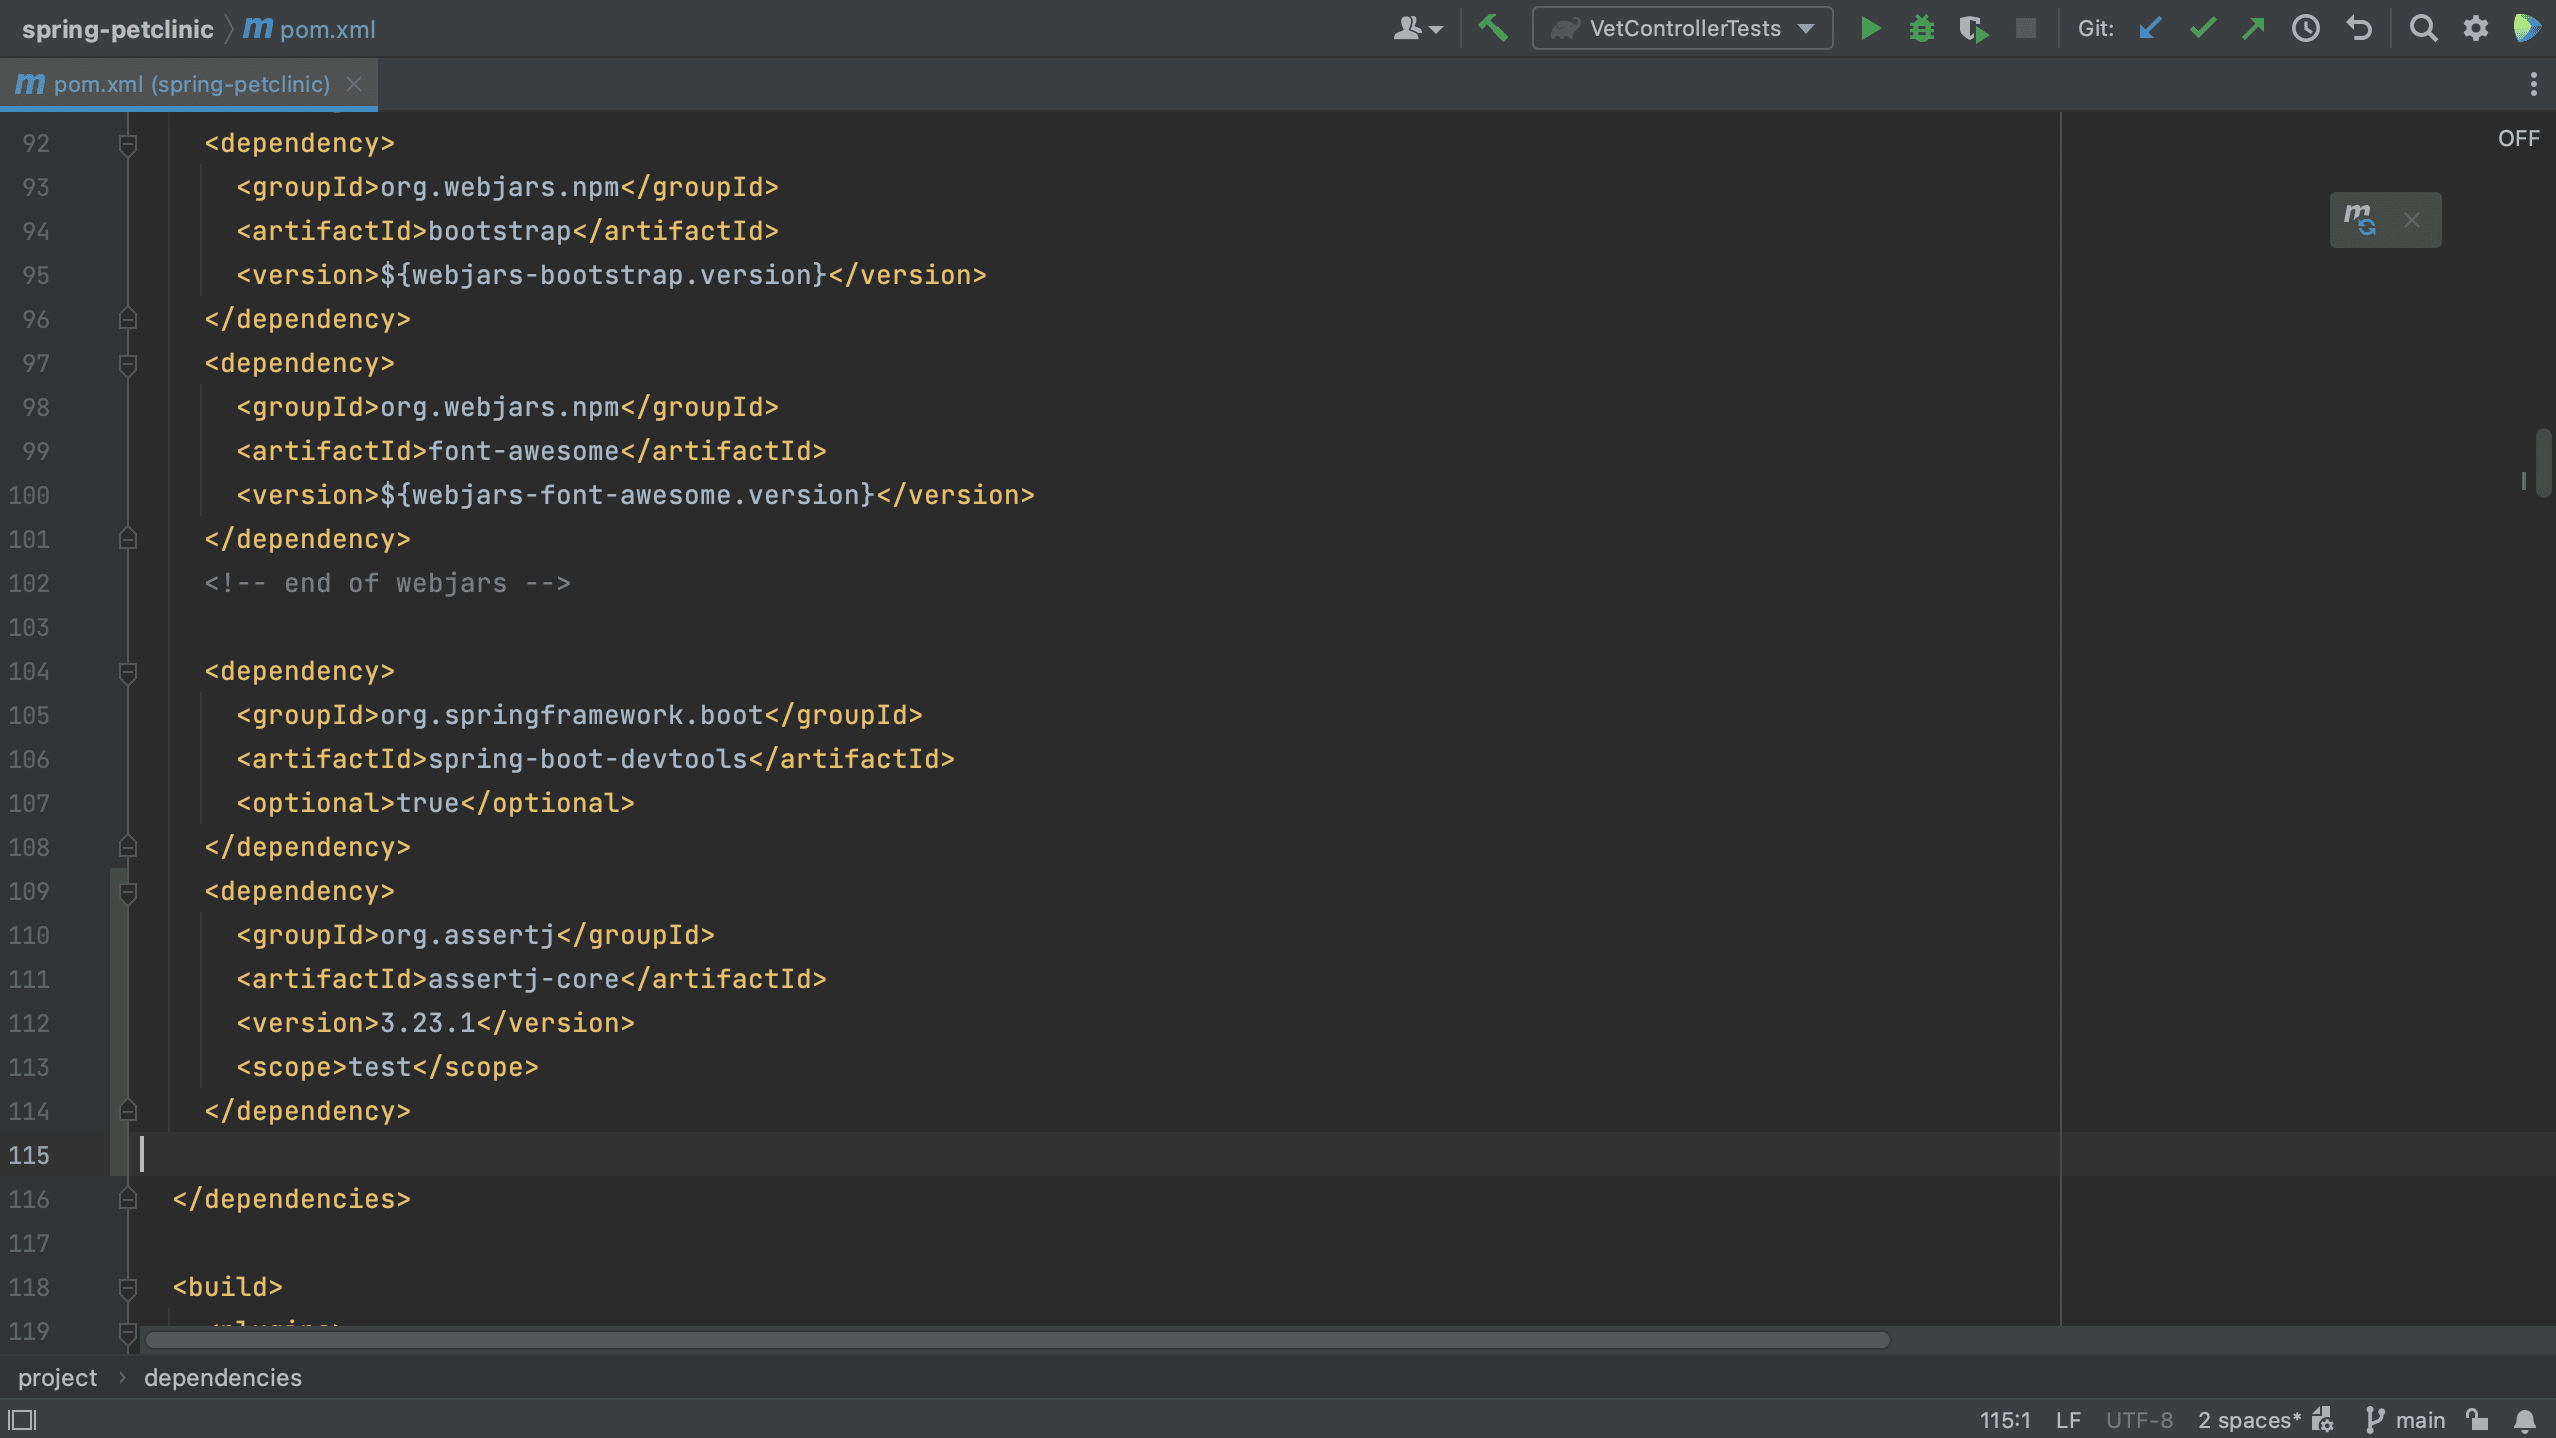
Or, if we are using Maven, we can copy the Maven xml format into our pom.xml.
Did you know that if you copy-paste a Maven XML dependency into your build.gradle file, IntelliJ IDEA automatically turns it into the correct format for Gradle?
From the build file using code completion
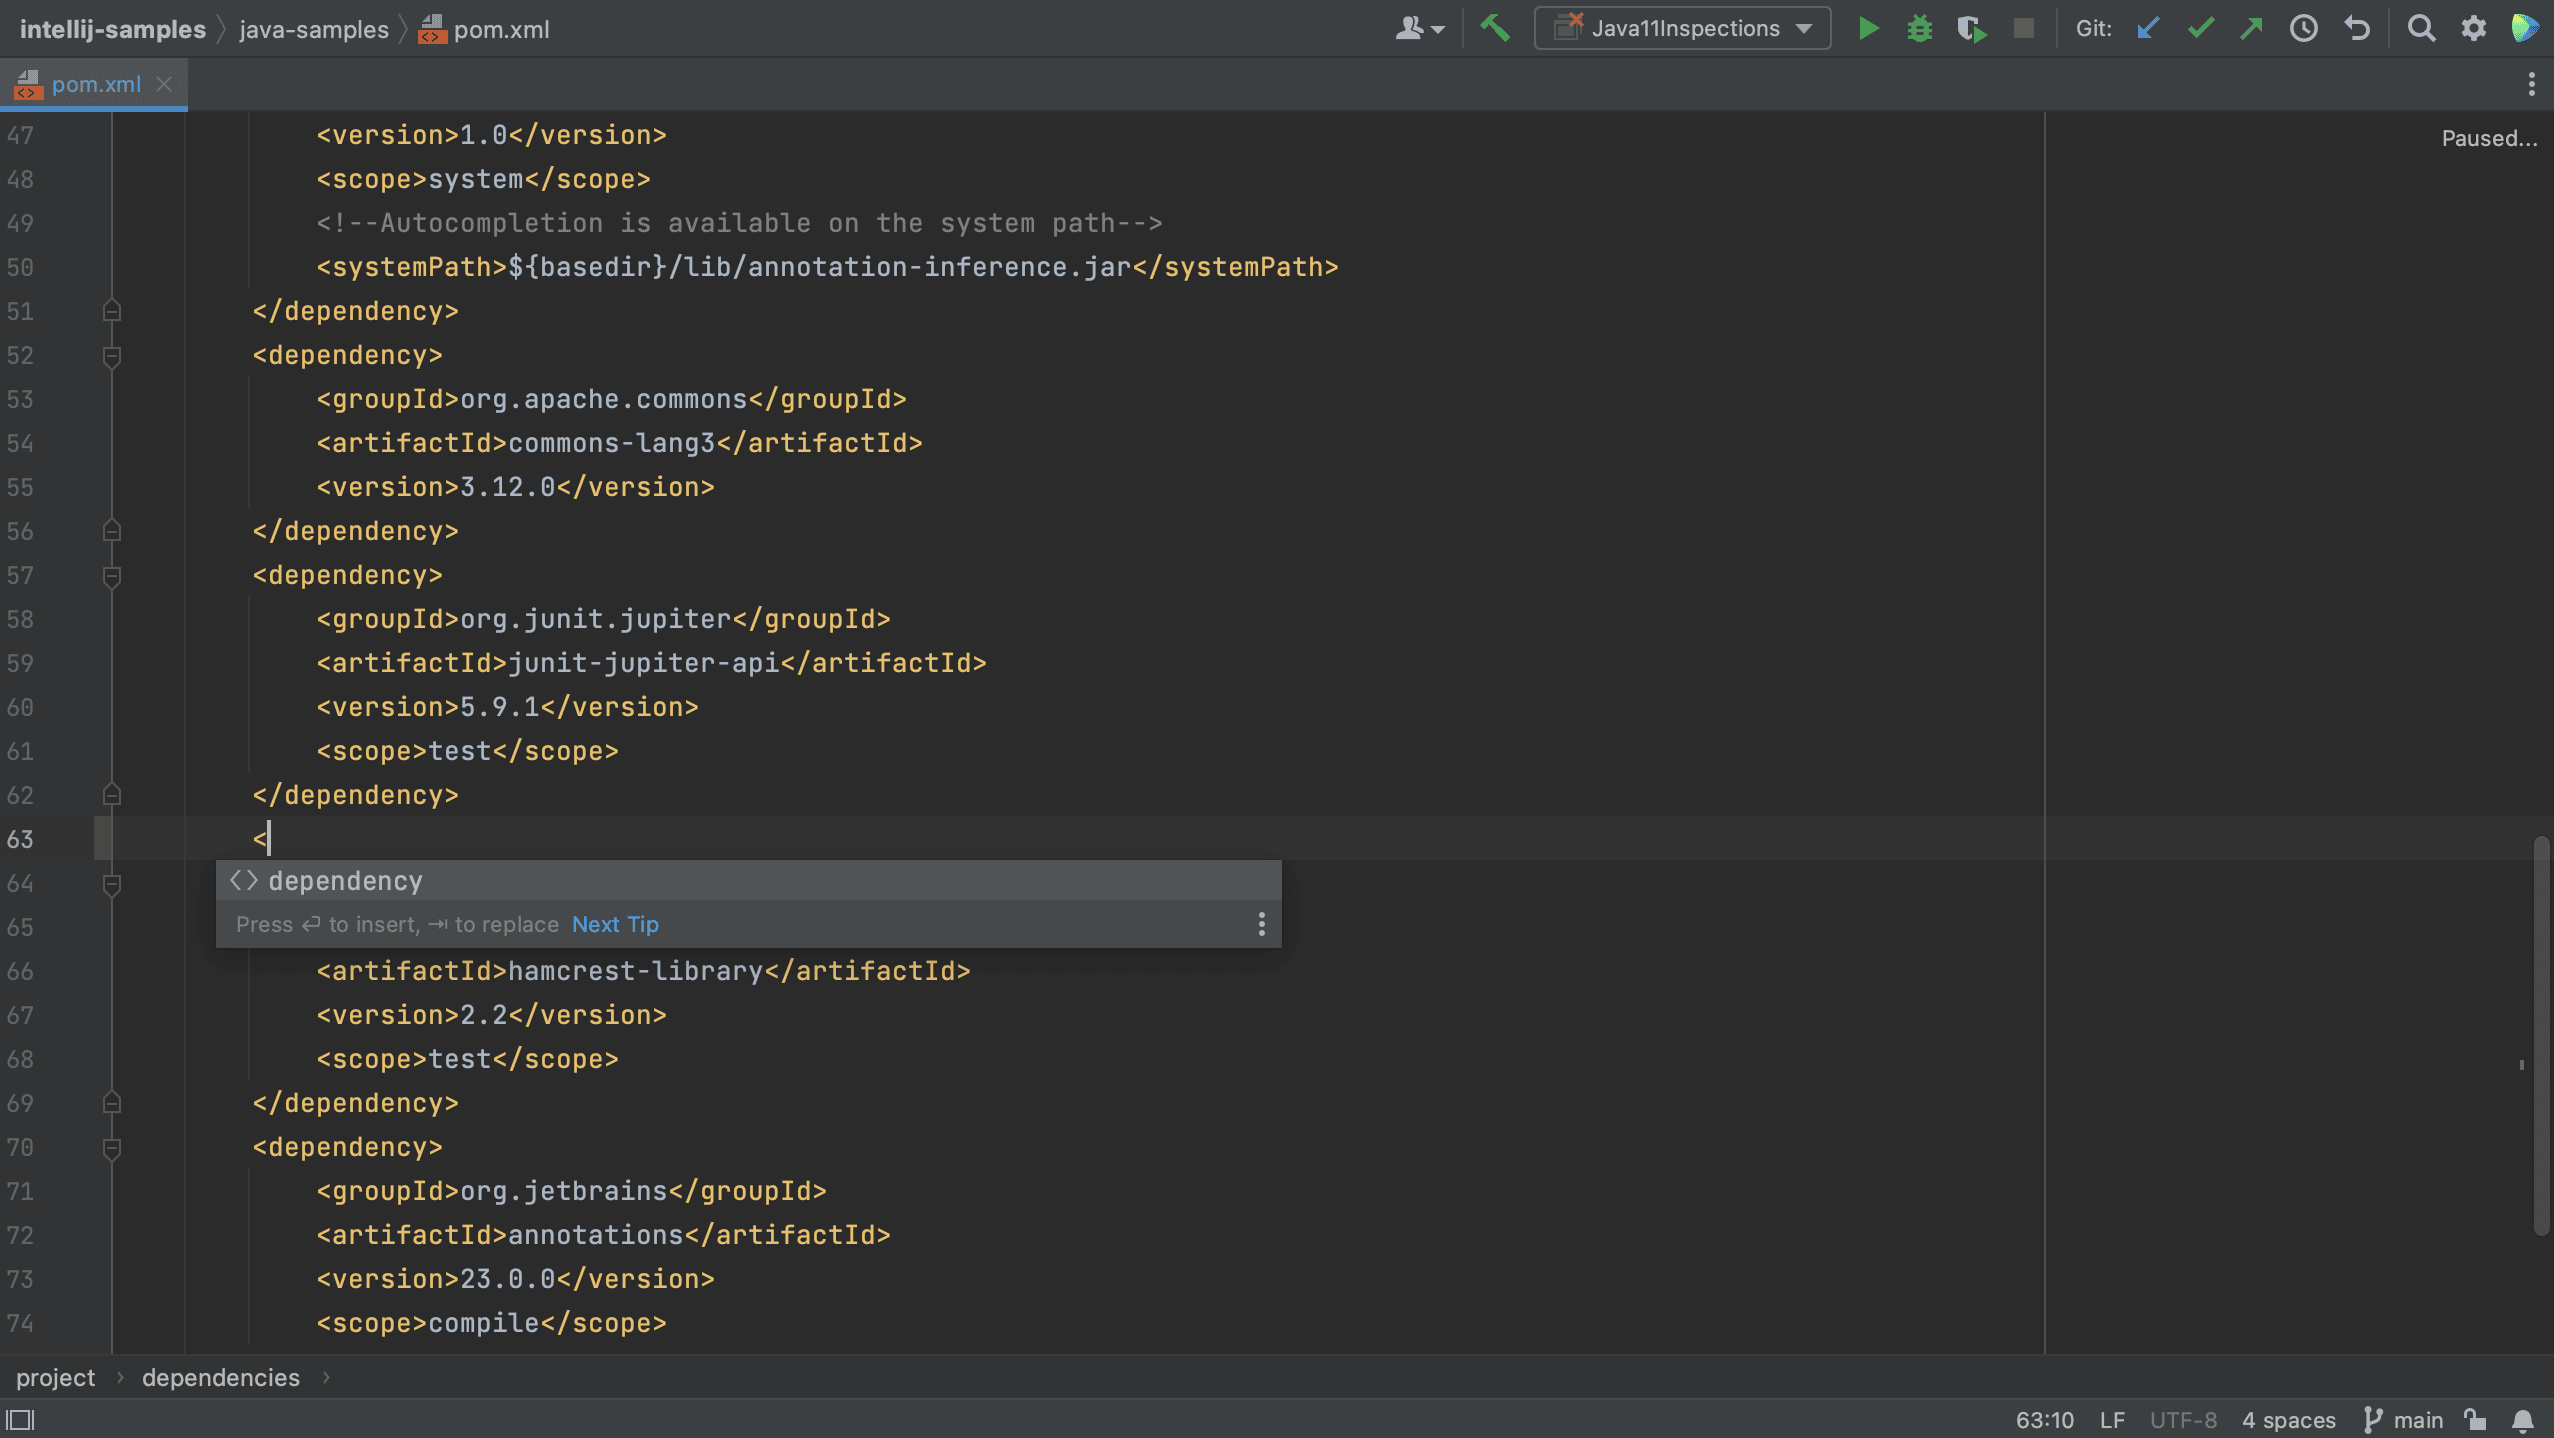
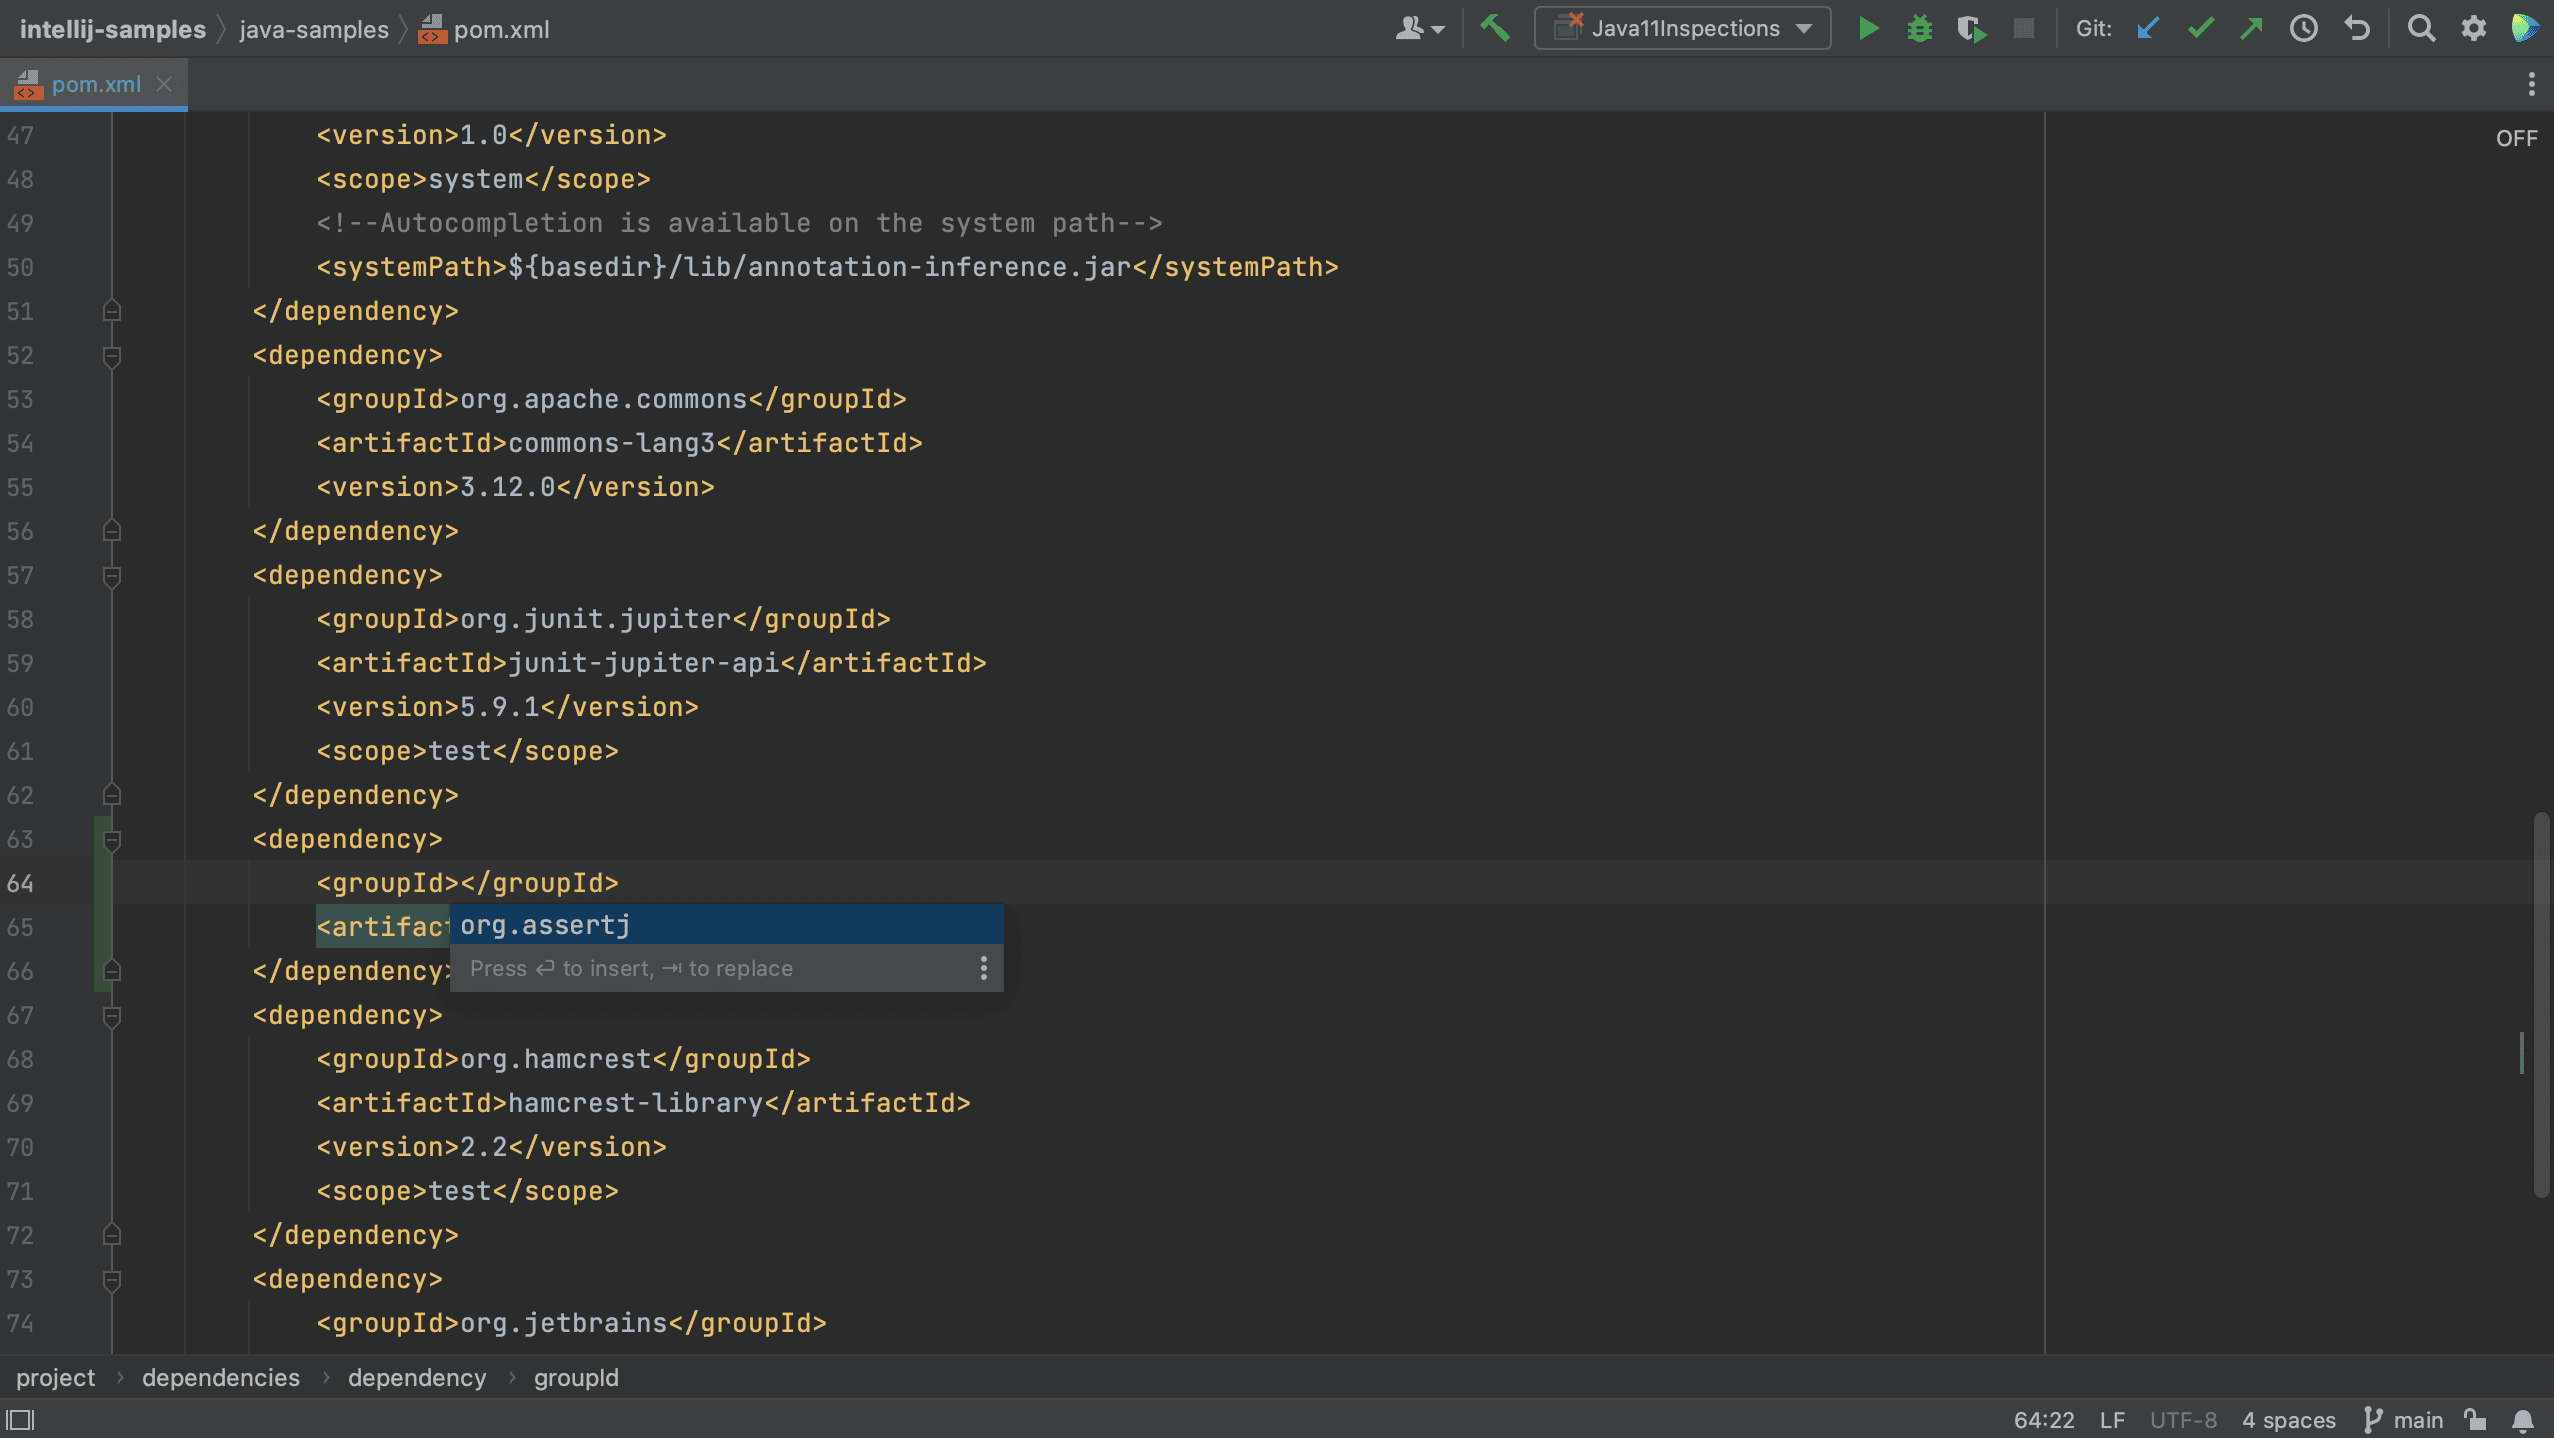
We can also add dependencies to our build file using code completion. For example, let’s add a new dependency to our pom.xml.
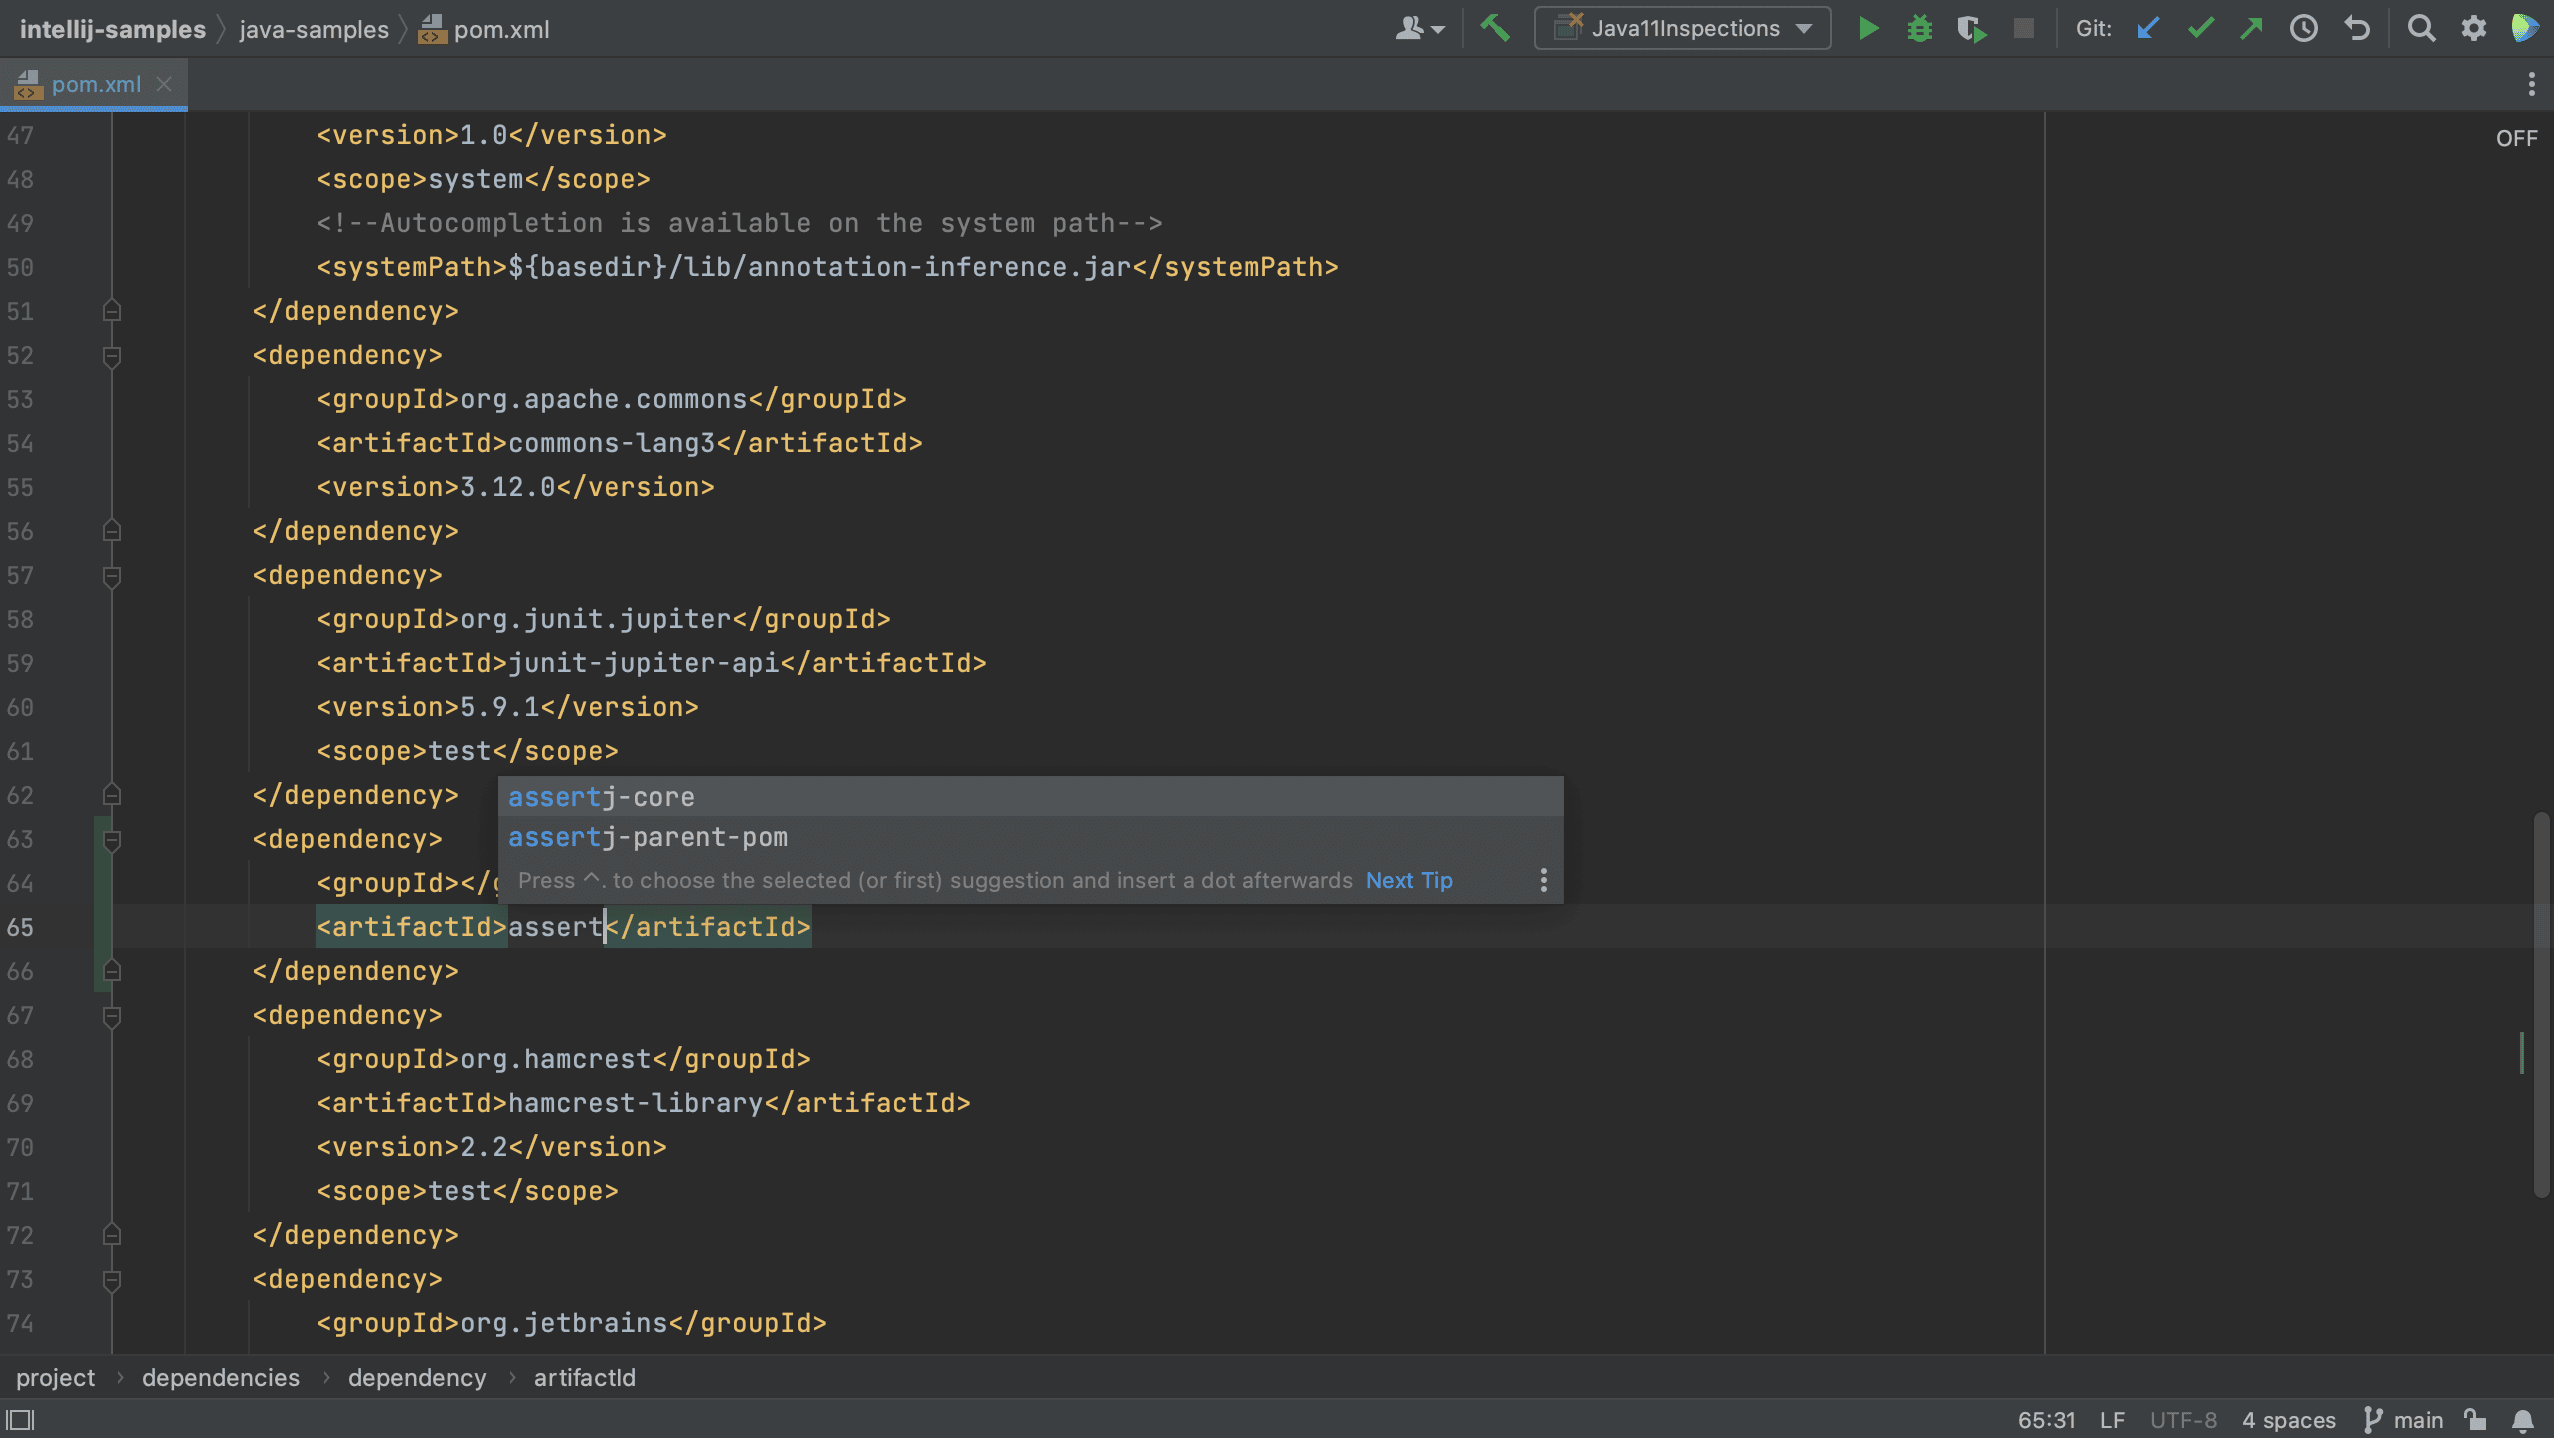
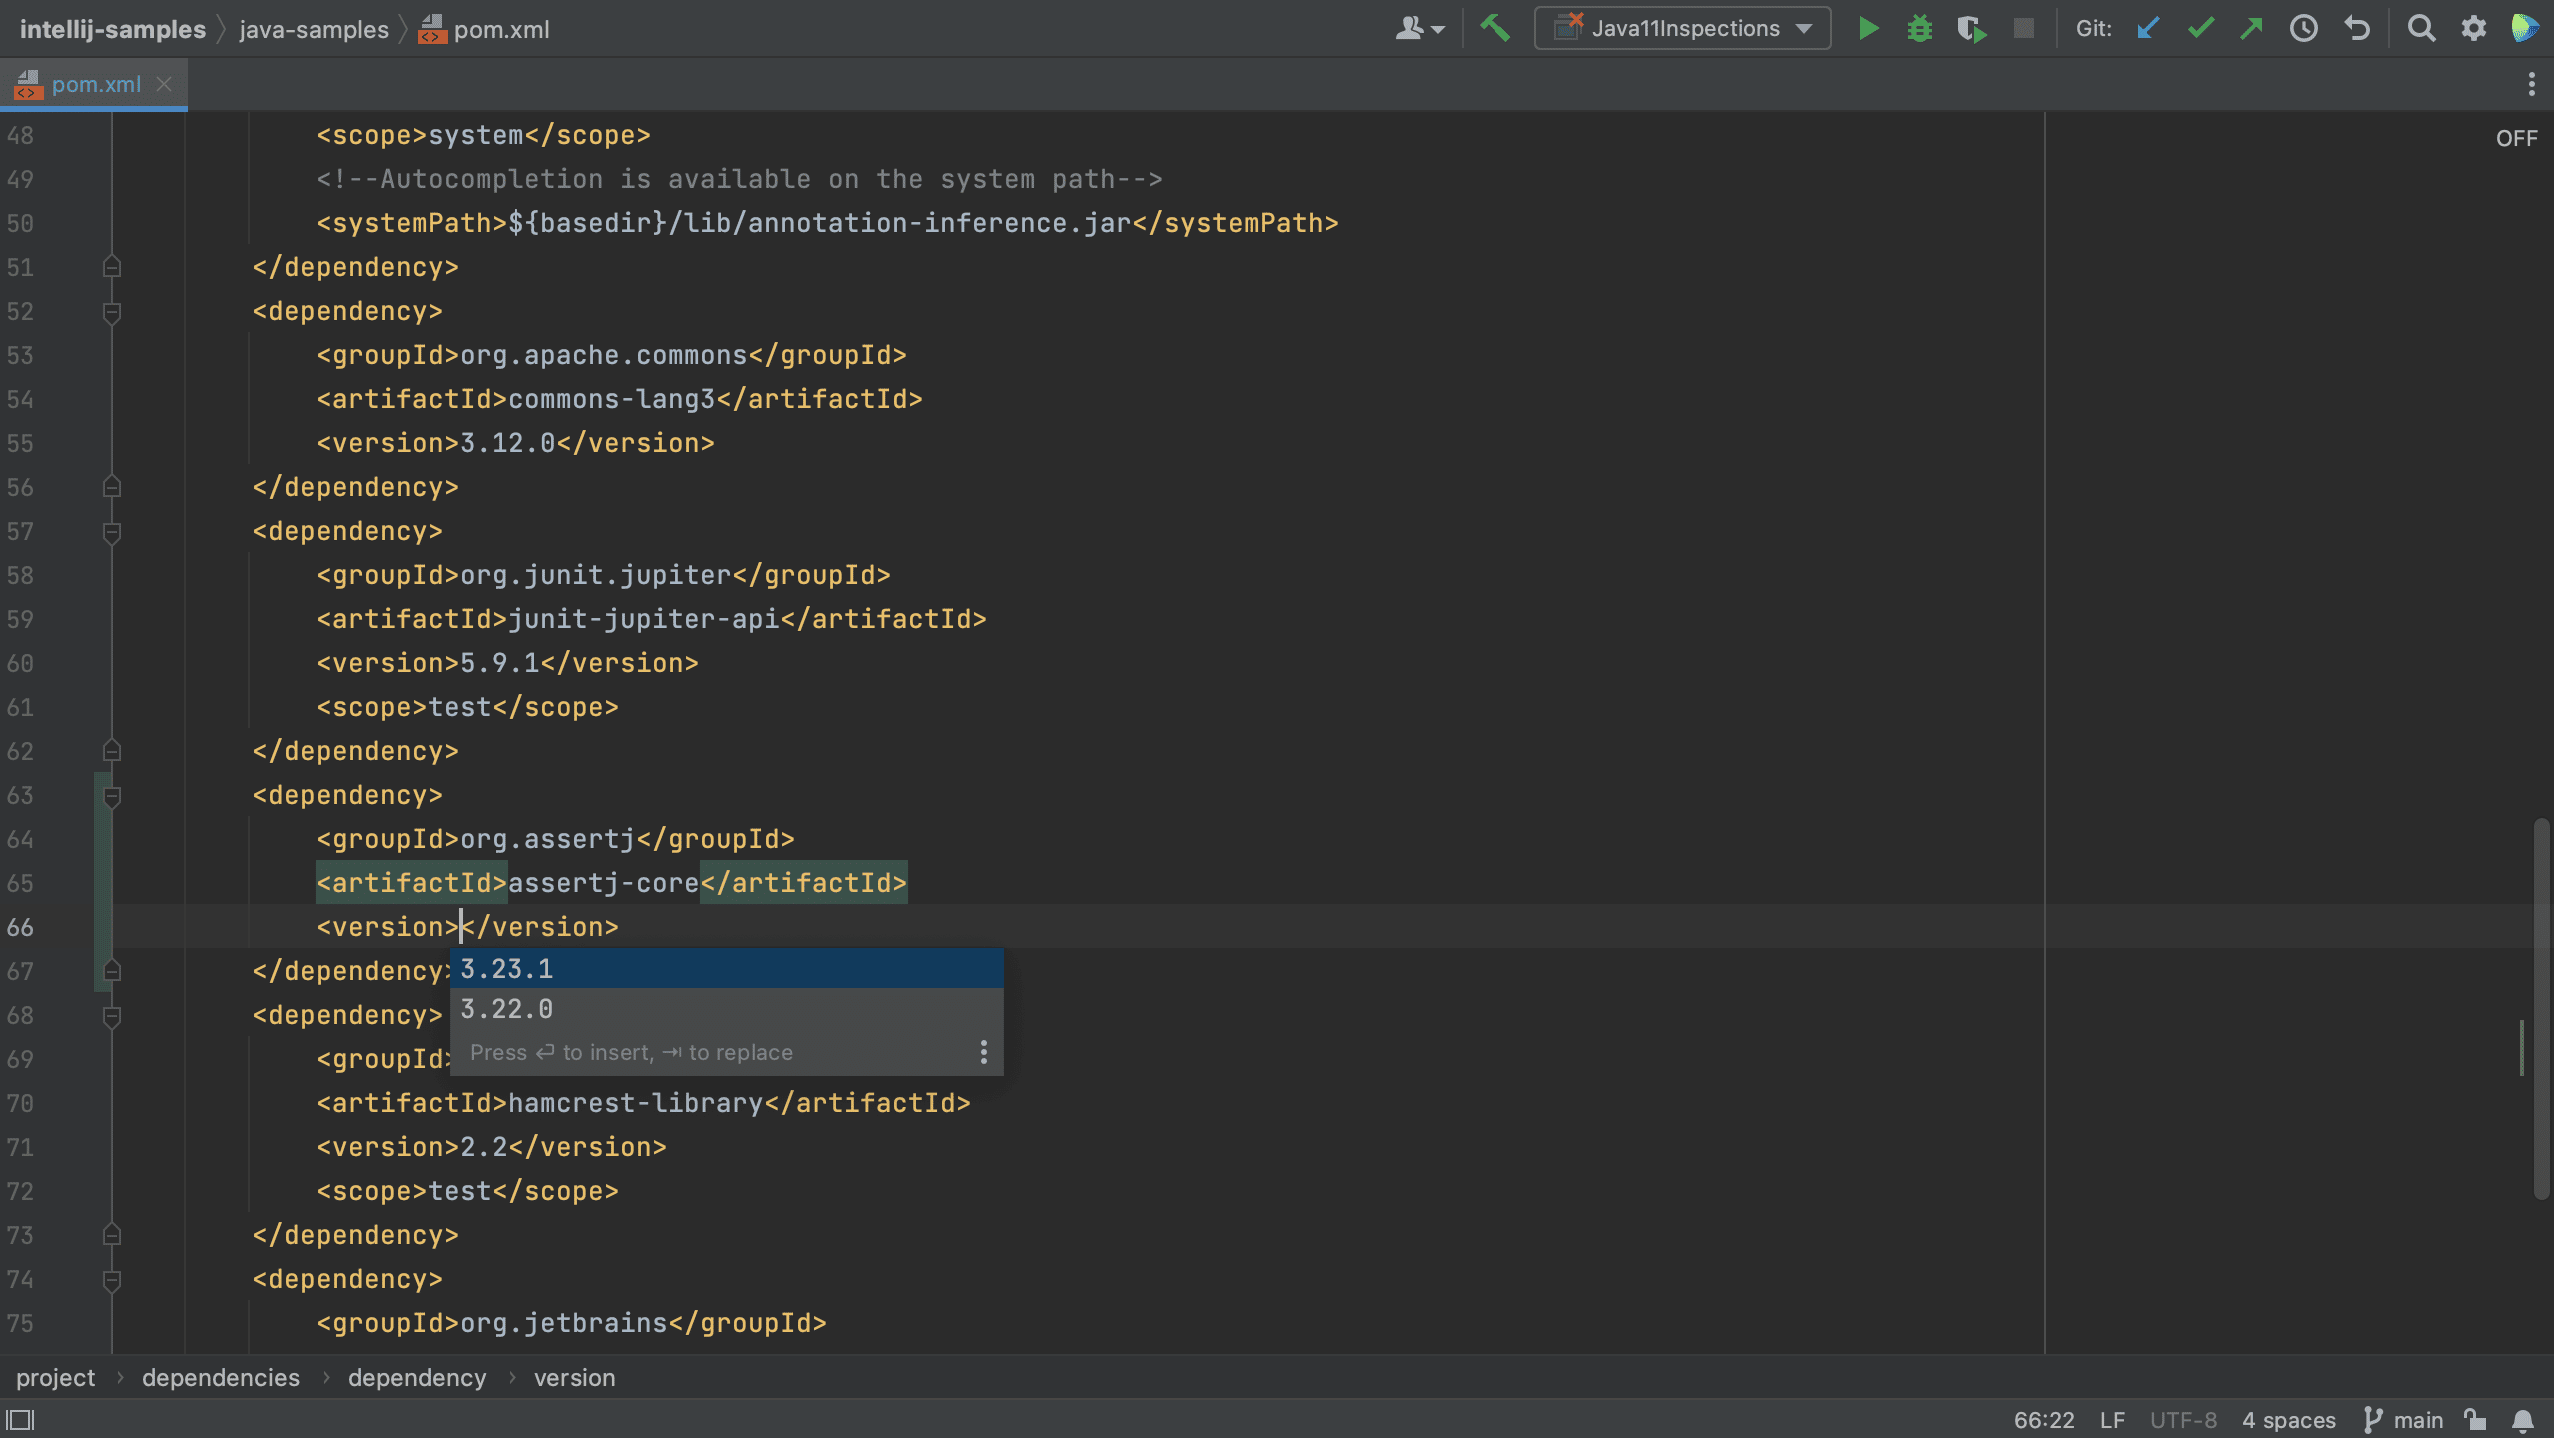
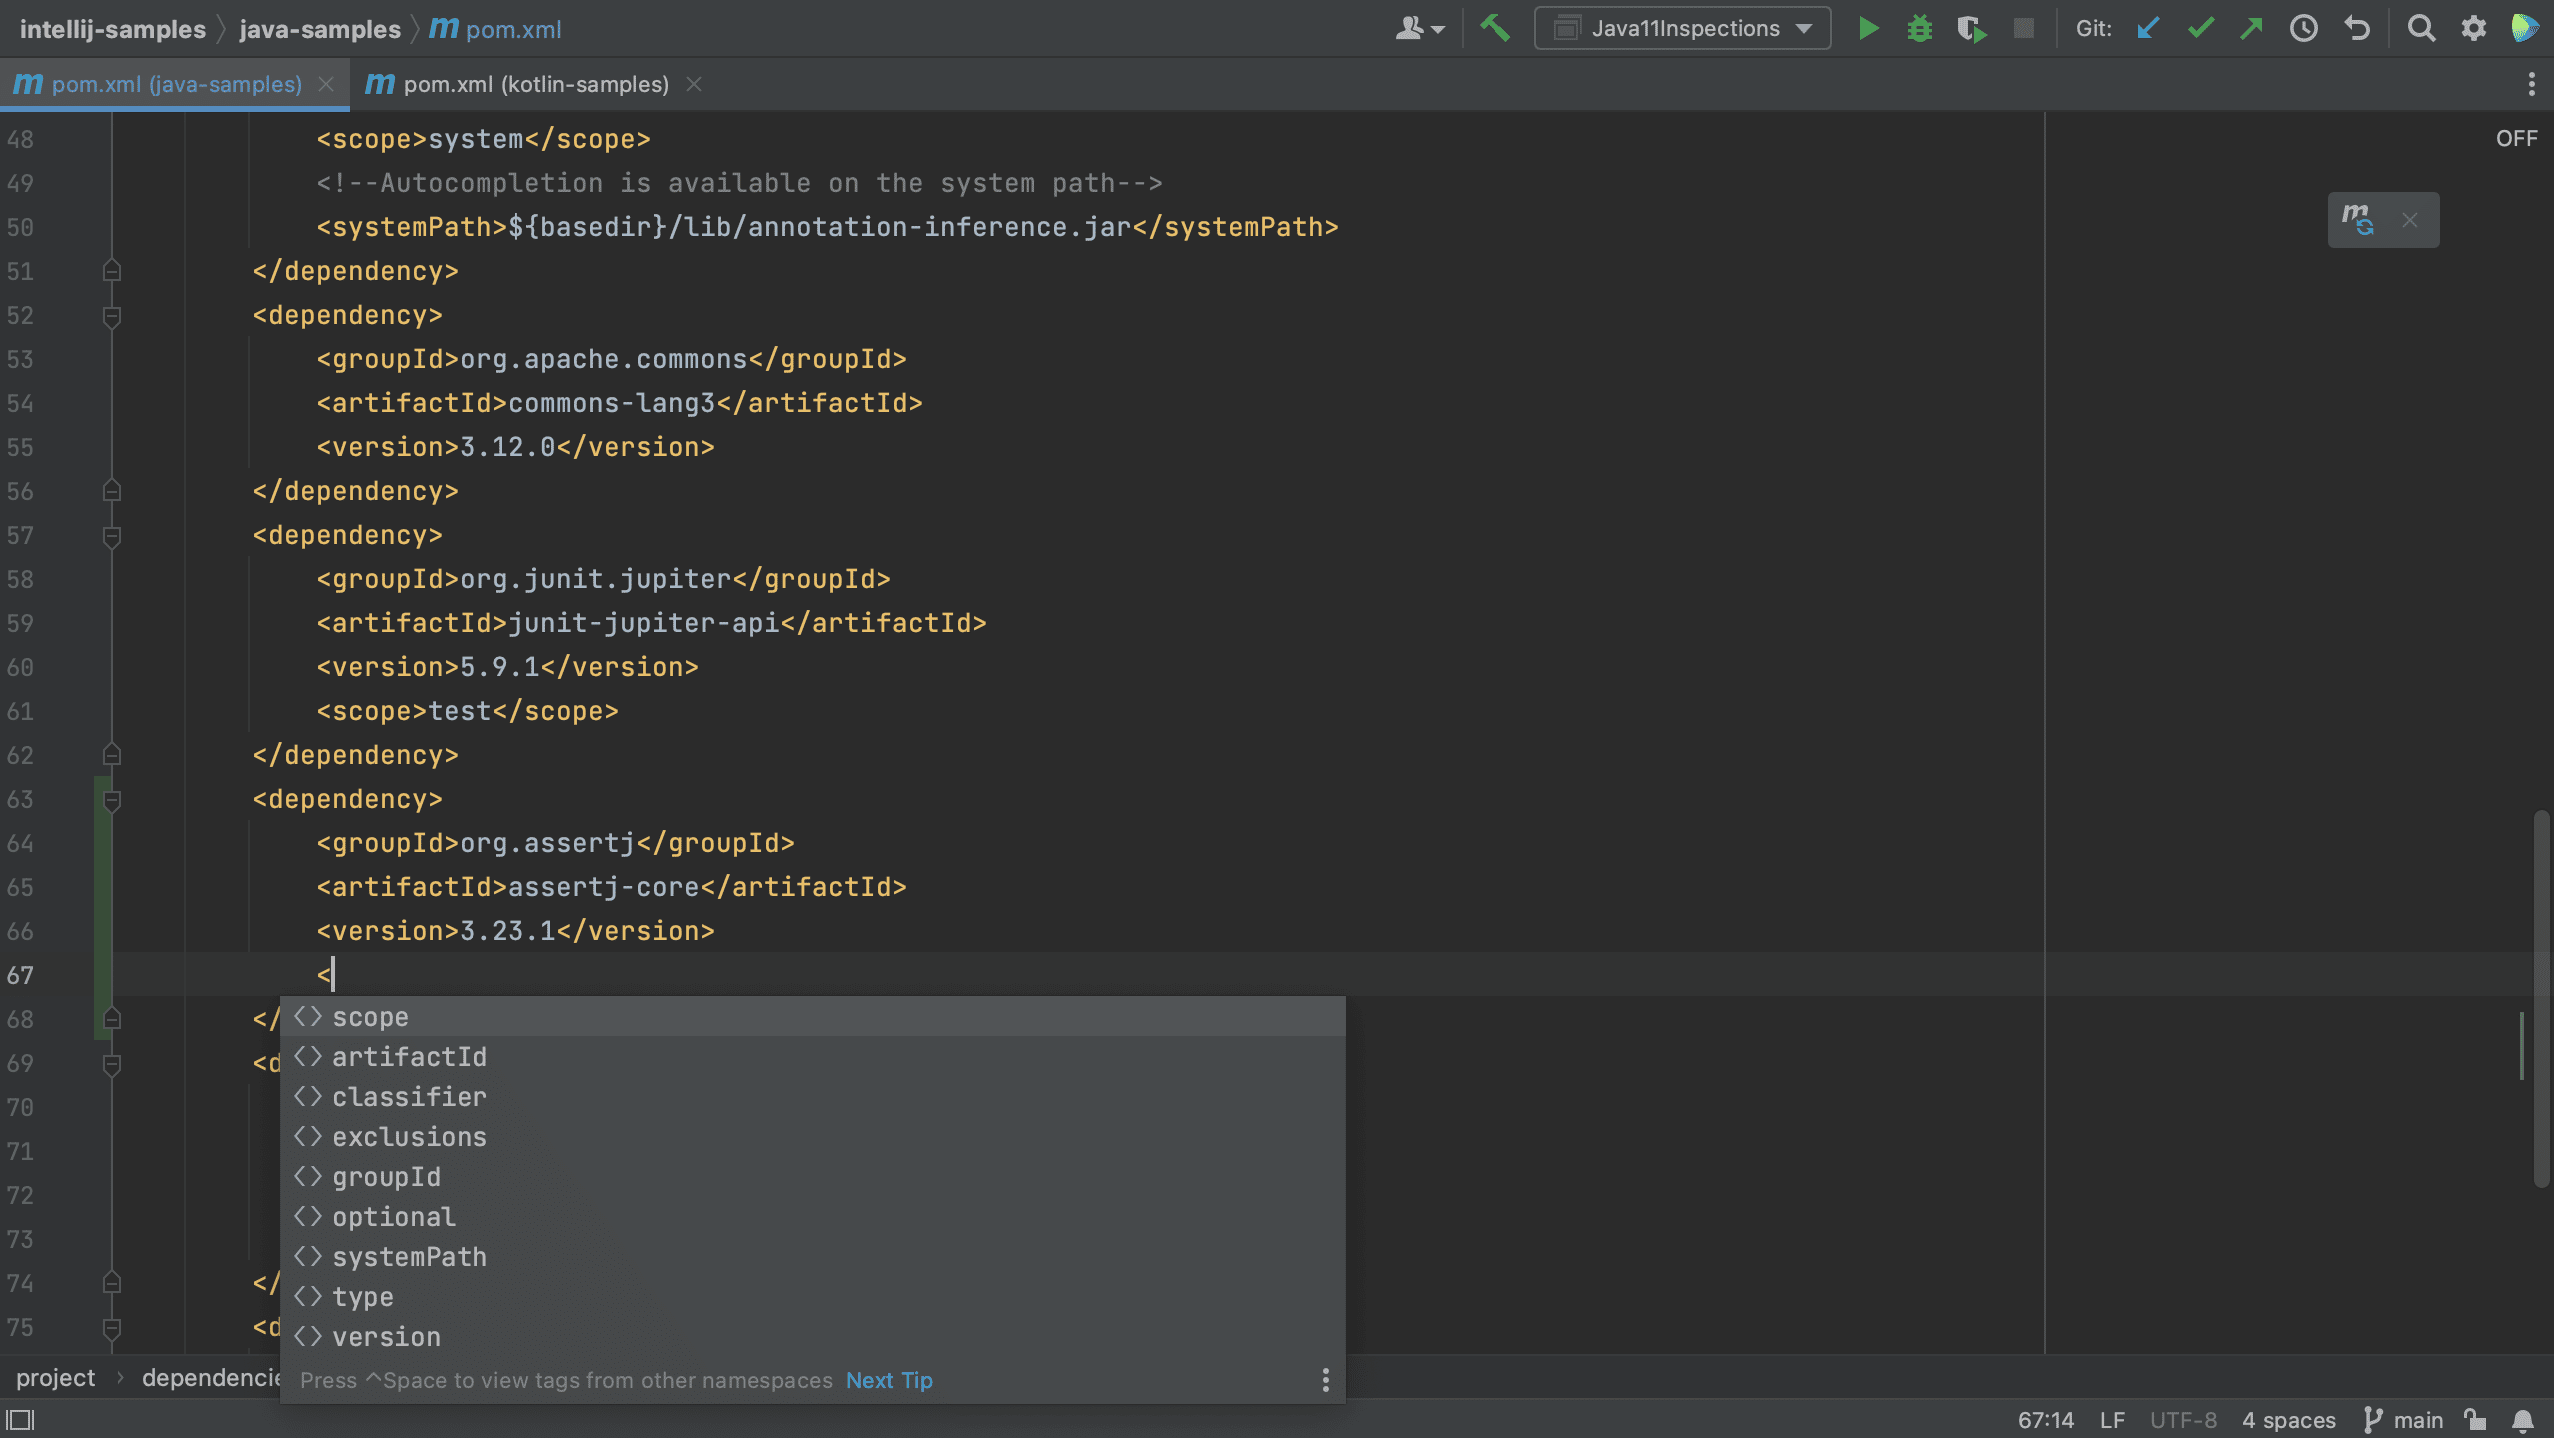
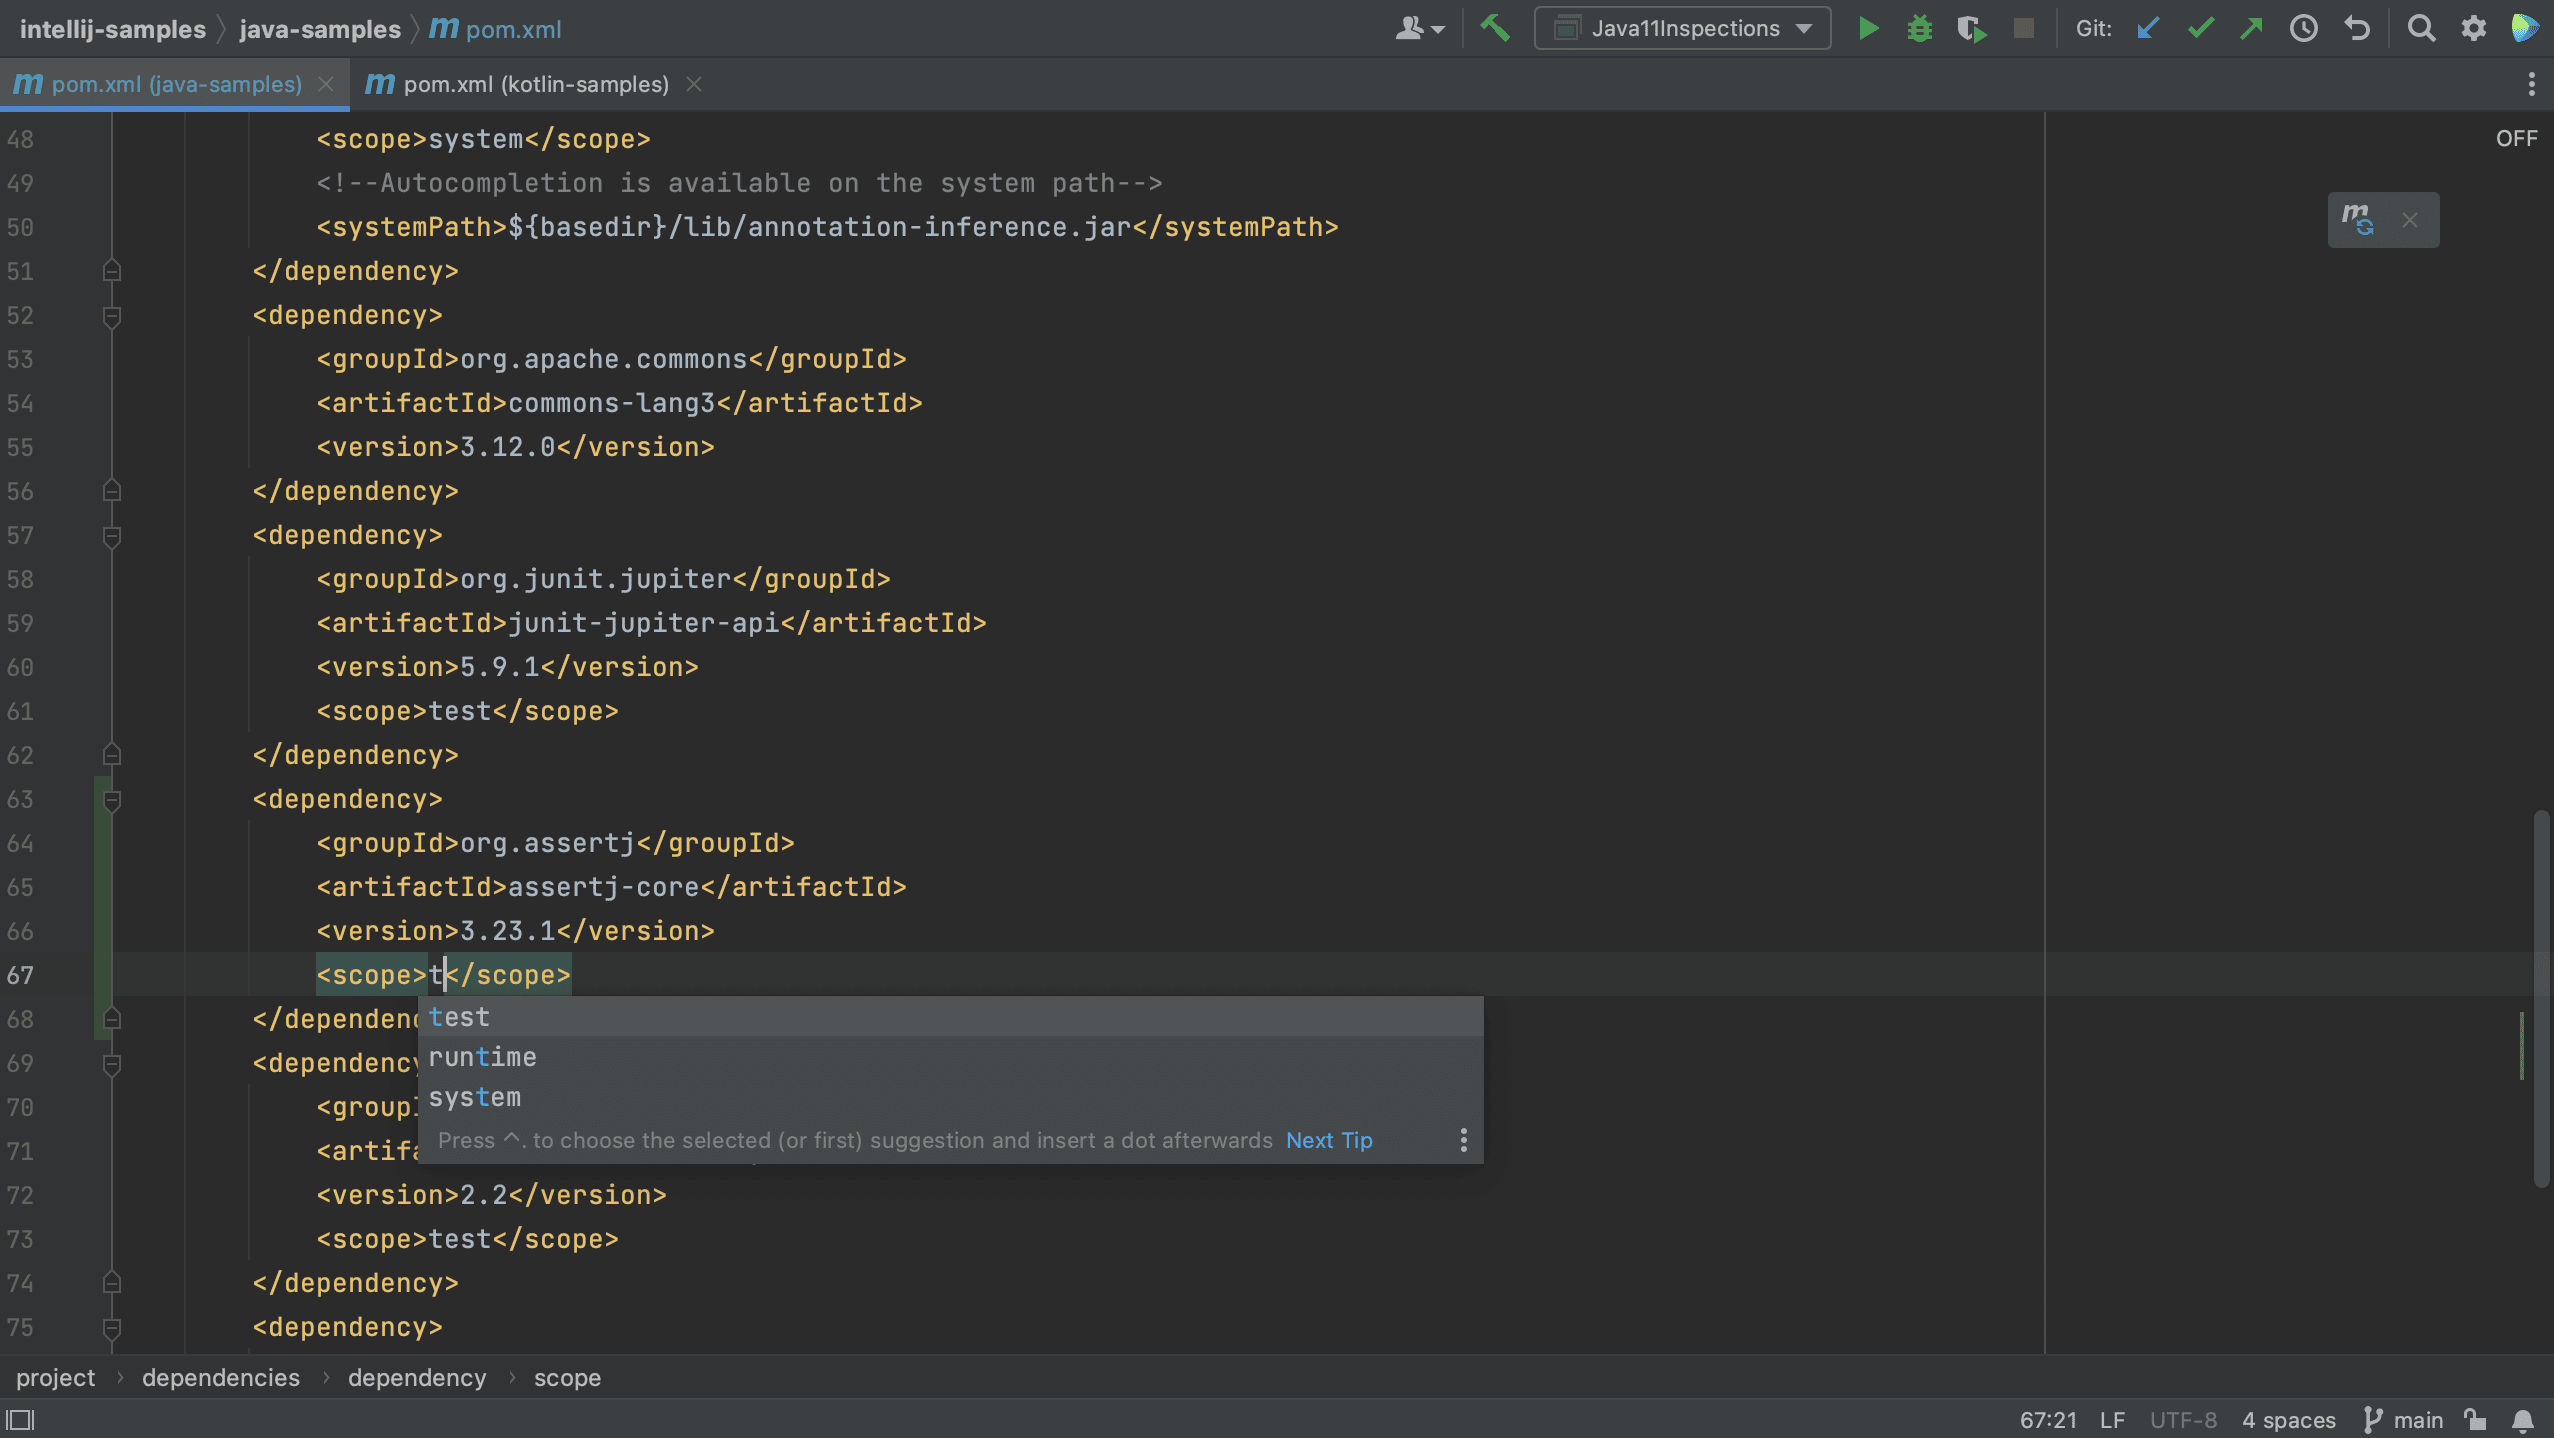
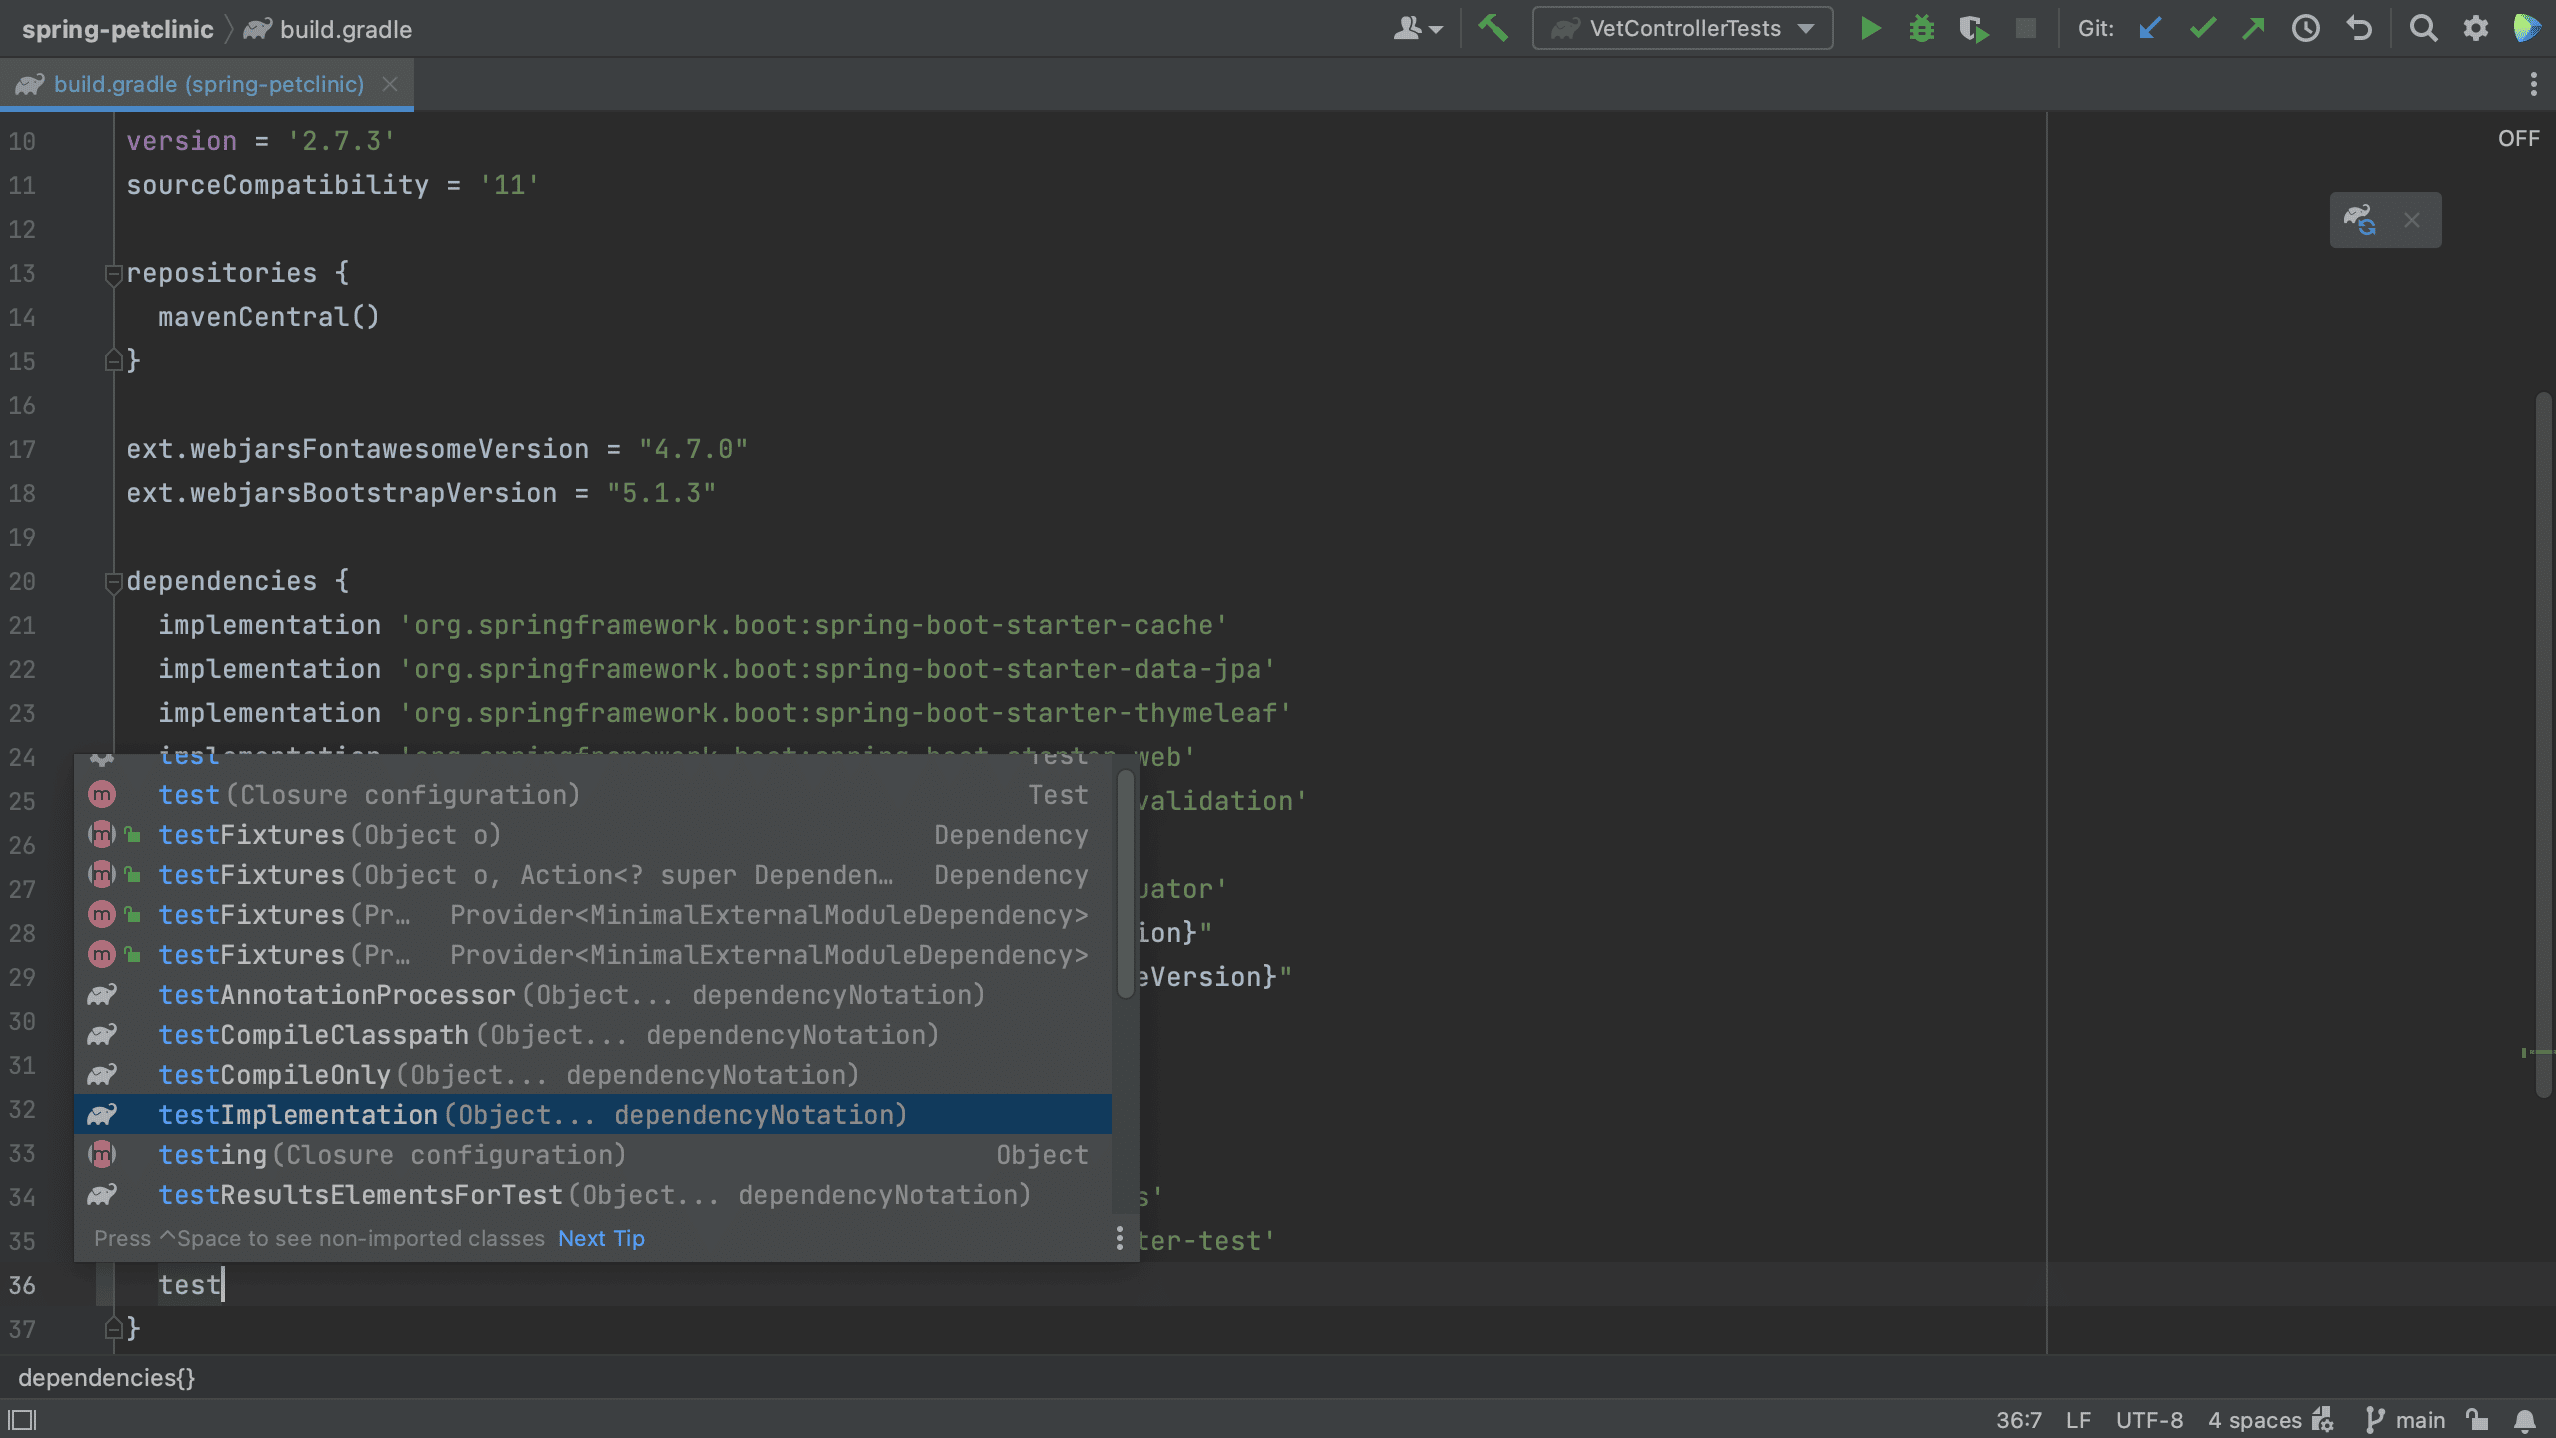
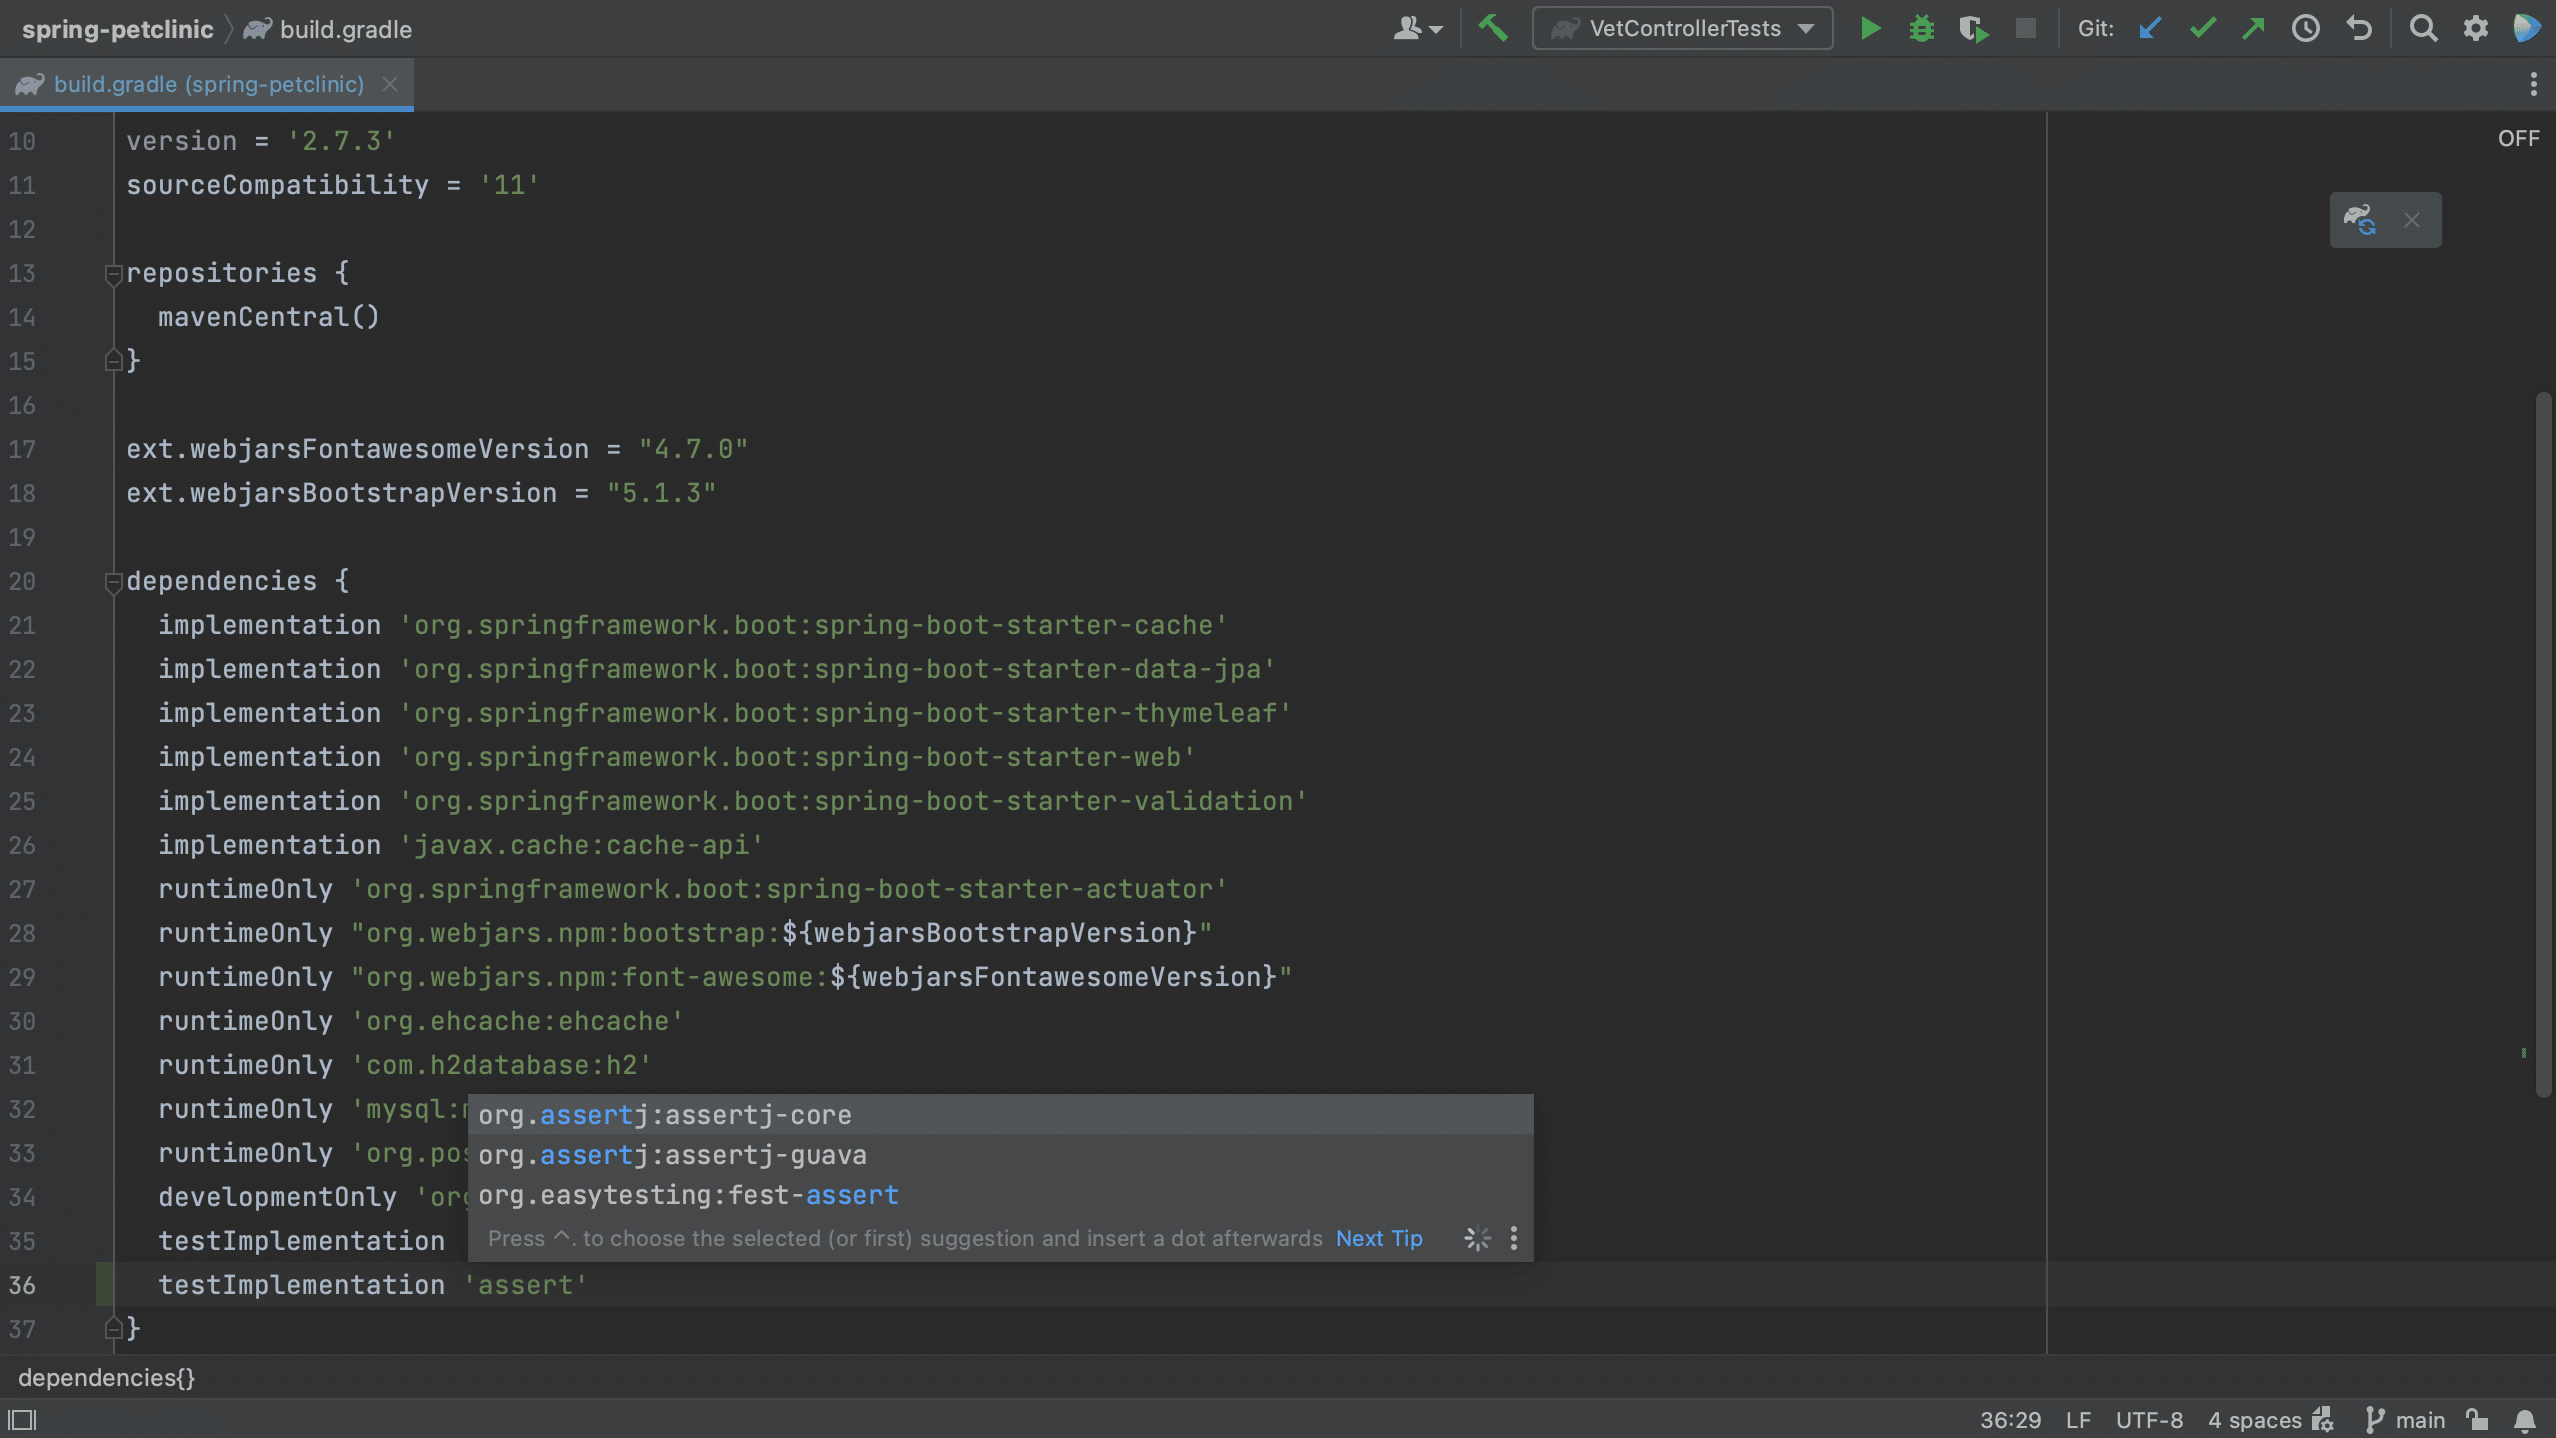
We see that IntelliJ IDEA autocompletes the dependency xml, and we can search for the dependency we want, in this example AssertJ. If needed, the version number will also be added. Since this is a test dependency, we need to add the test scope, still using code completion.
Code completion works in Gradle too, as you can see below.
From the build file using code generation
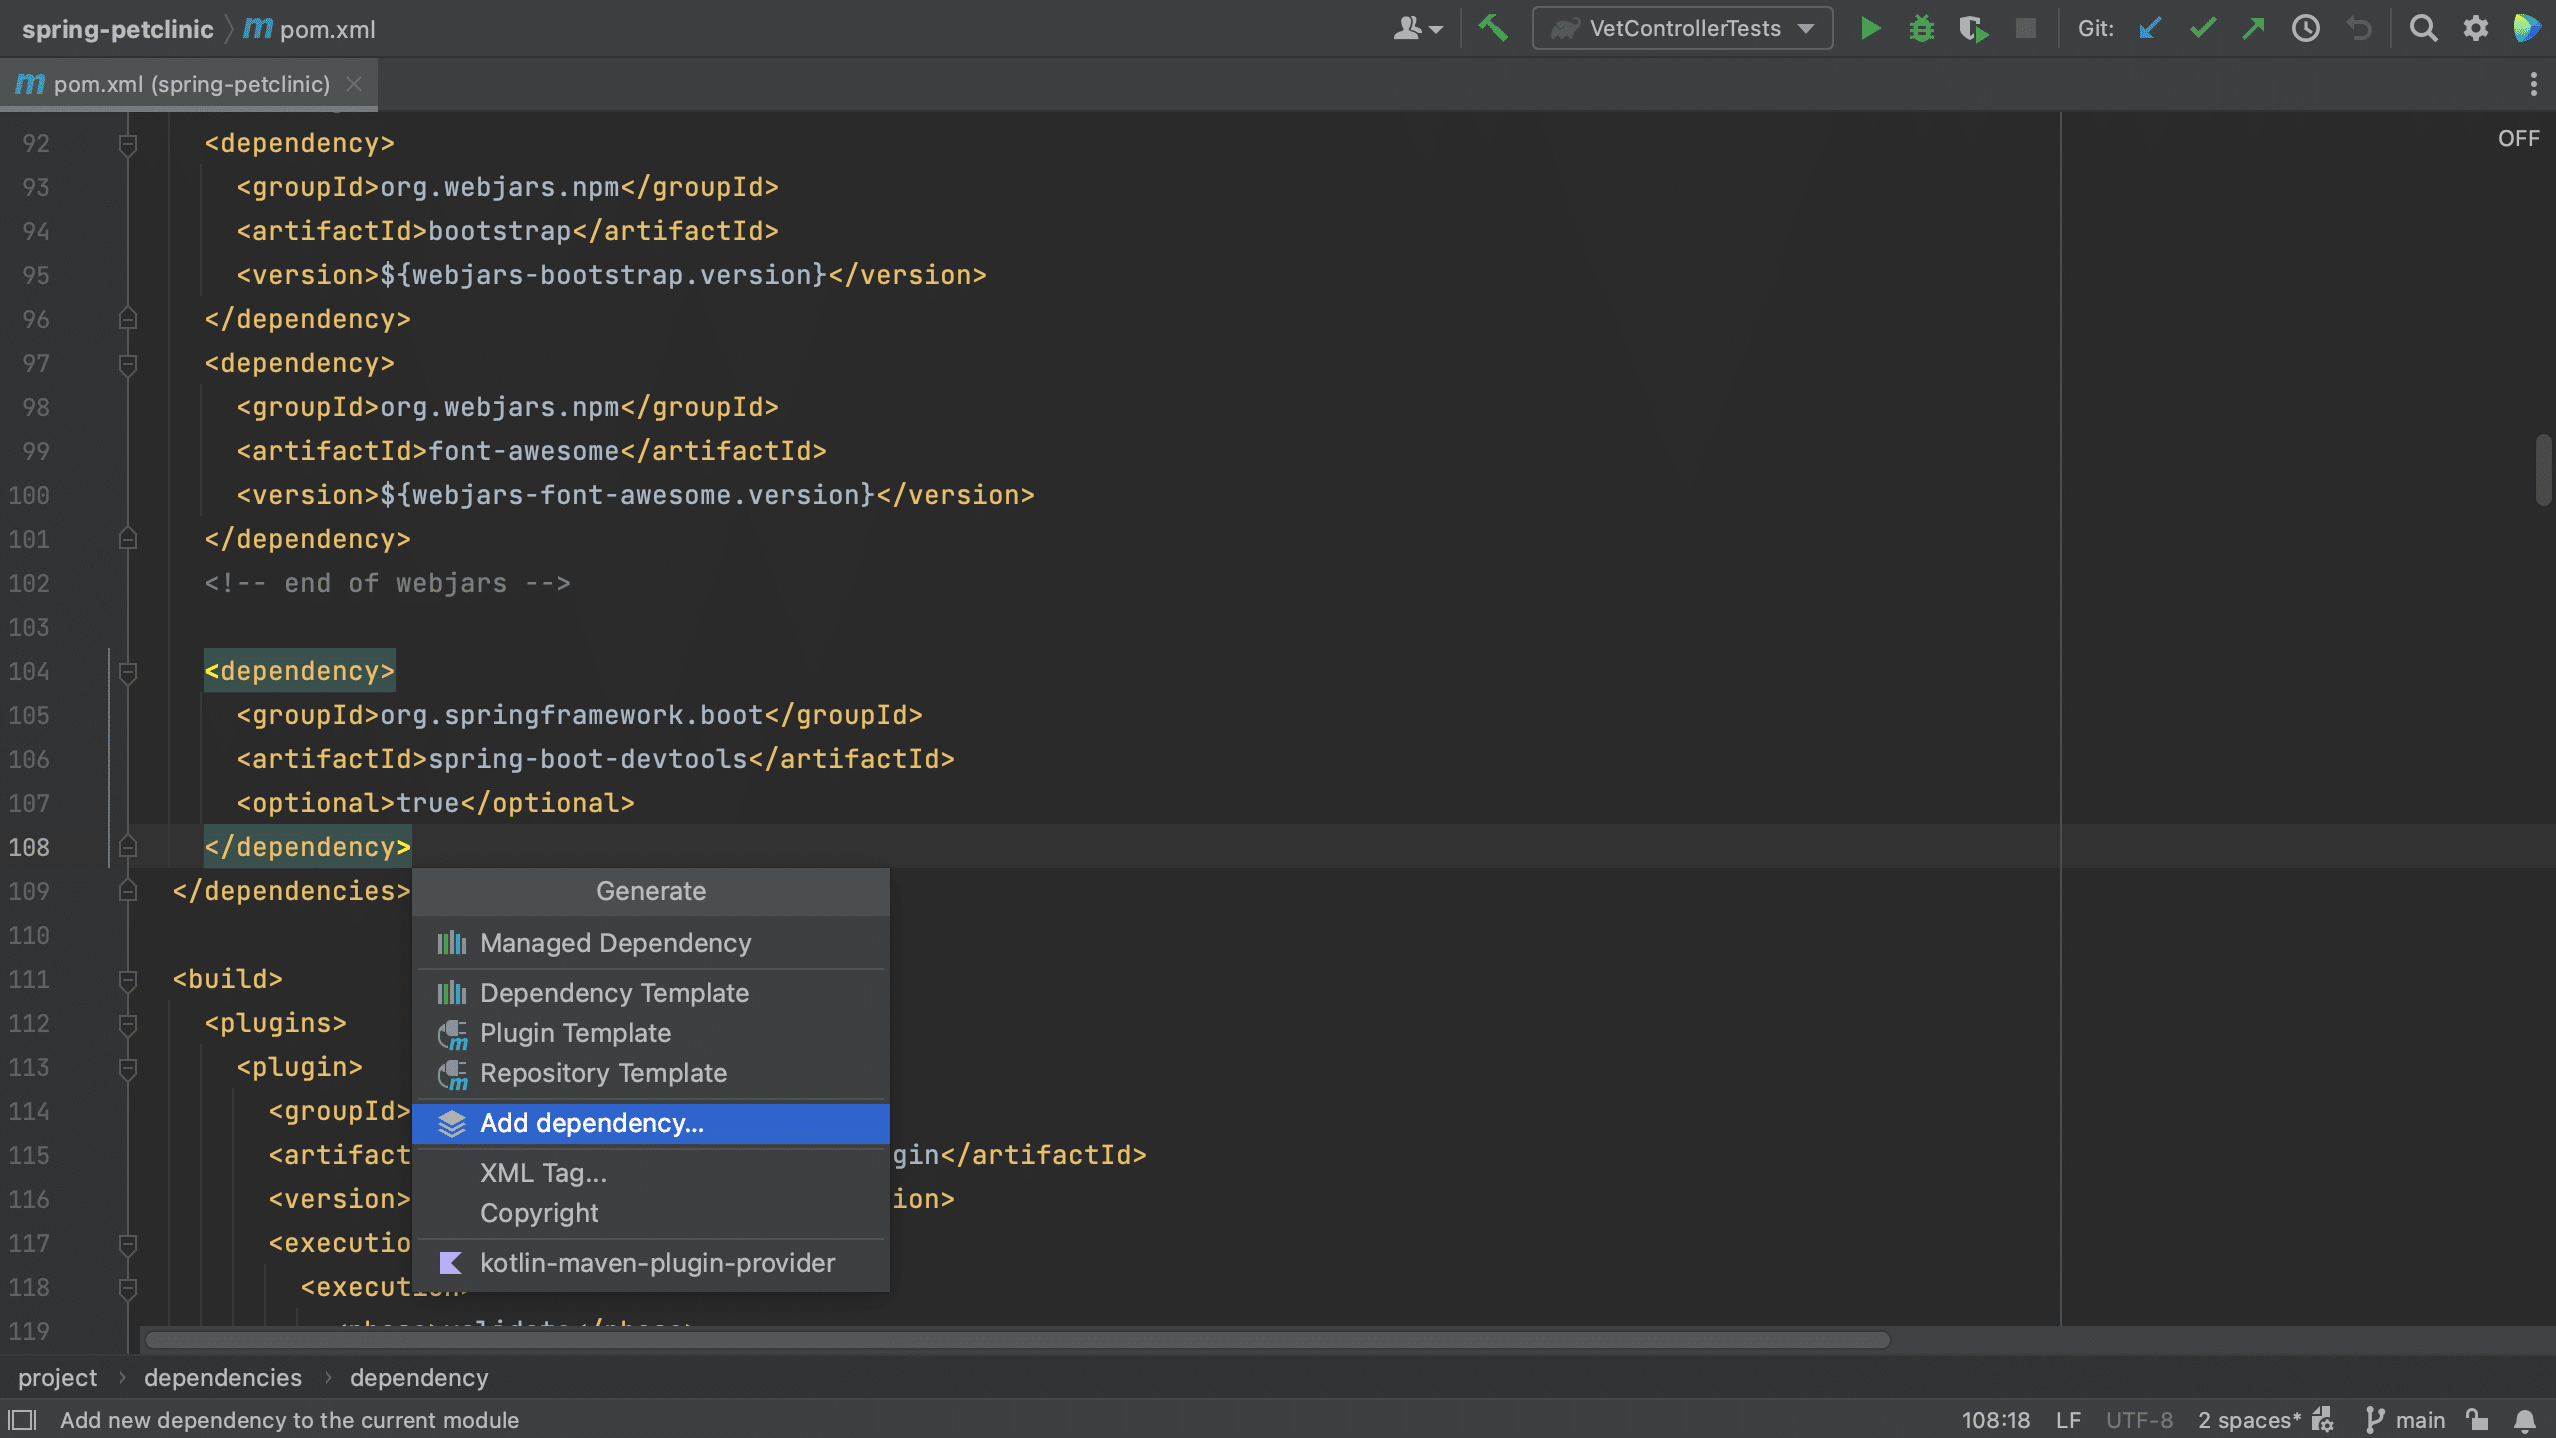
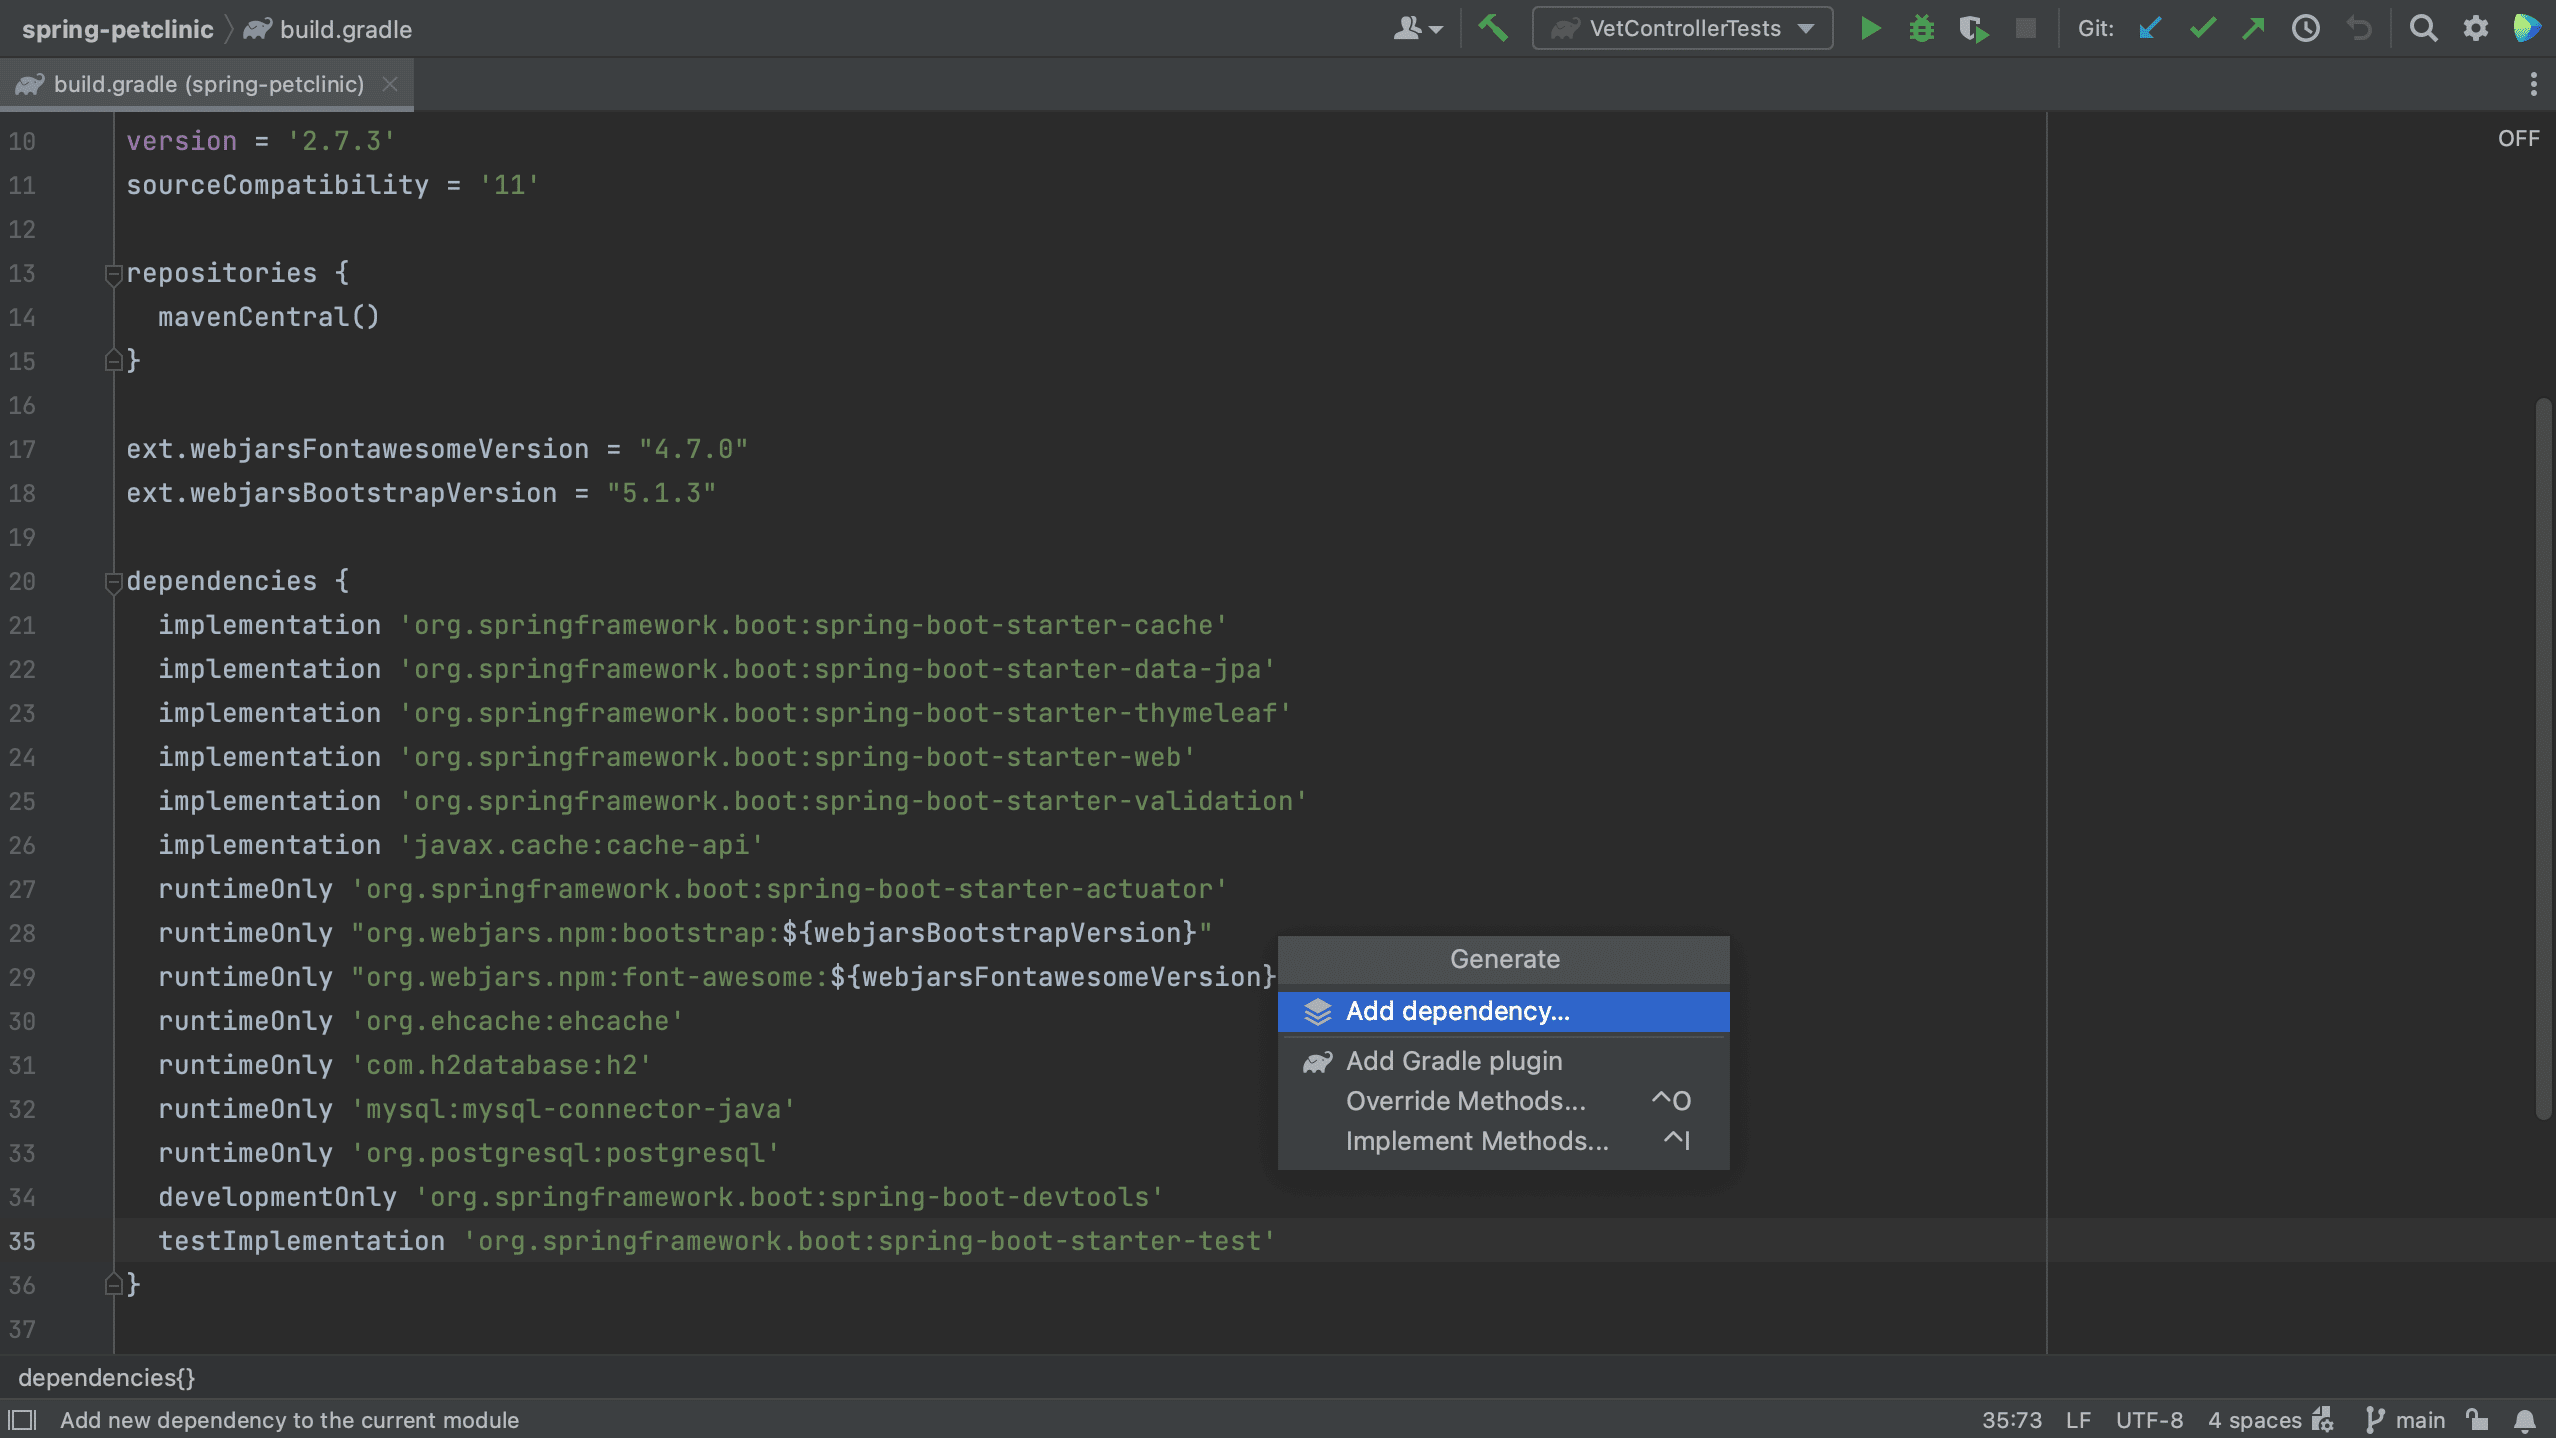
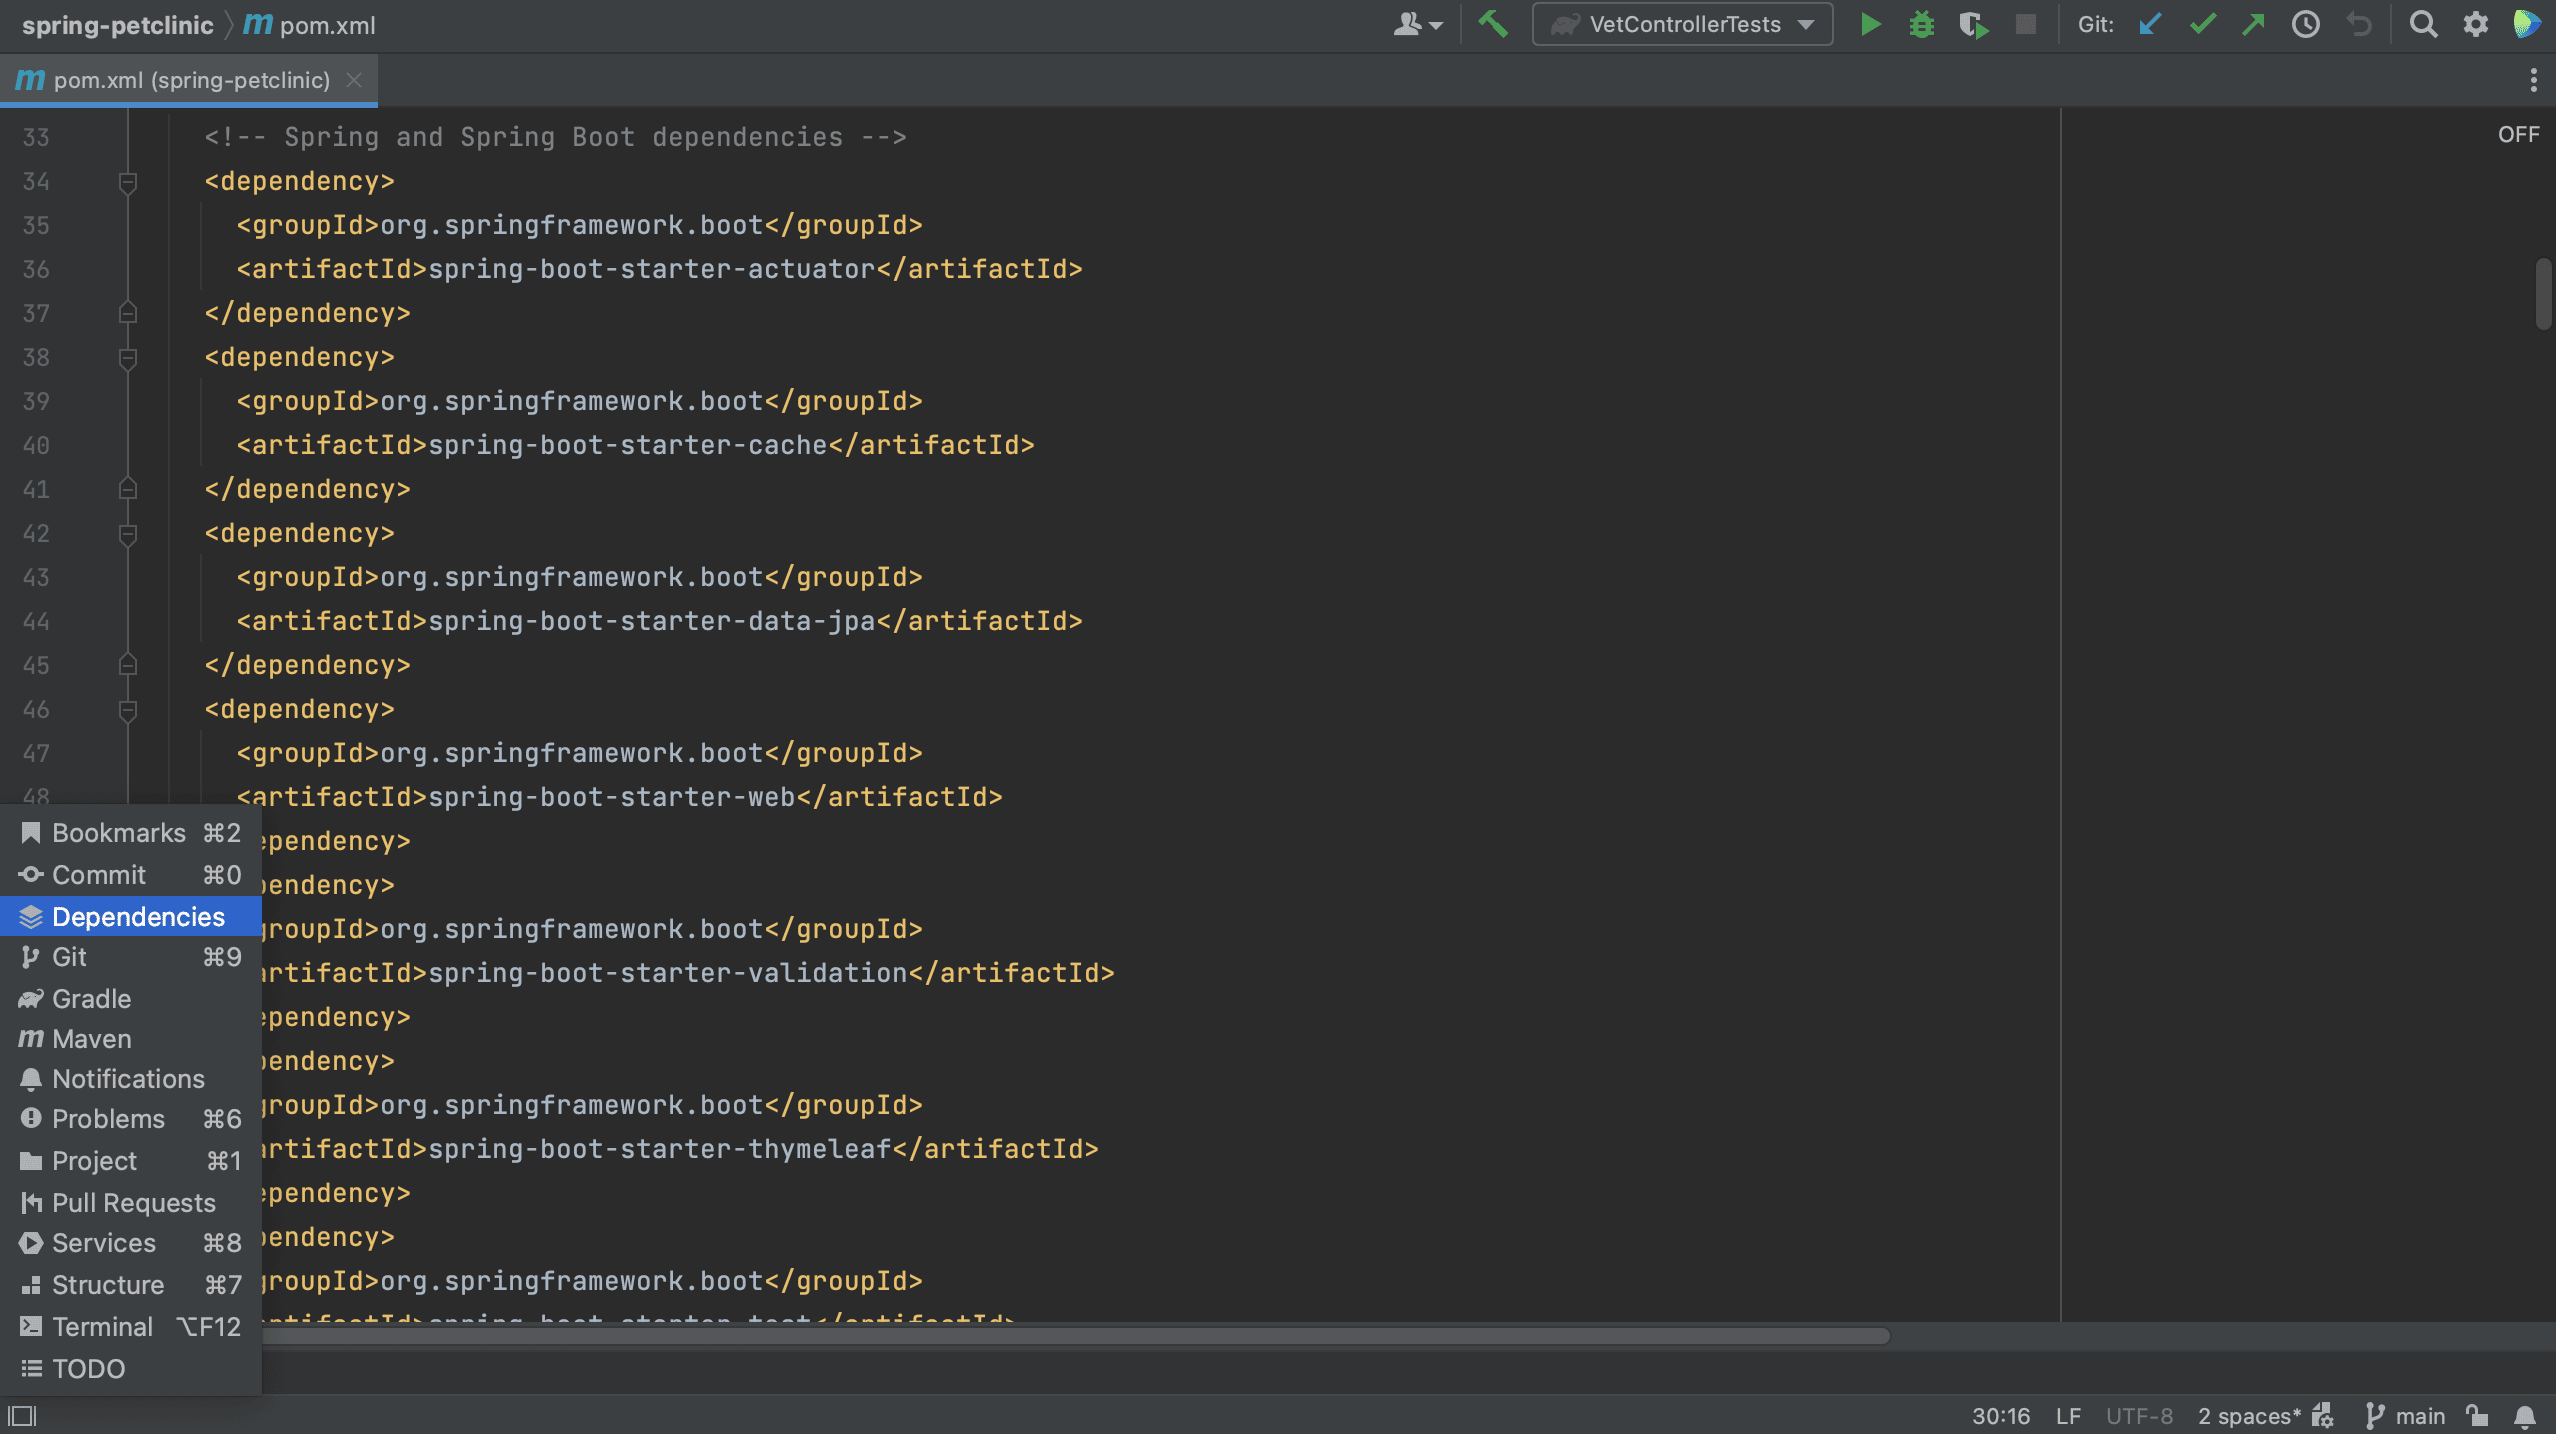
We can also use code generation from the build file to add dependencies. In the build file, the pom.xml in a Maven project, invoke Package Search using ⌘N (on macOS) or Alt+Insert (on Windows & Linux) and in the menu that opens, select Add dependency. This will open the Dependencies tool window.
Note that if we are using Gradle, we can do the same in our build.gradle file.
From the Dependencies tool window
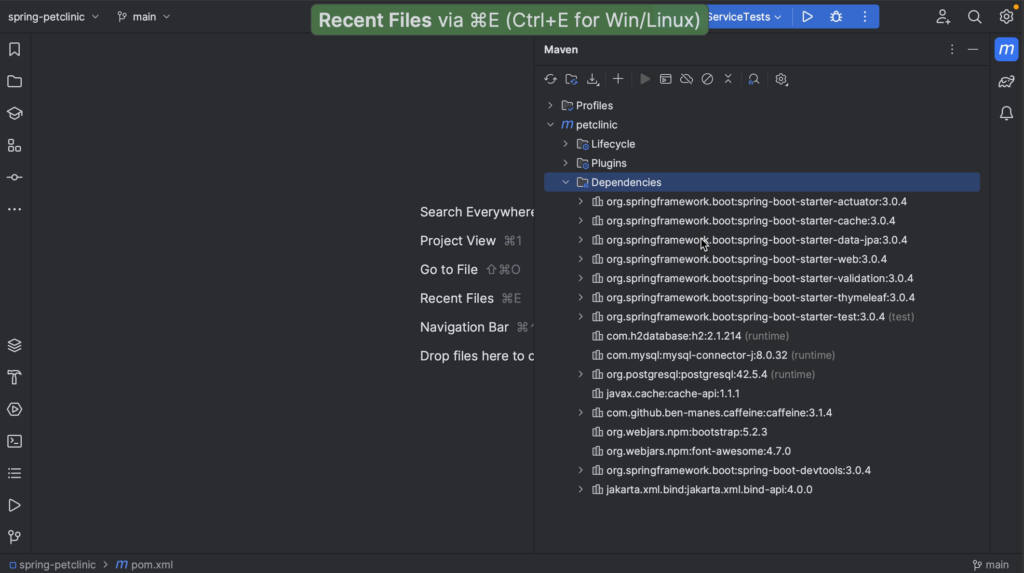
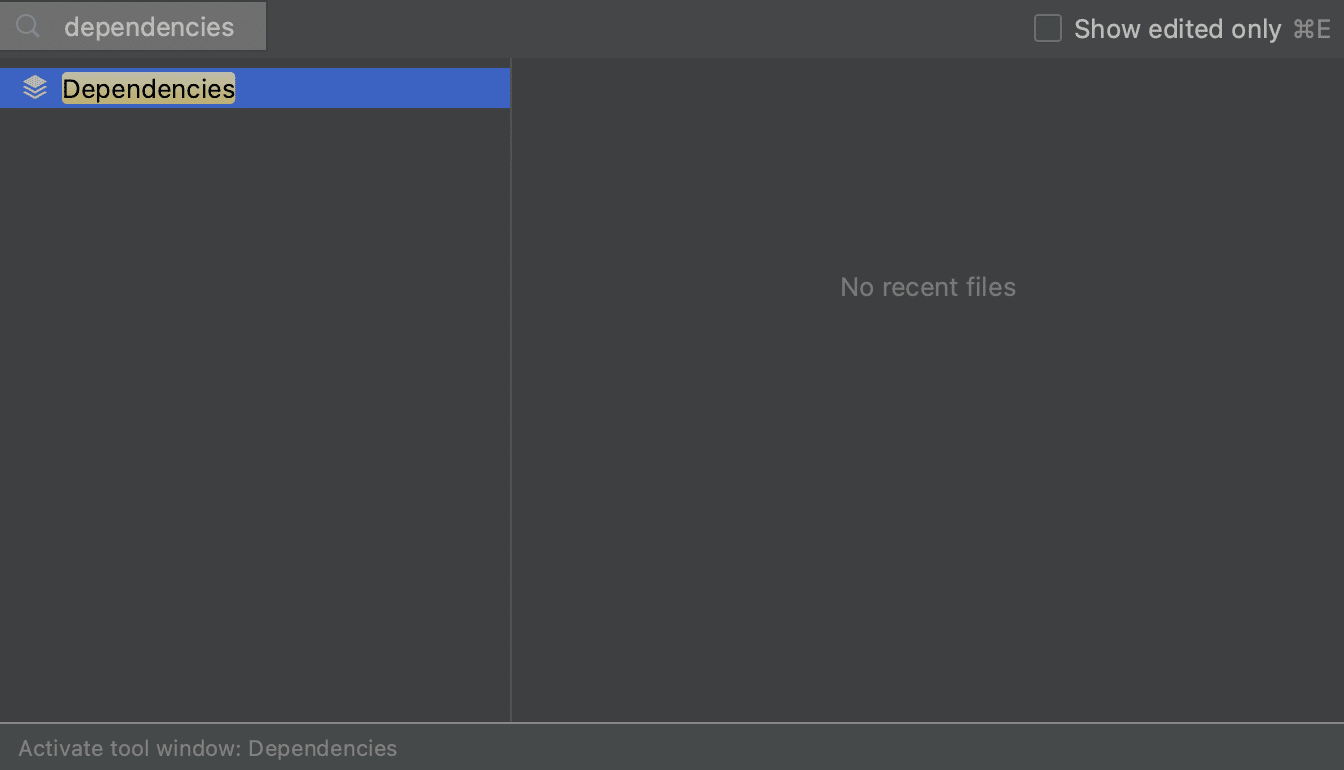
Alternatively, we can open the Dependencies tool window directly. There is no shortcut to open the Dependencies tool window, so we can either use Recent Files, ⌘E (on Mac) or Ctrl+E (on Windows/Linux), and type in “dependencies” to open the Dependencies tool window.
Alternatively, we can open it by clicking Quick Launch in the bottom-left and selecting Dependencies.
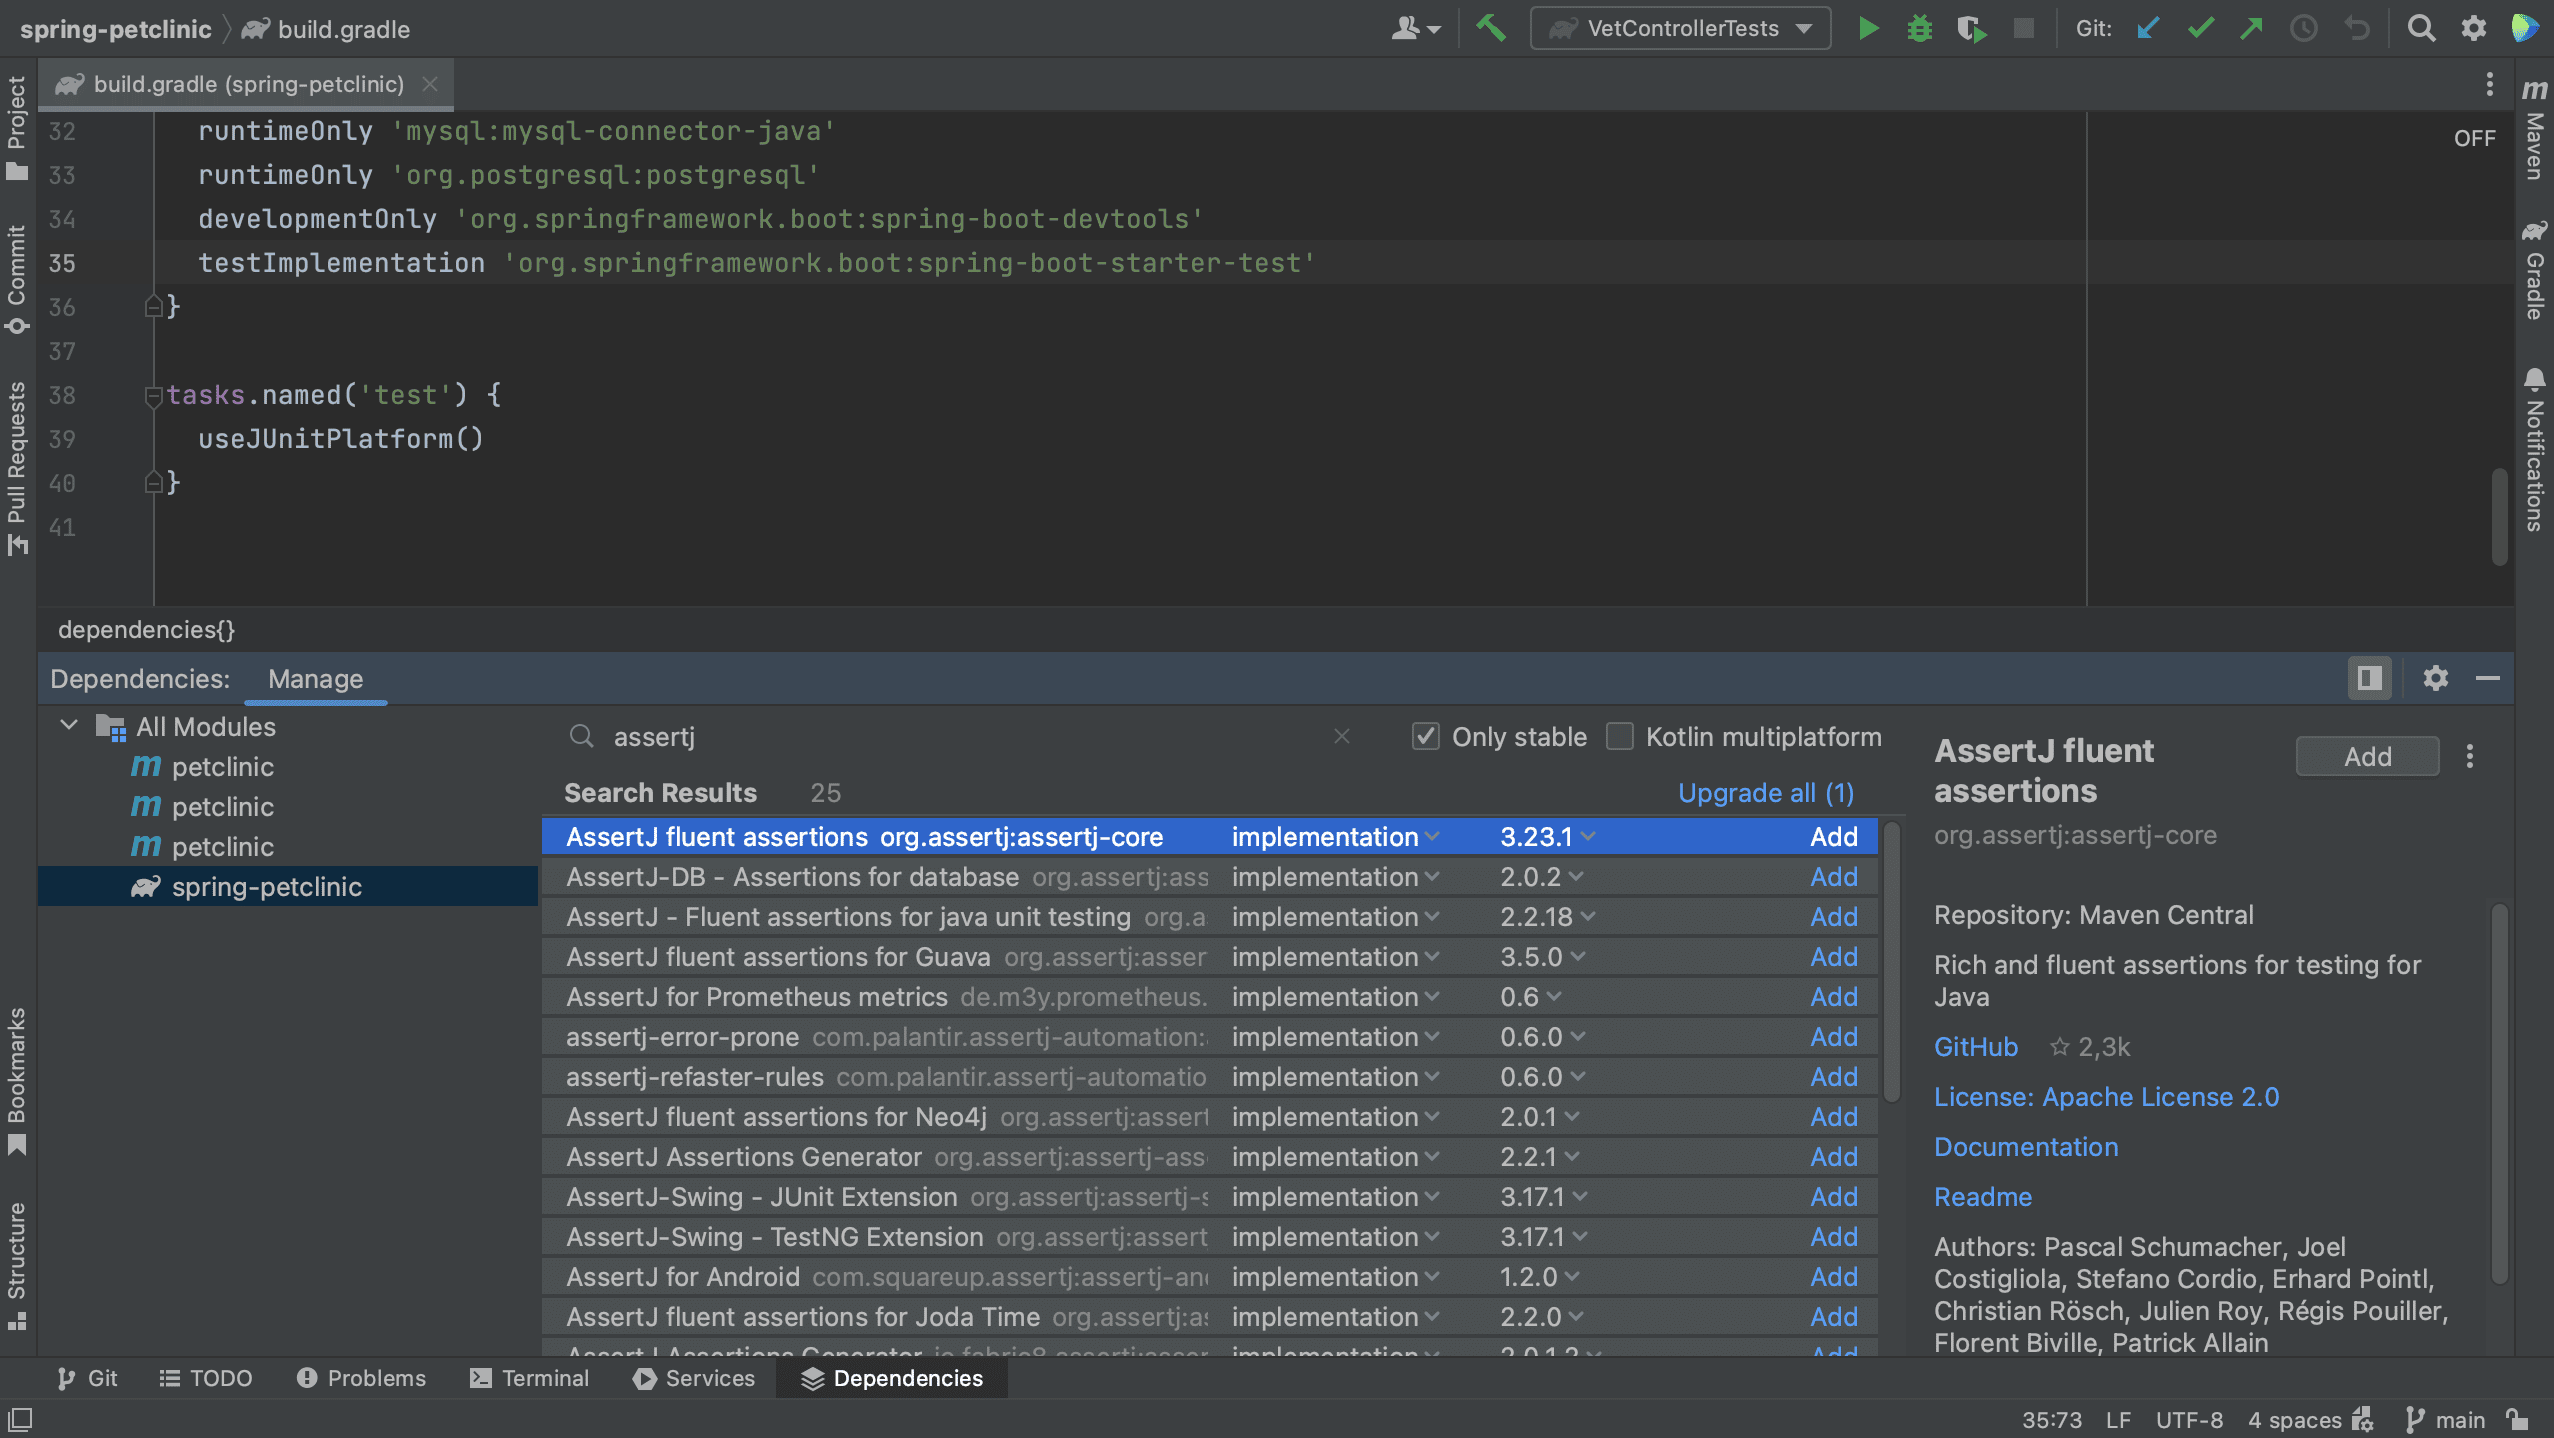
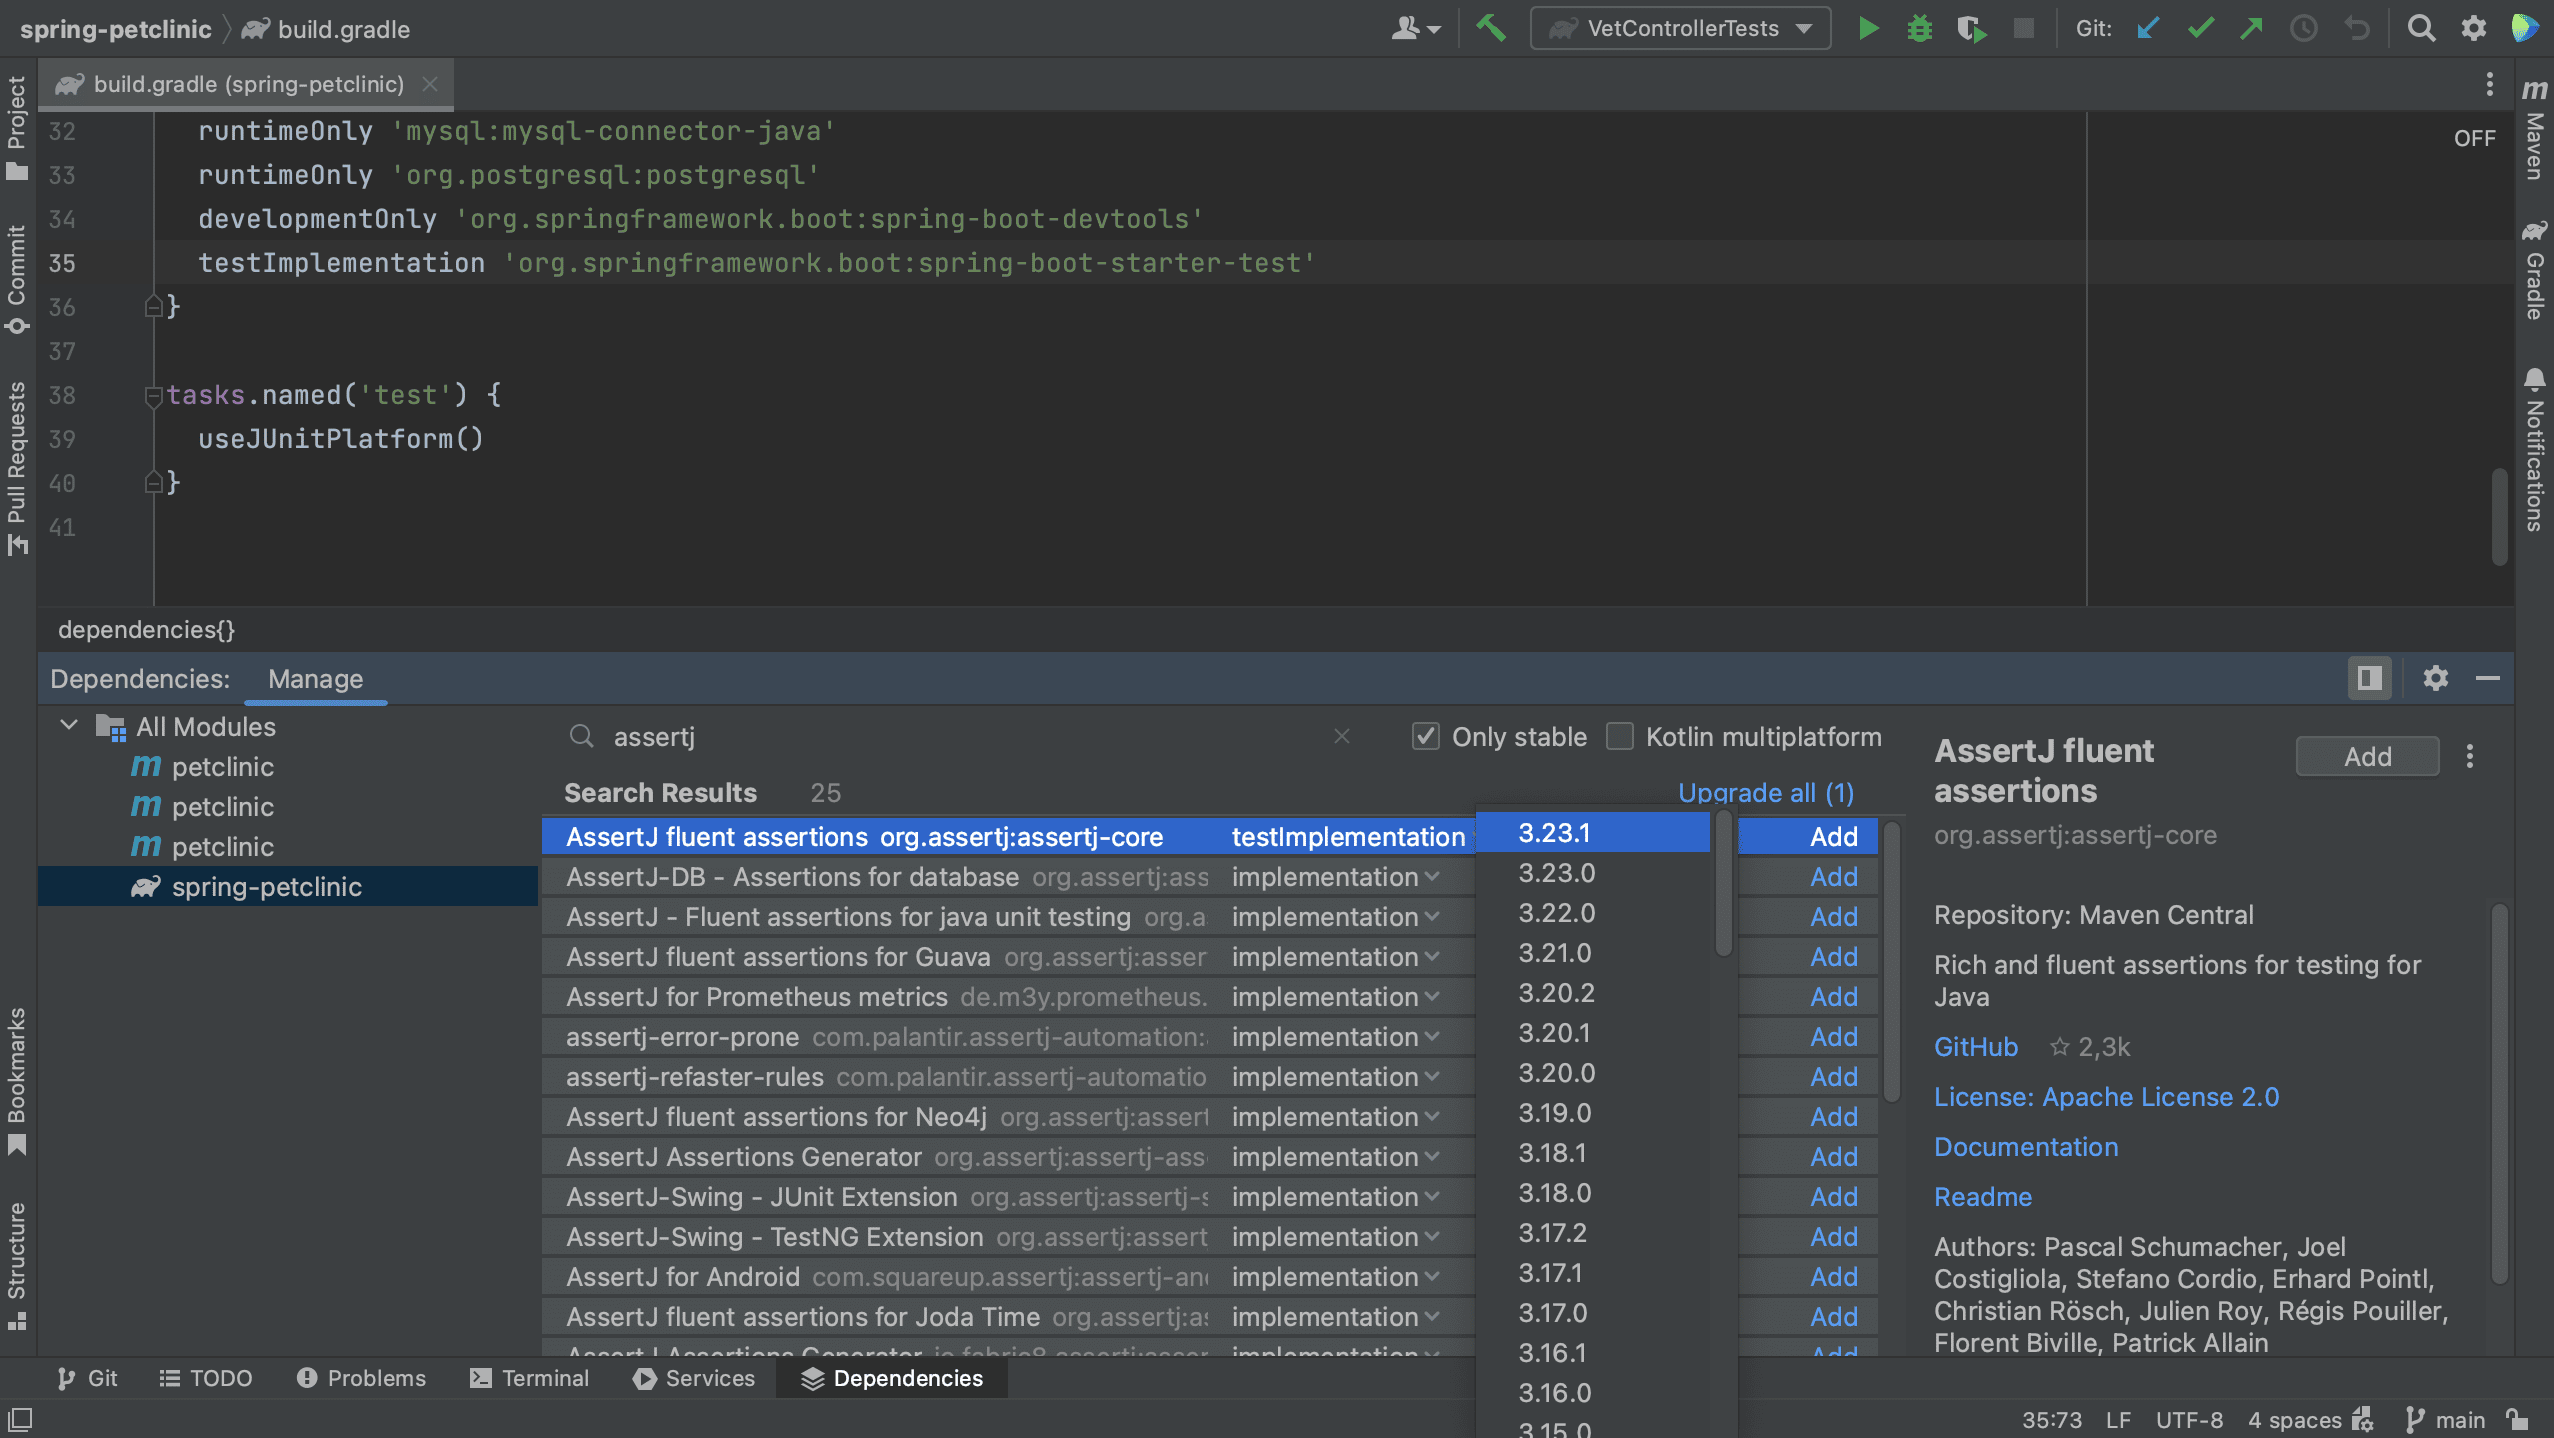
In the Dependencies tool window, we can search for a dependency. For example, let’s search for AssertJ.
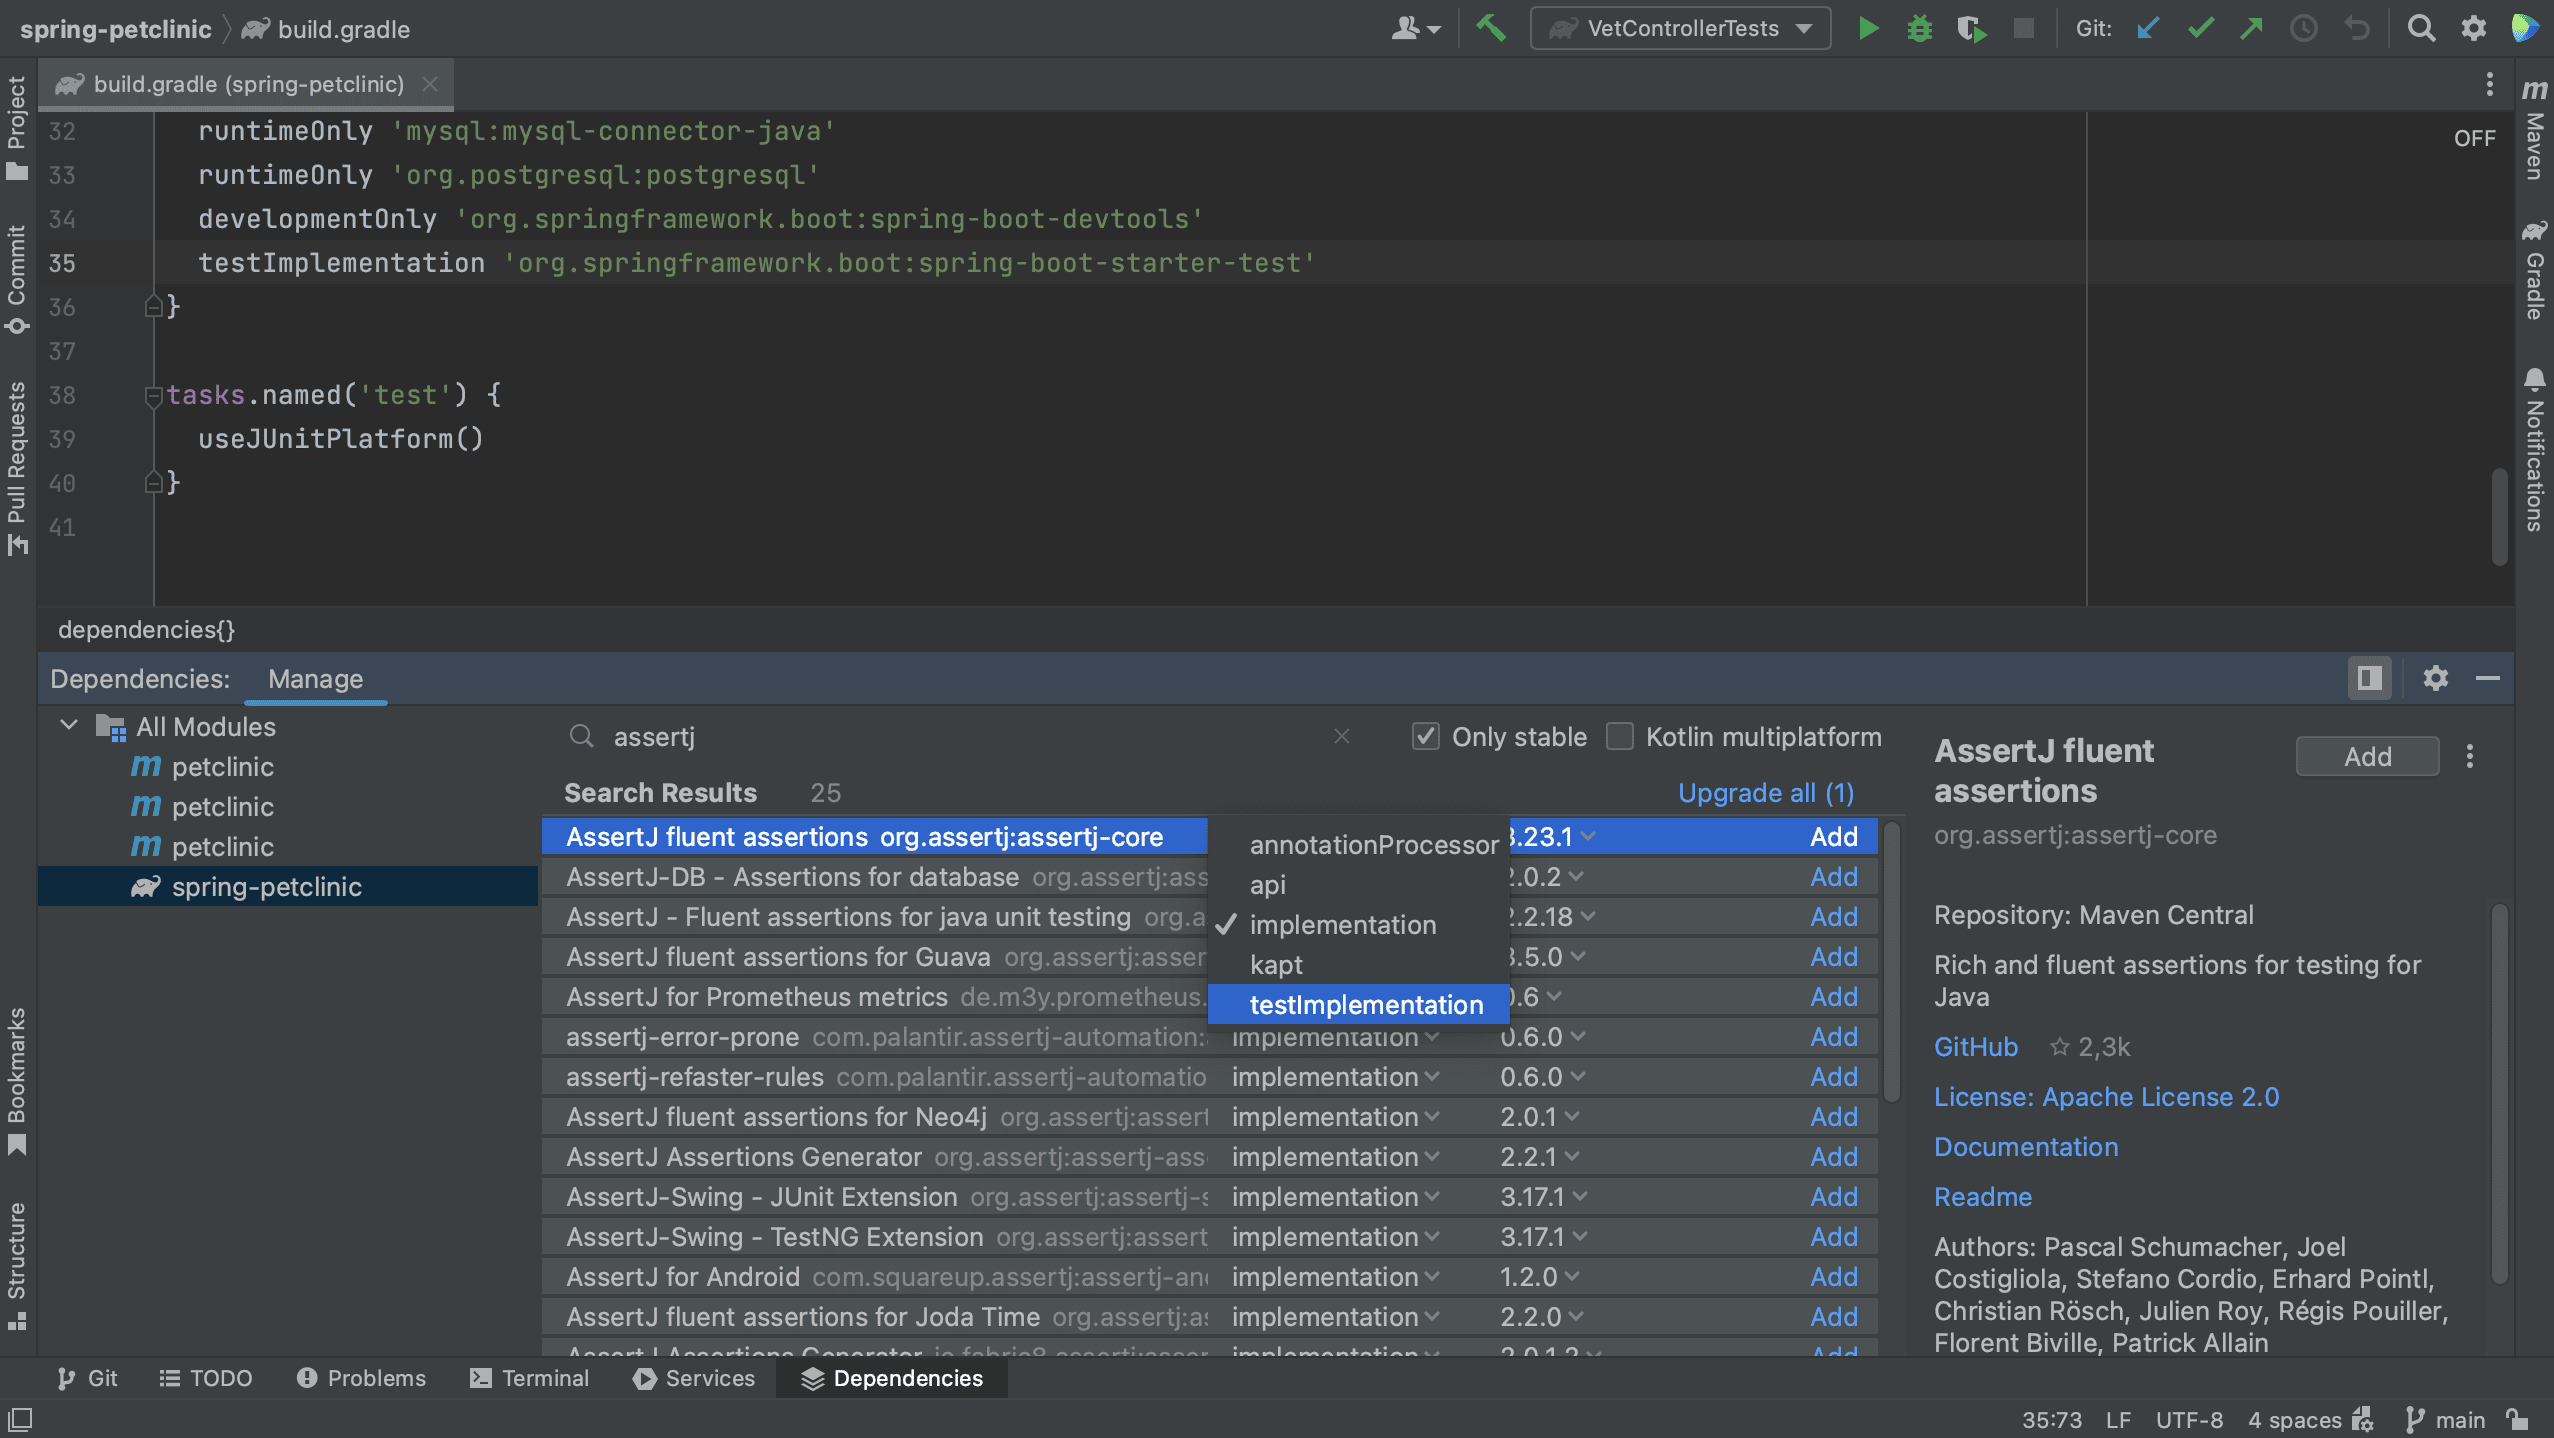
Note that we can select a scope for this dependency. The names of the scopes are based on the build tool with which you are working. Since this is a test dependency, and we are using Gradle in this project, we can set the scope to testImplementation.
We can also select the version we want to use.
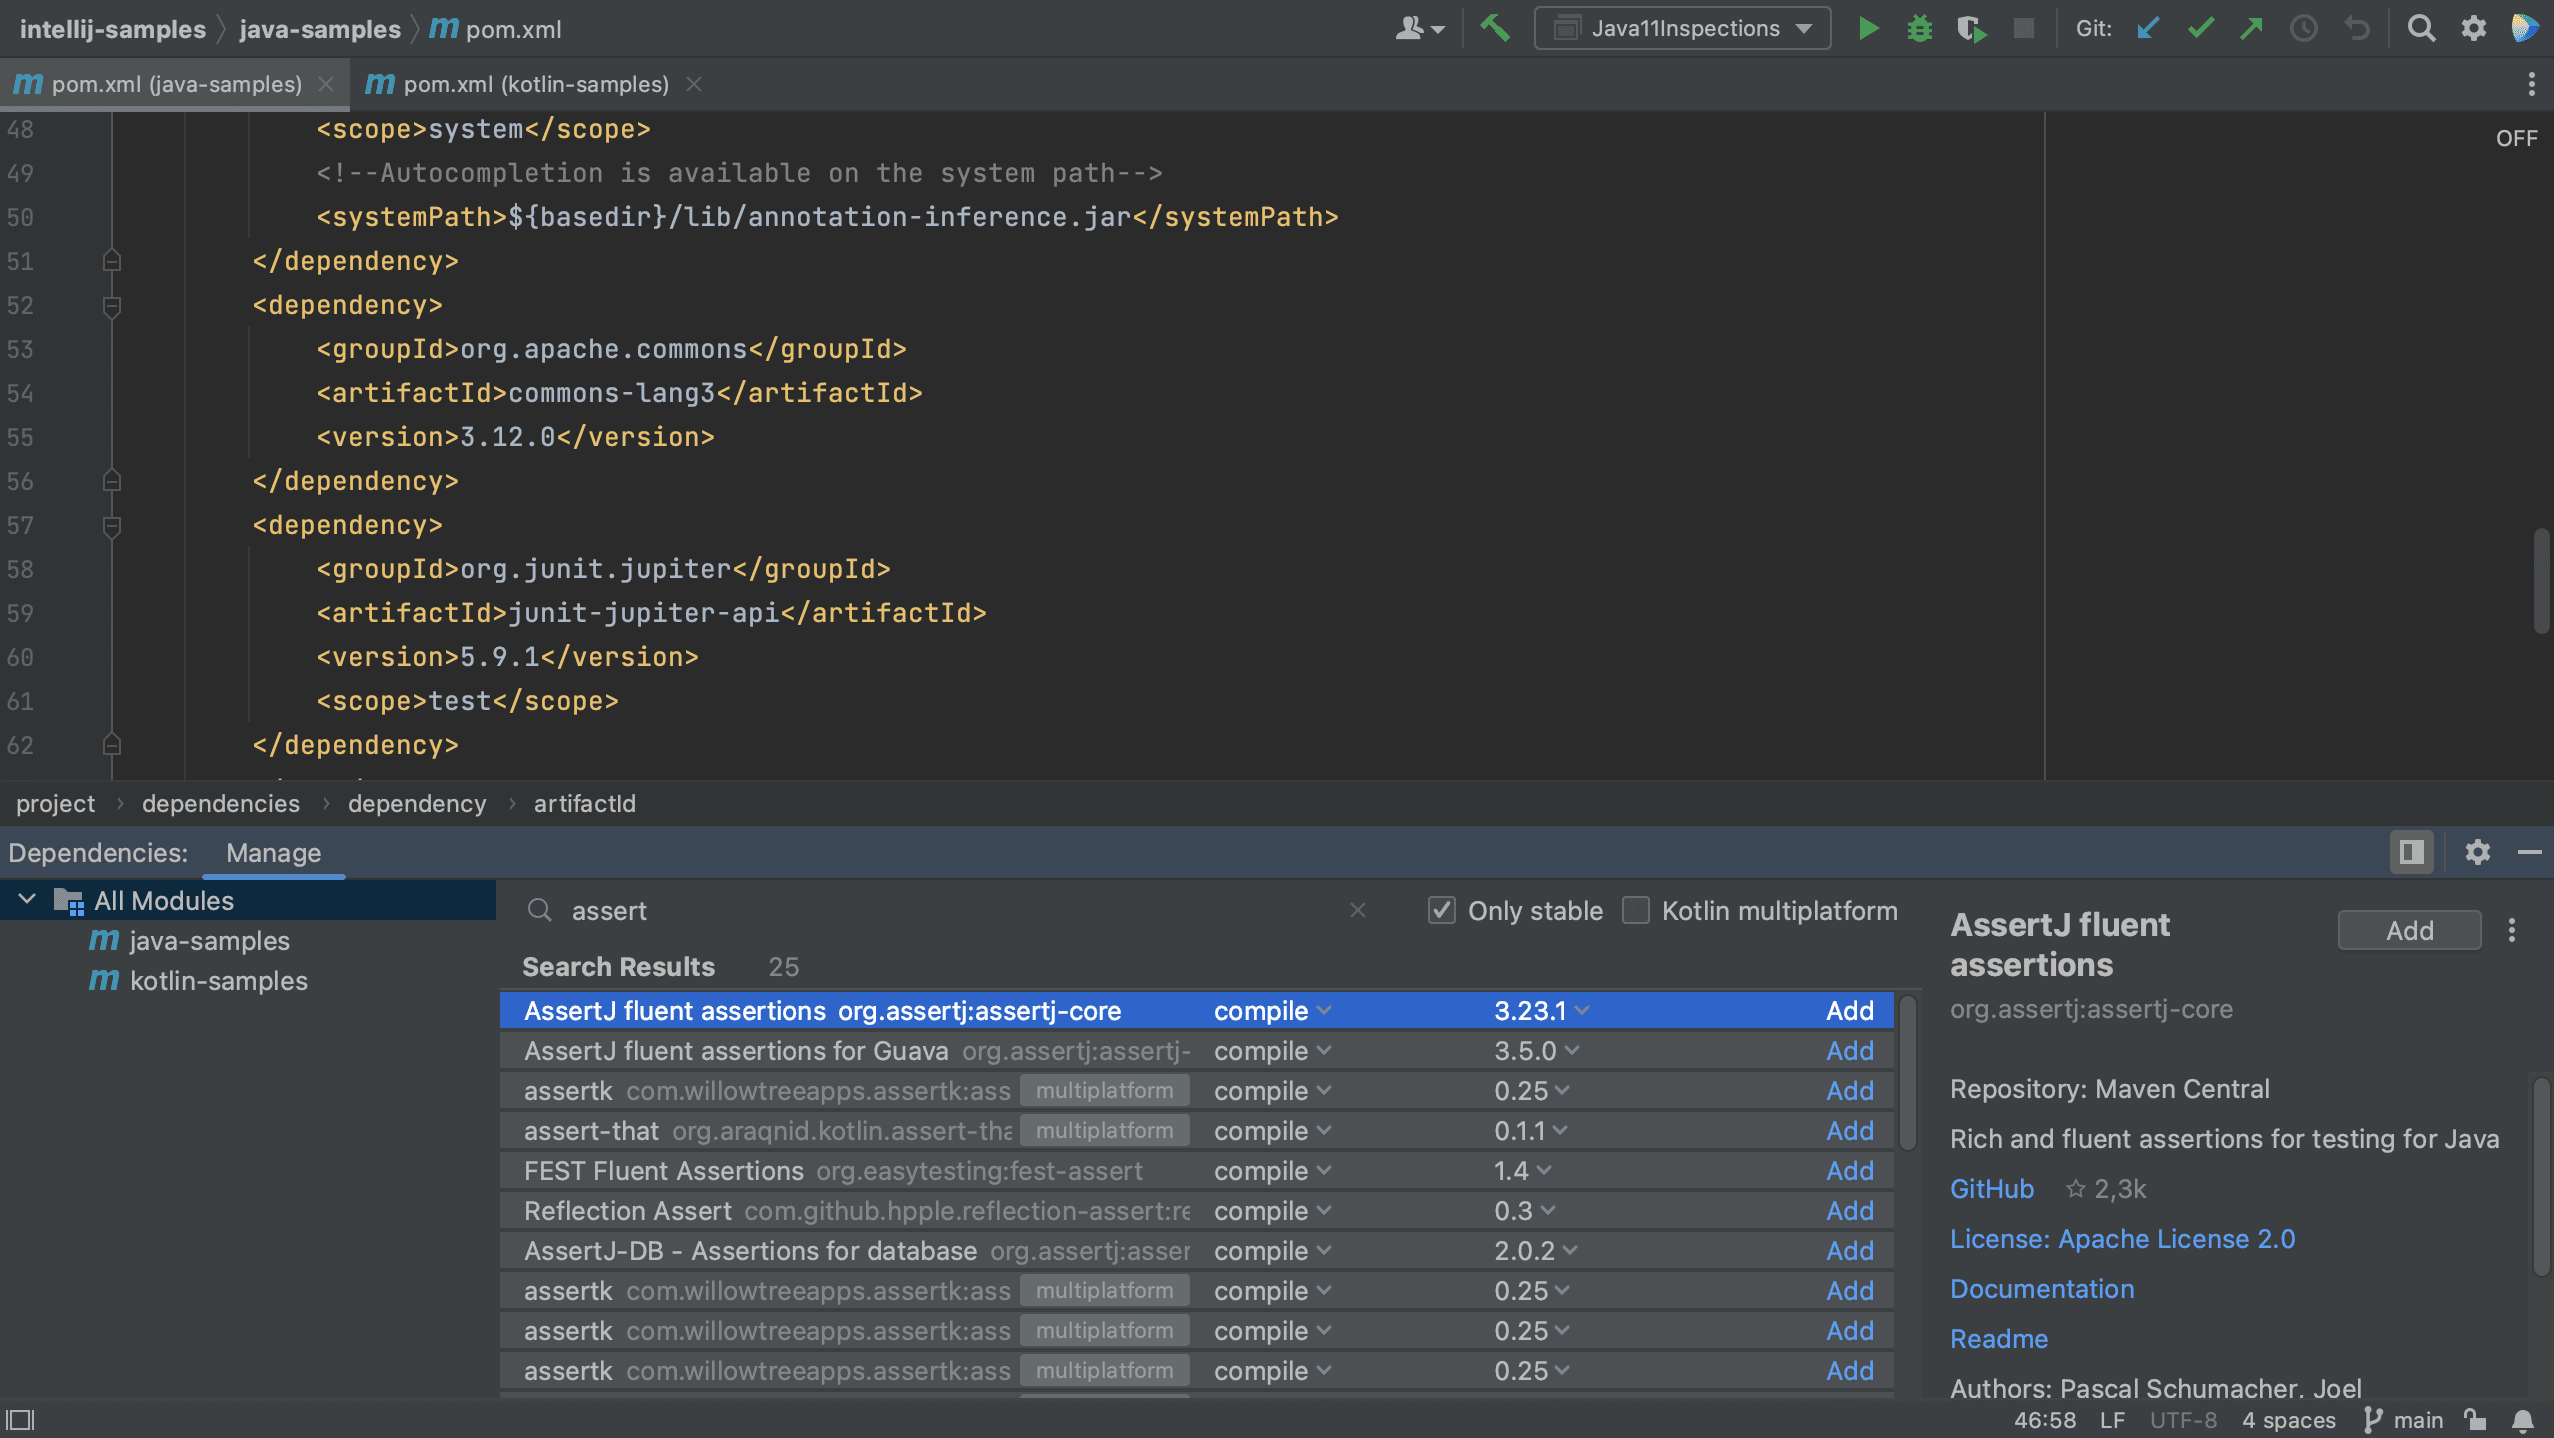
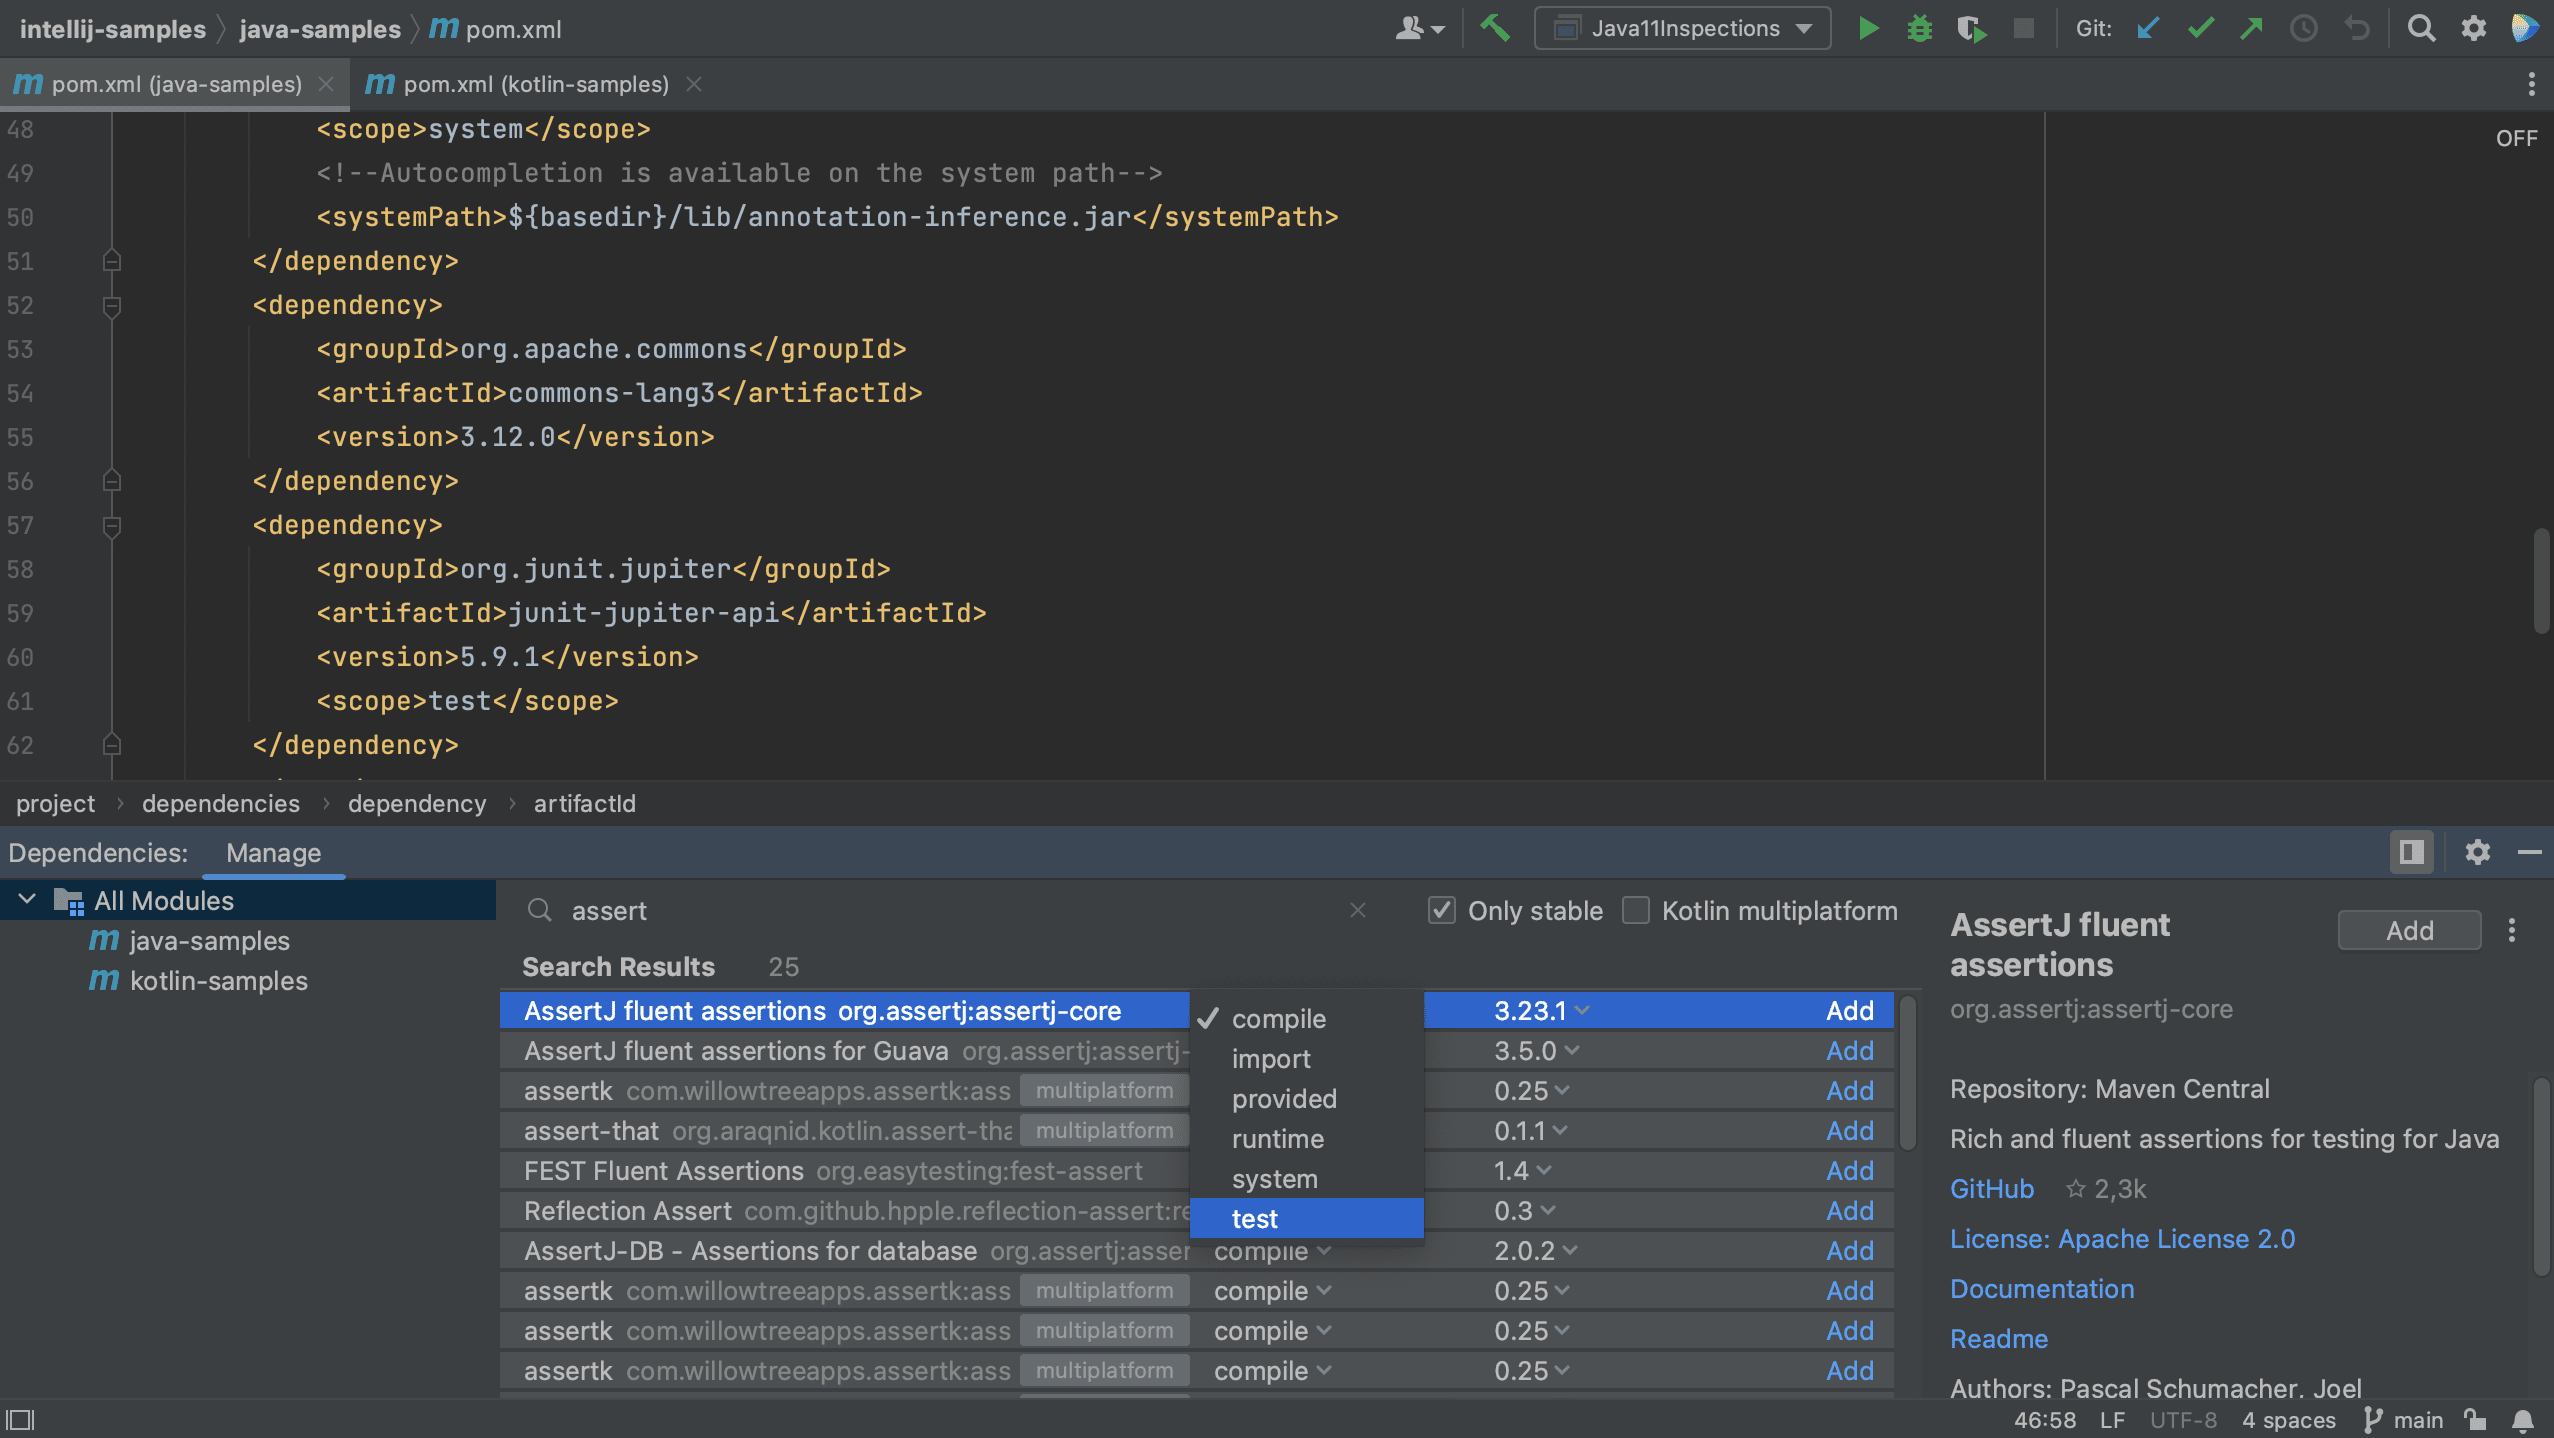
We can do the same in Maven.
Note that the names of scopes for Maven are different from Gradle. In Maven, we can set the scope for a test dependency to test.
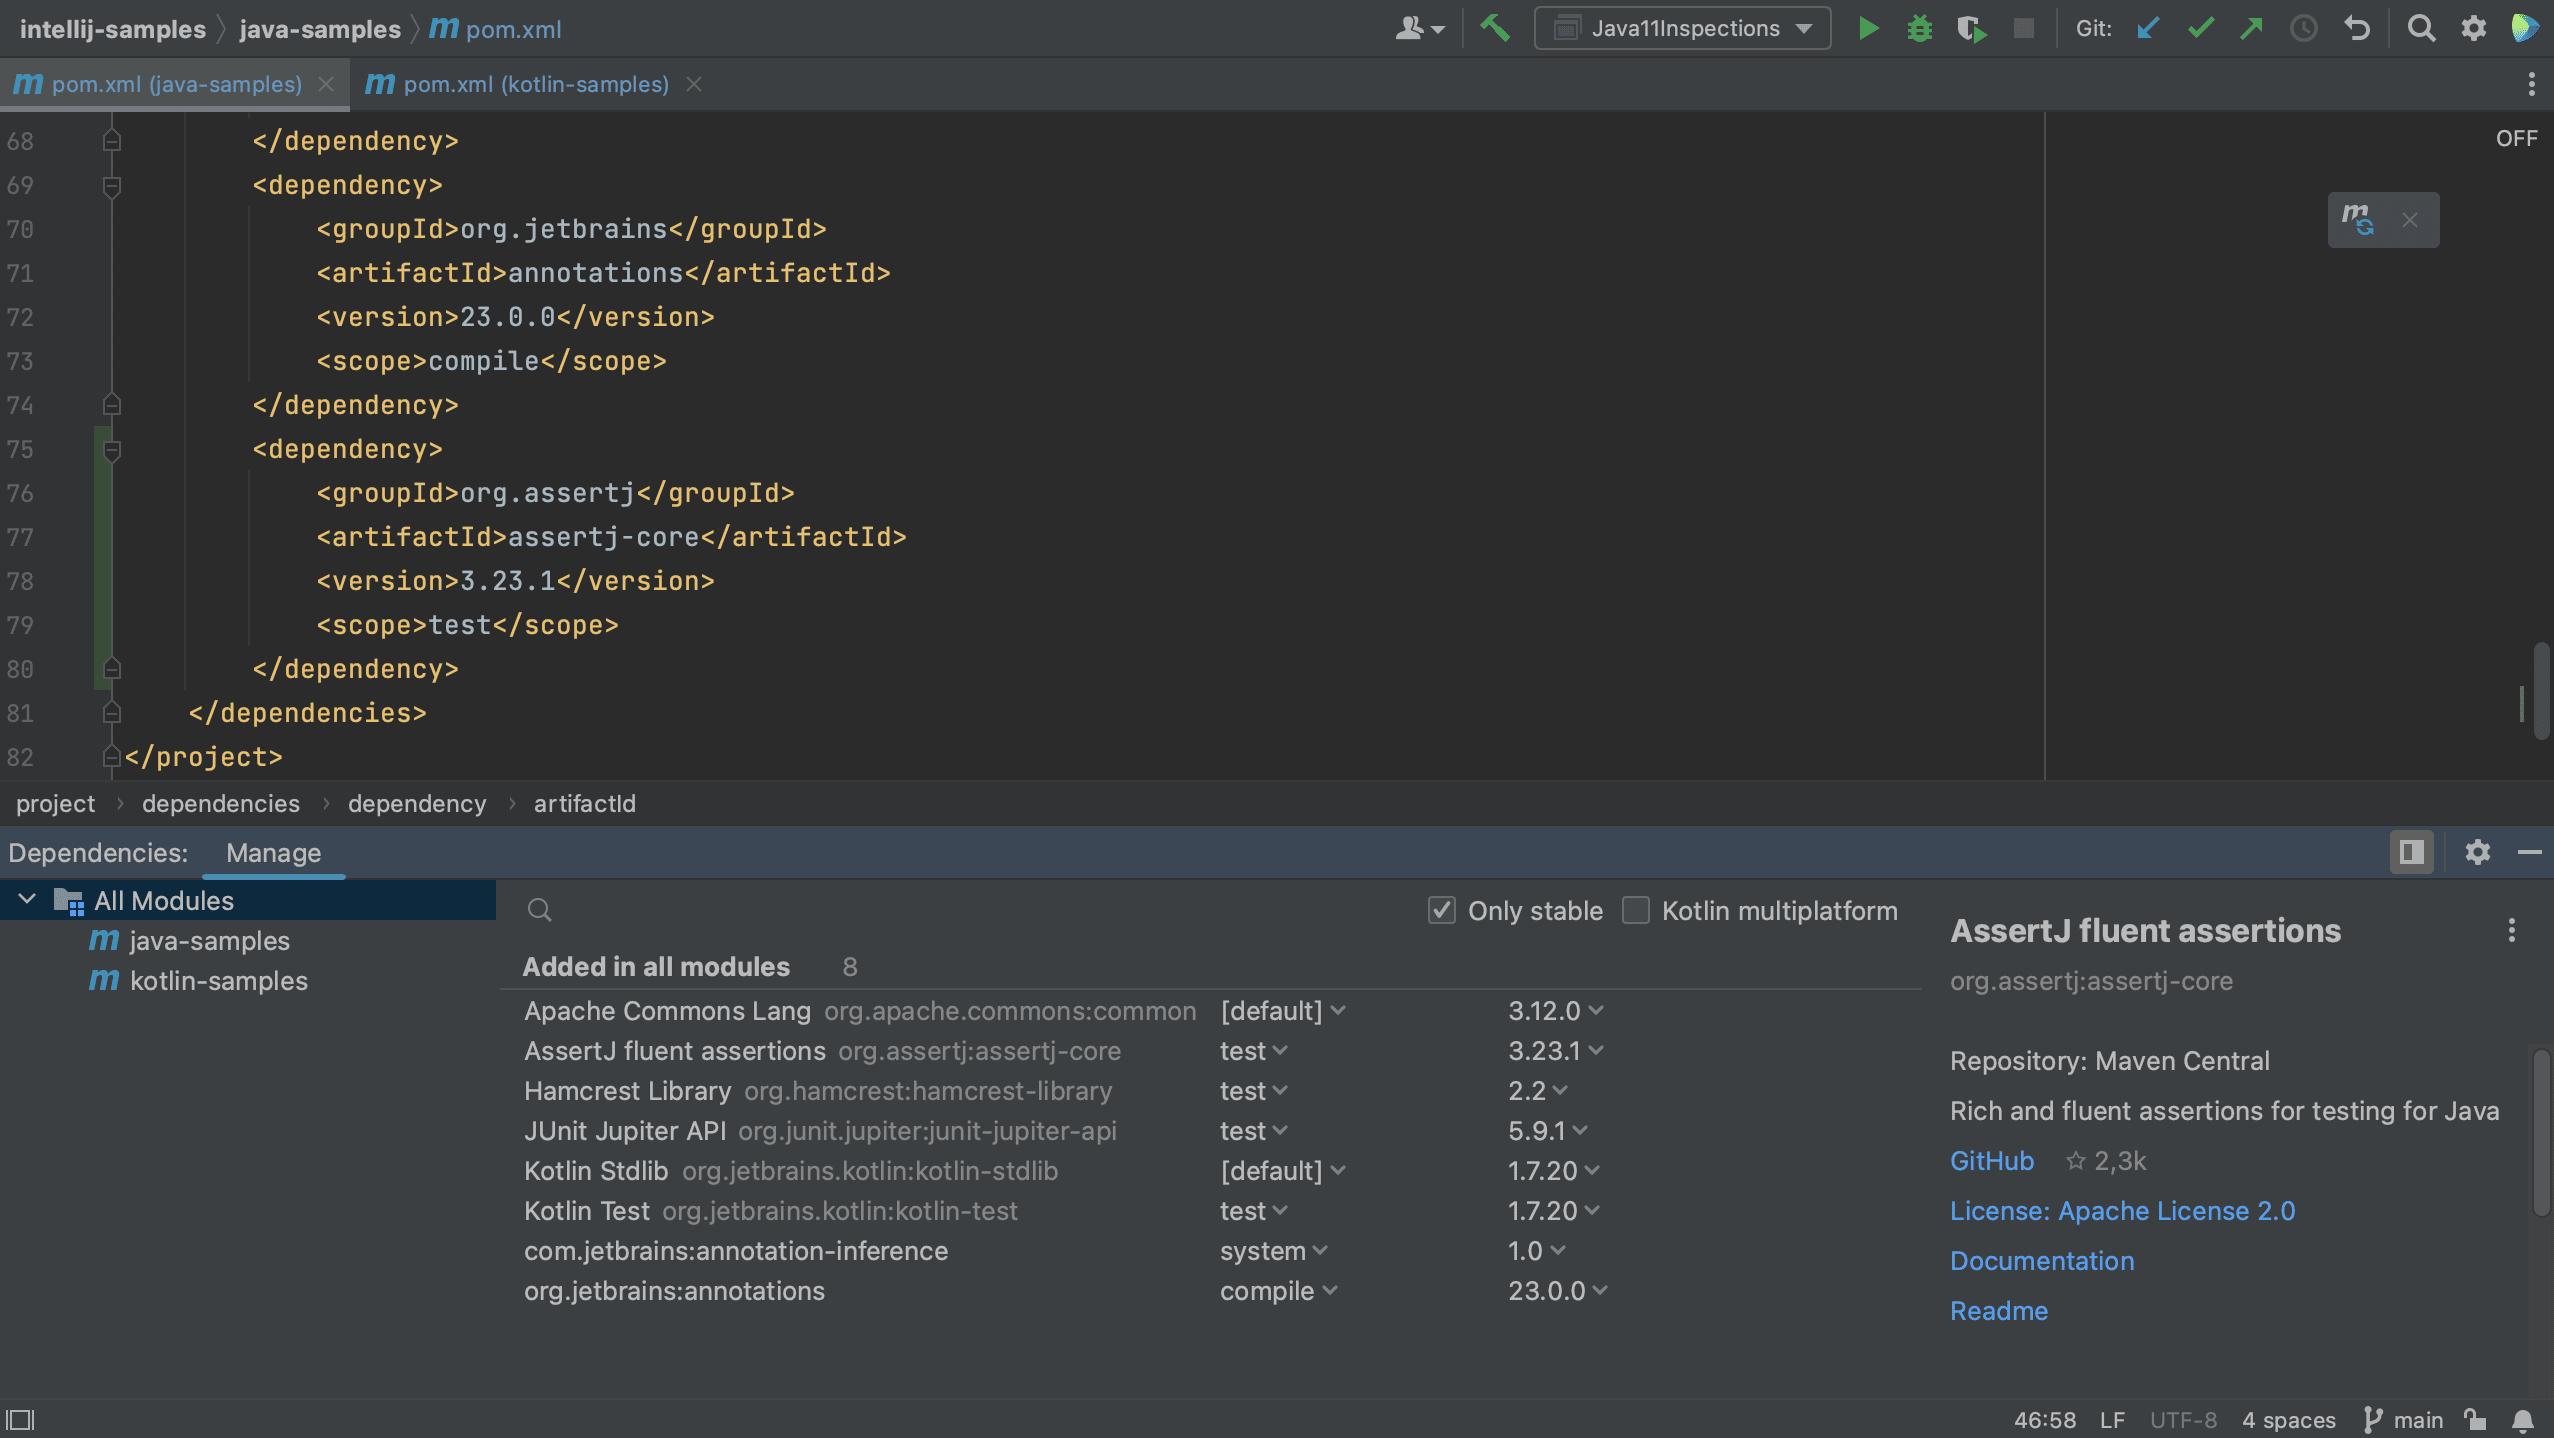
When we click Add, we see that the dependency is added to the build file.
If the version number is shown in red, that means IntelliJ IDEA hasn’t downloaded this library before. Click Load Maven Changes so IntelliJ IDEA will update its dependencies based on the changes to the pom.xml or build.gradle file.
Go back to the Dependencies tool window and clear the search box by clicking the x on the right-hand side. You’ll see the project’s dependencies are updated with your new dependency.
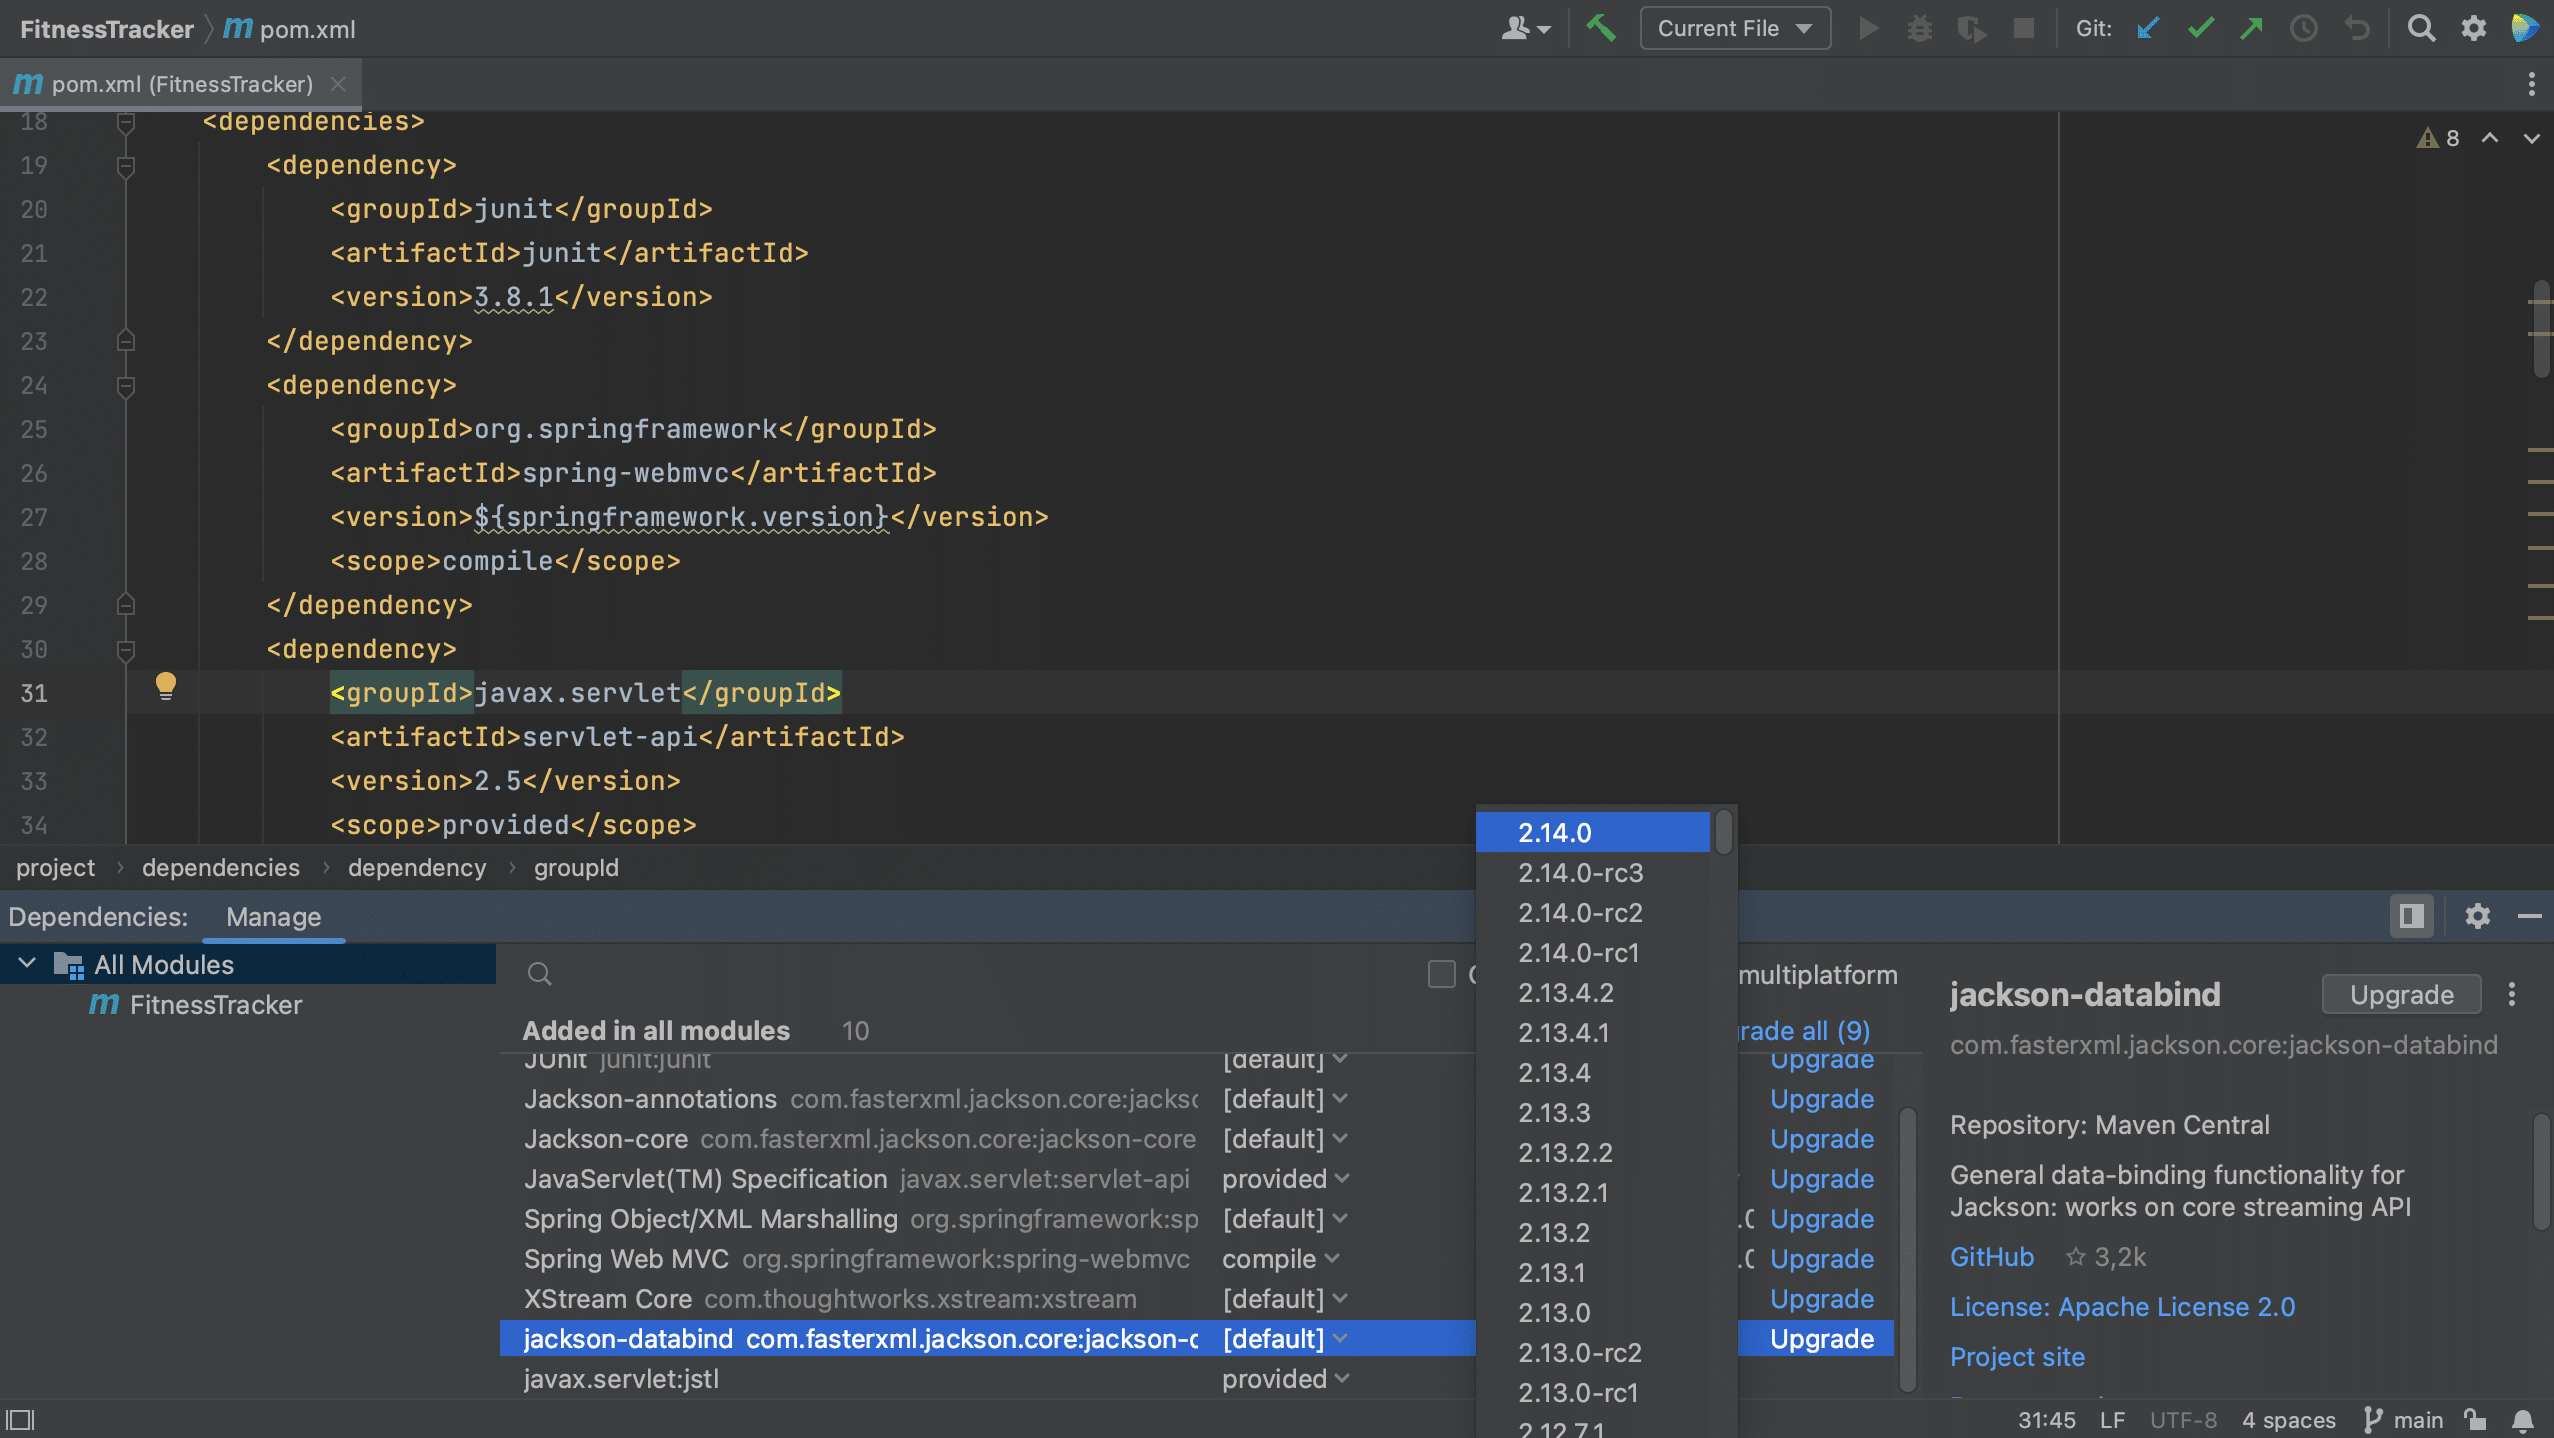
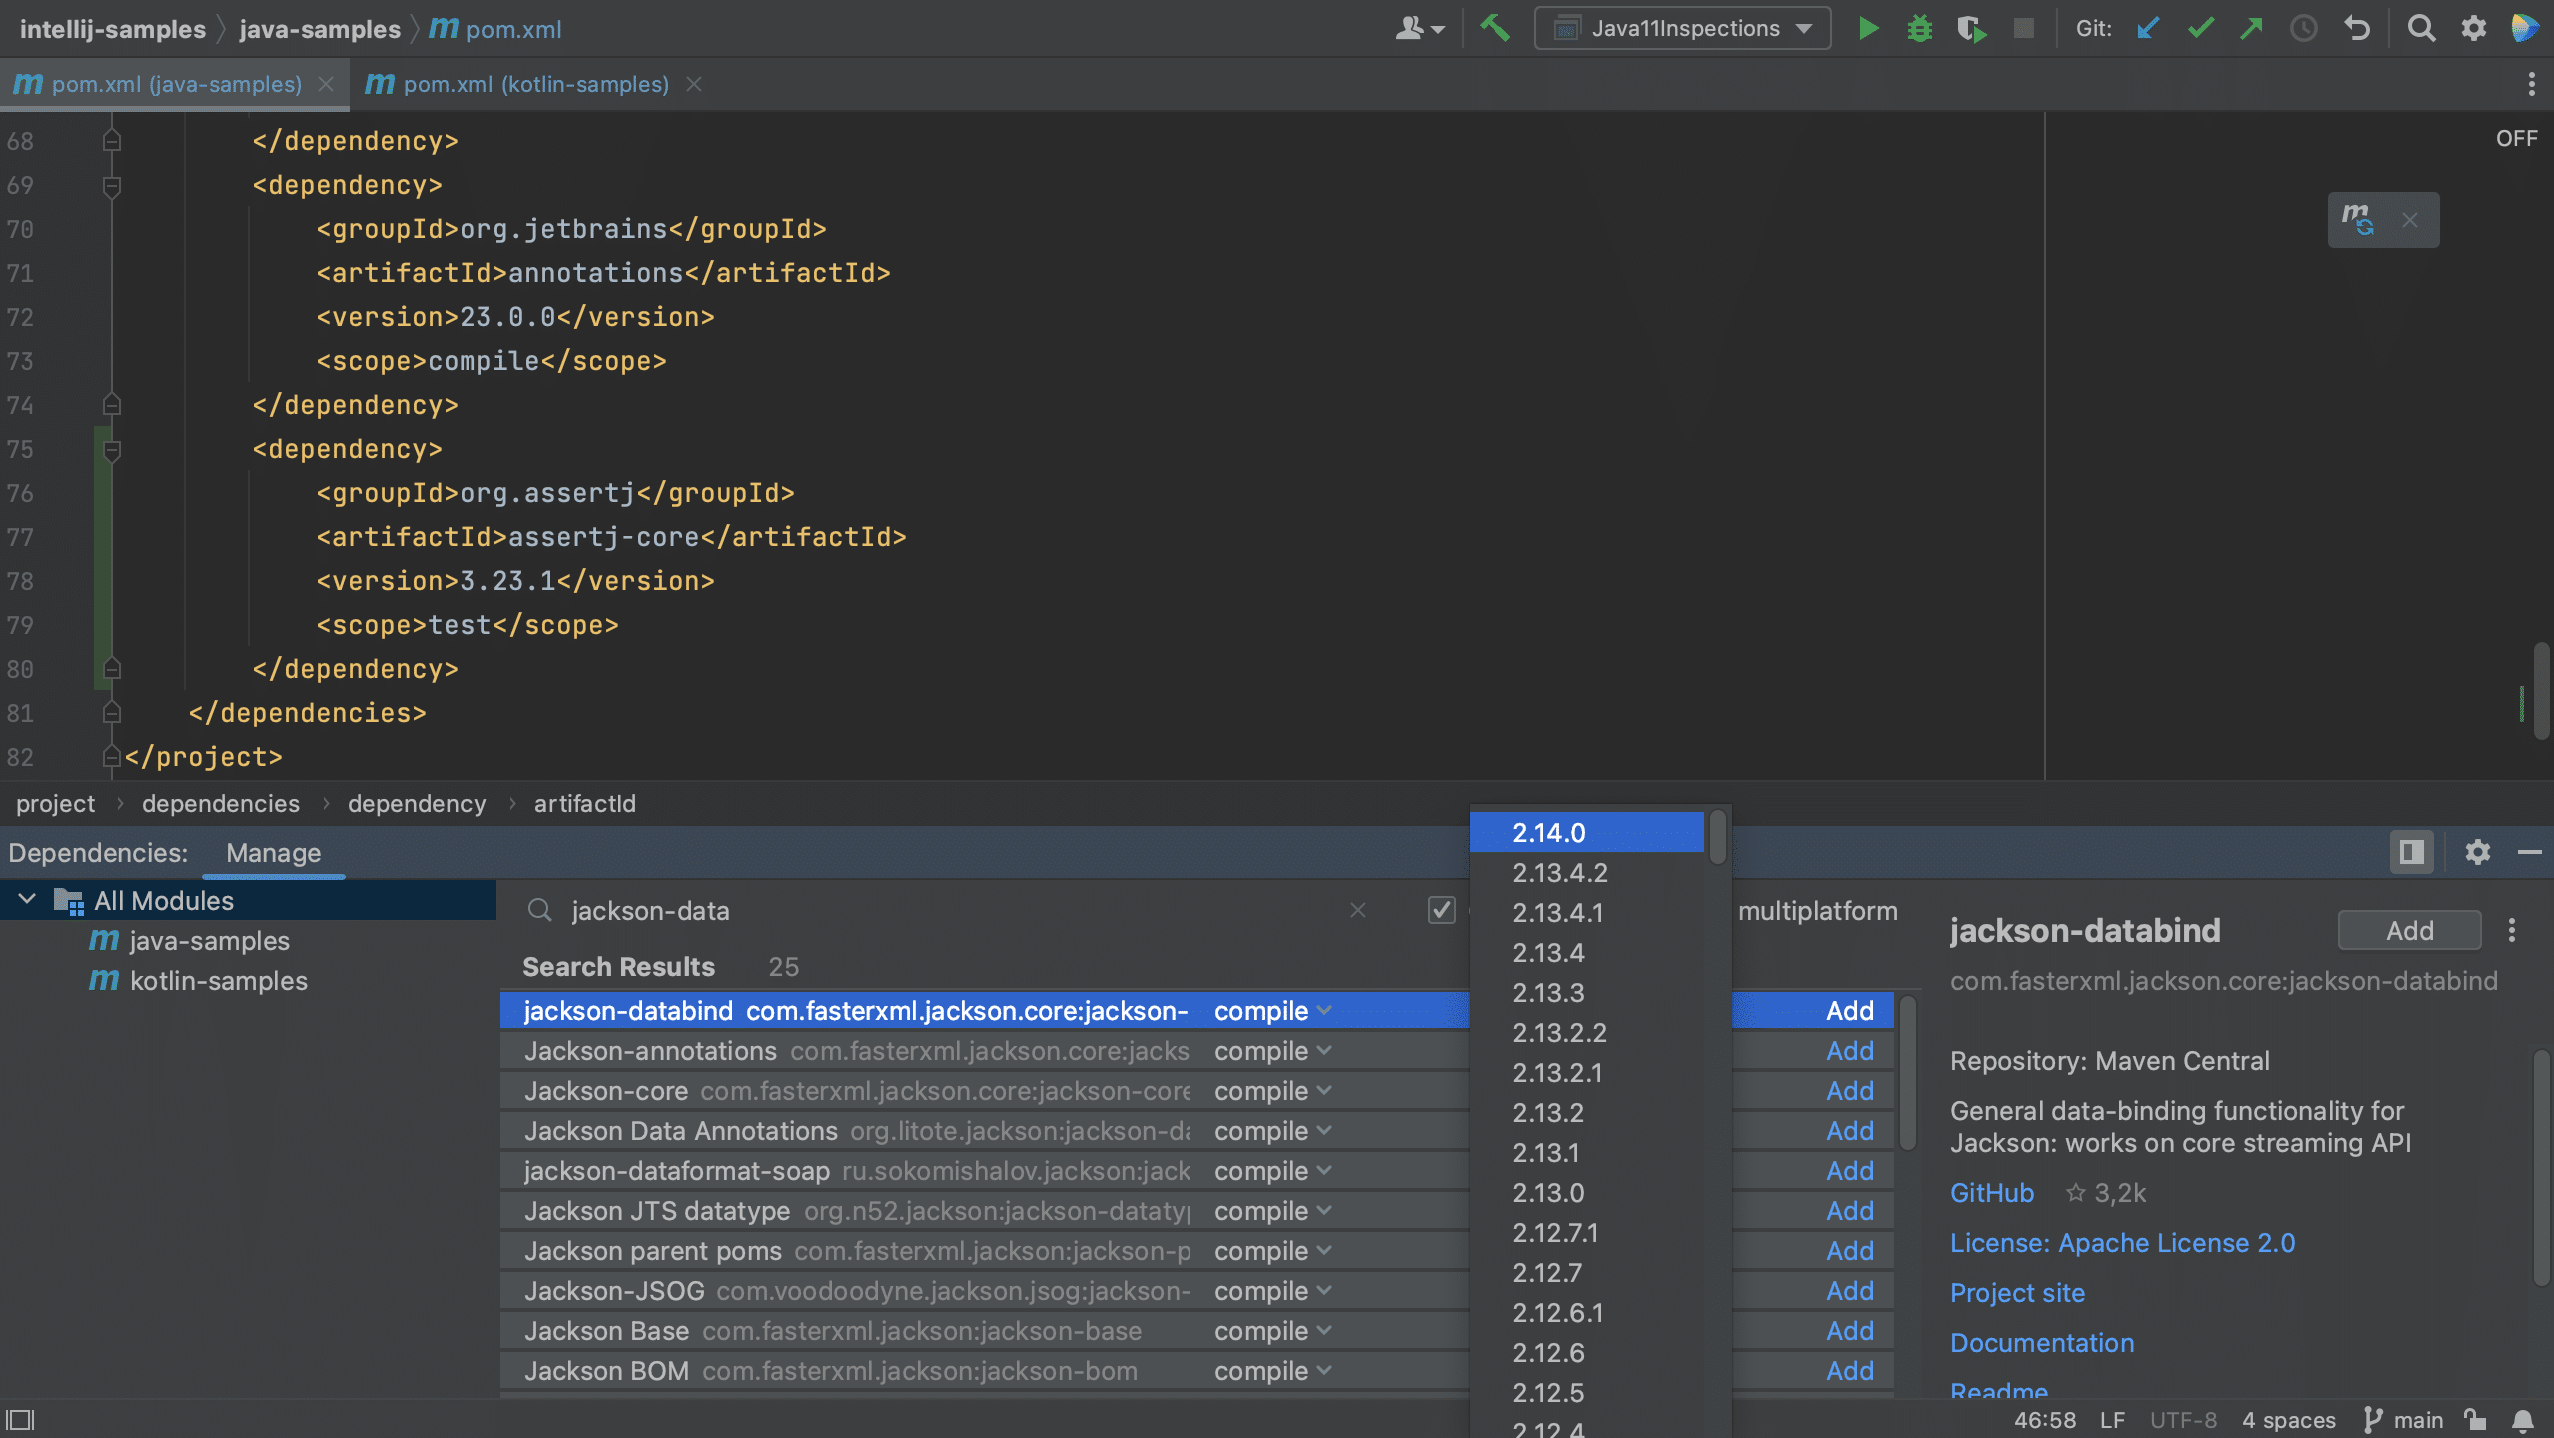
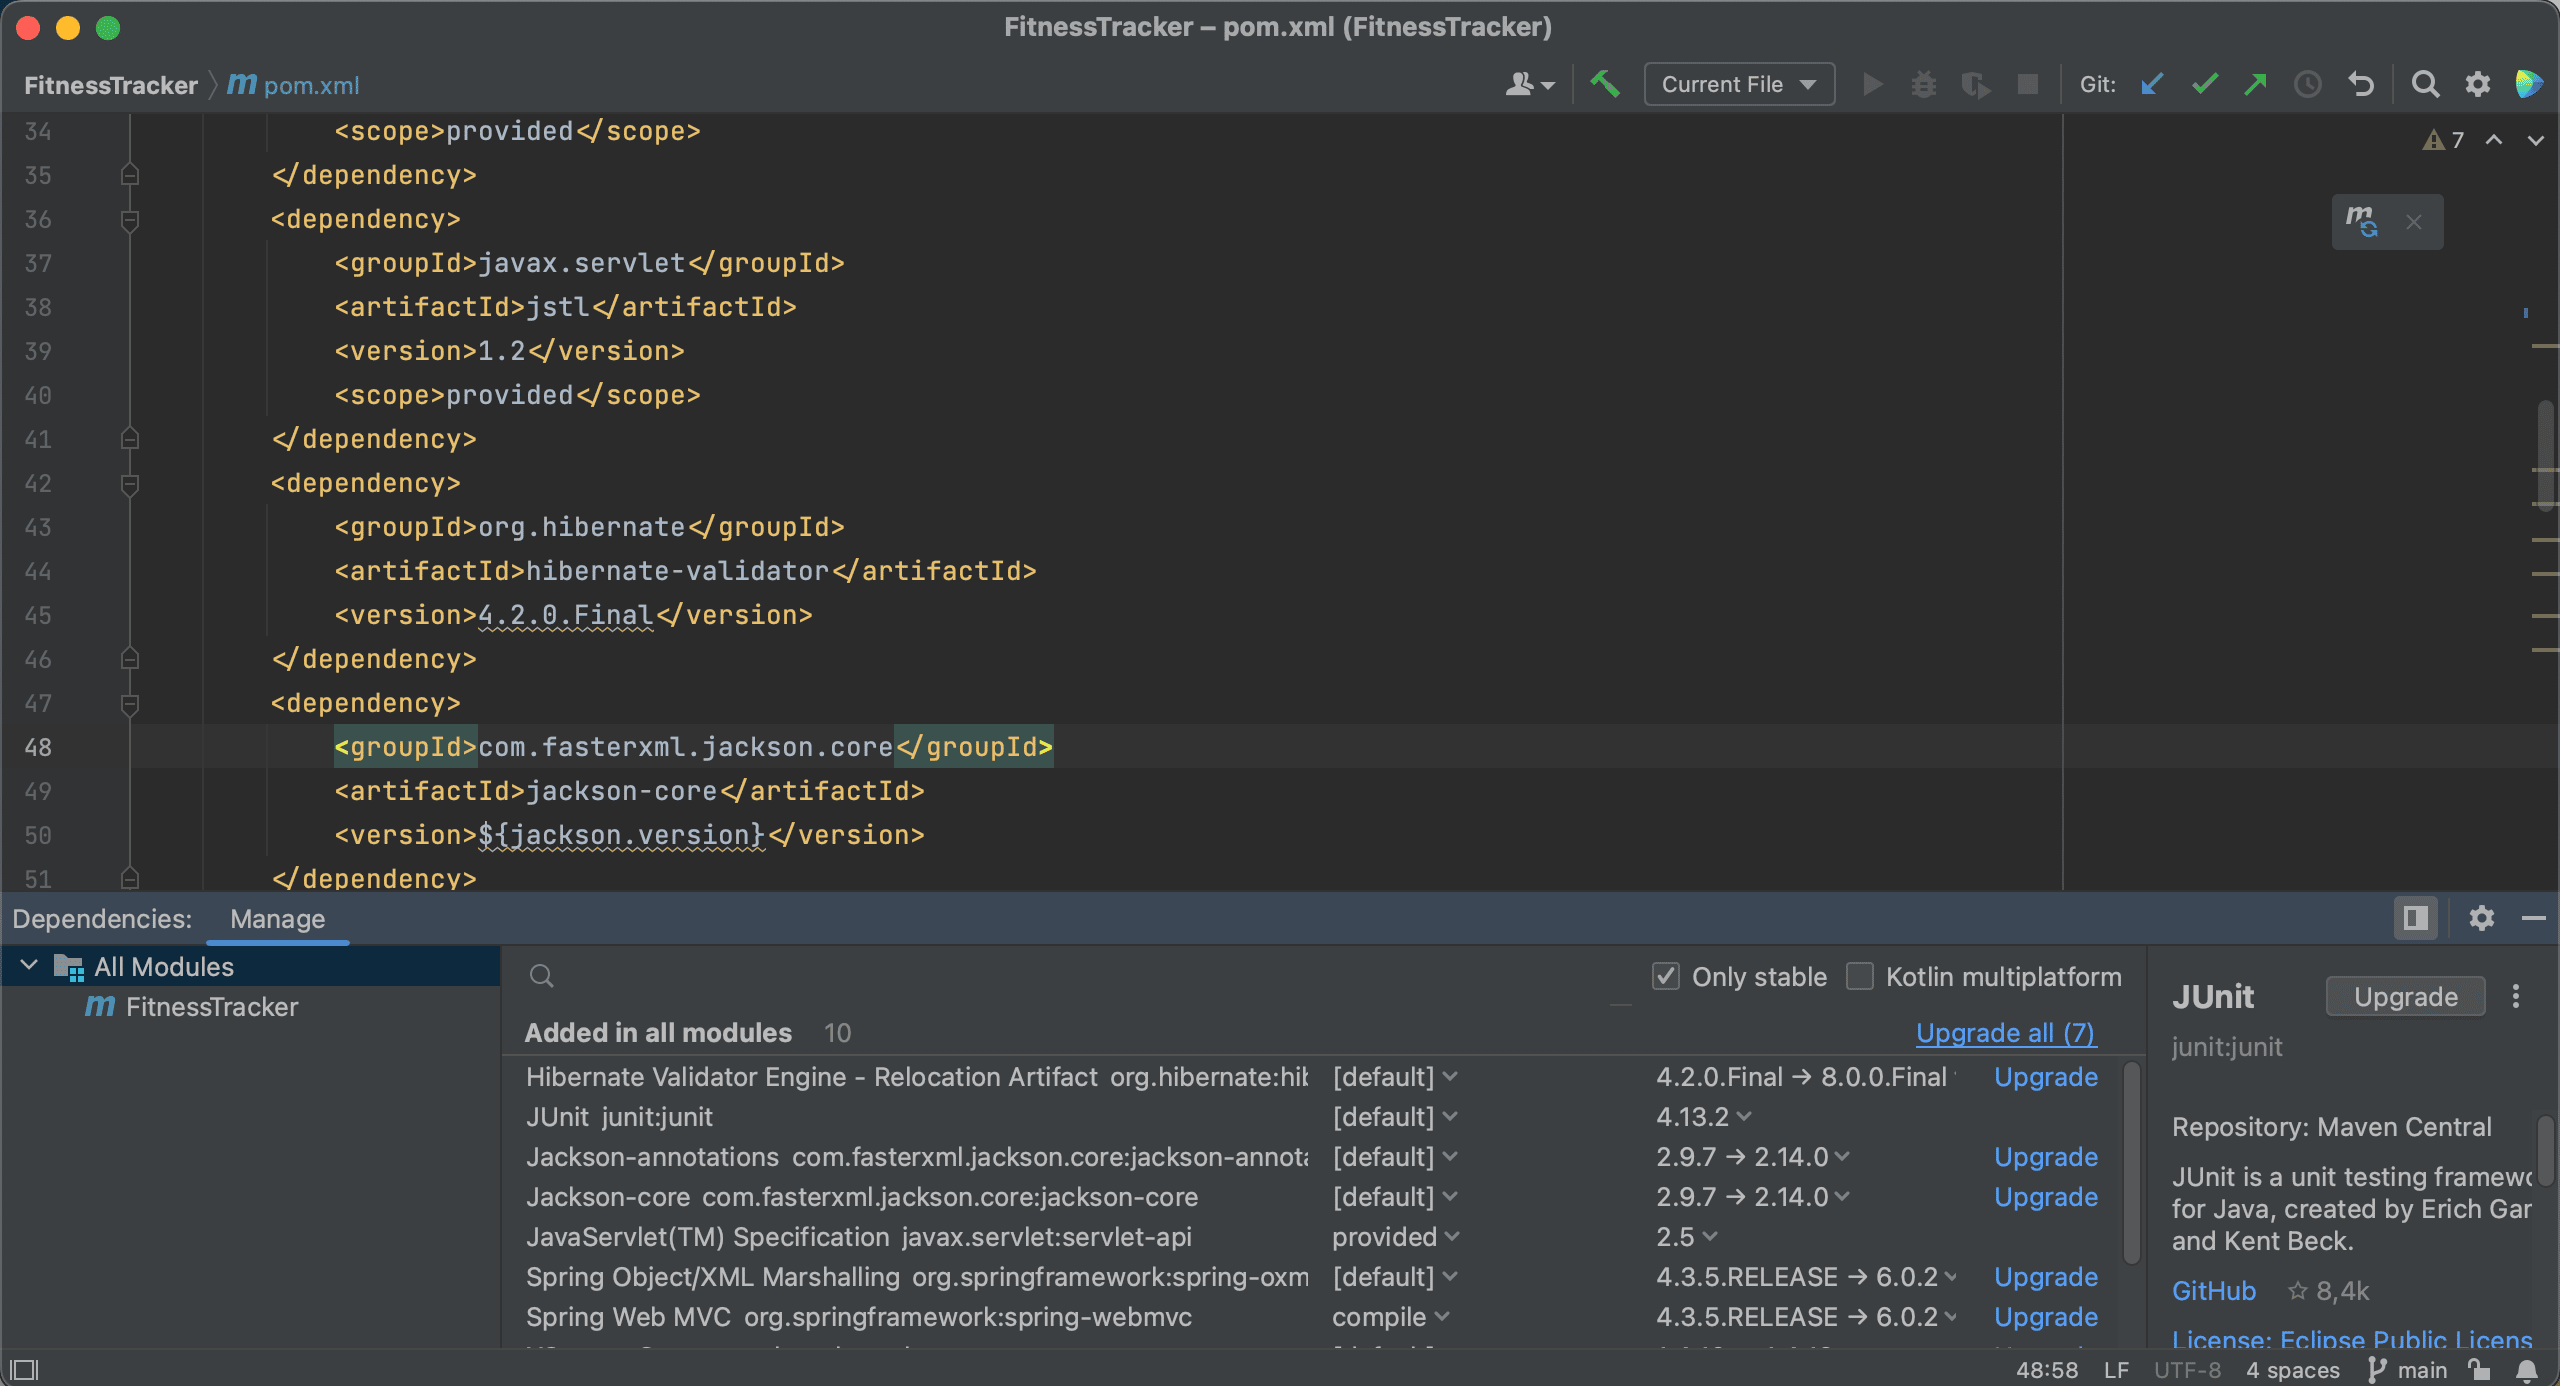
Next, let’s look for jackson-databind. We see that there are several versions available. Since we have selected Only stable, only stable versions are shown in the list.
If we uncheck this option, we see that the list of versions also includes the release candidates.
For production code, we probably want to use stable versions, so let’s select the Only stable checkbox again. With this option enabled, IntelliJ IDEA will exclude any dependencies that have no stable versions, and hide them from the list. Now we can select the latest stable version and add this to our project. Let’s also Load Maven Changes again.
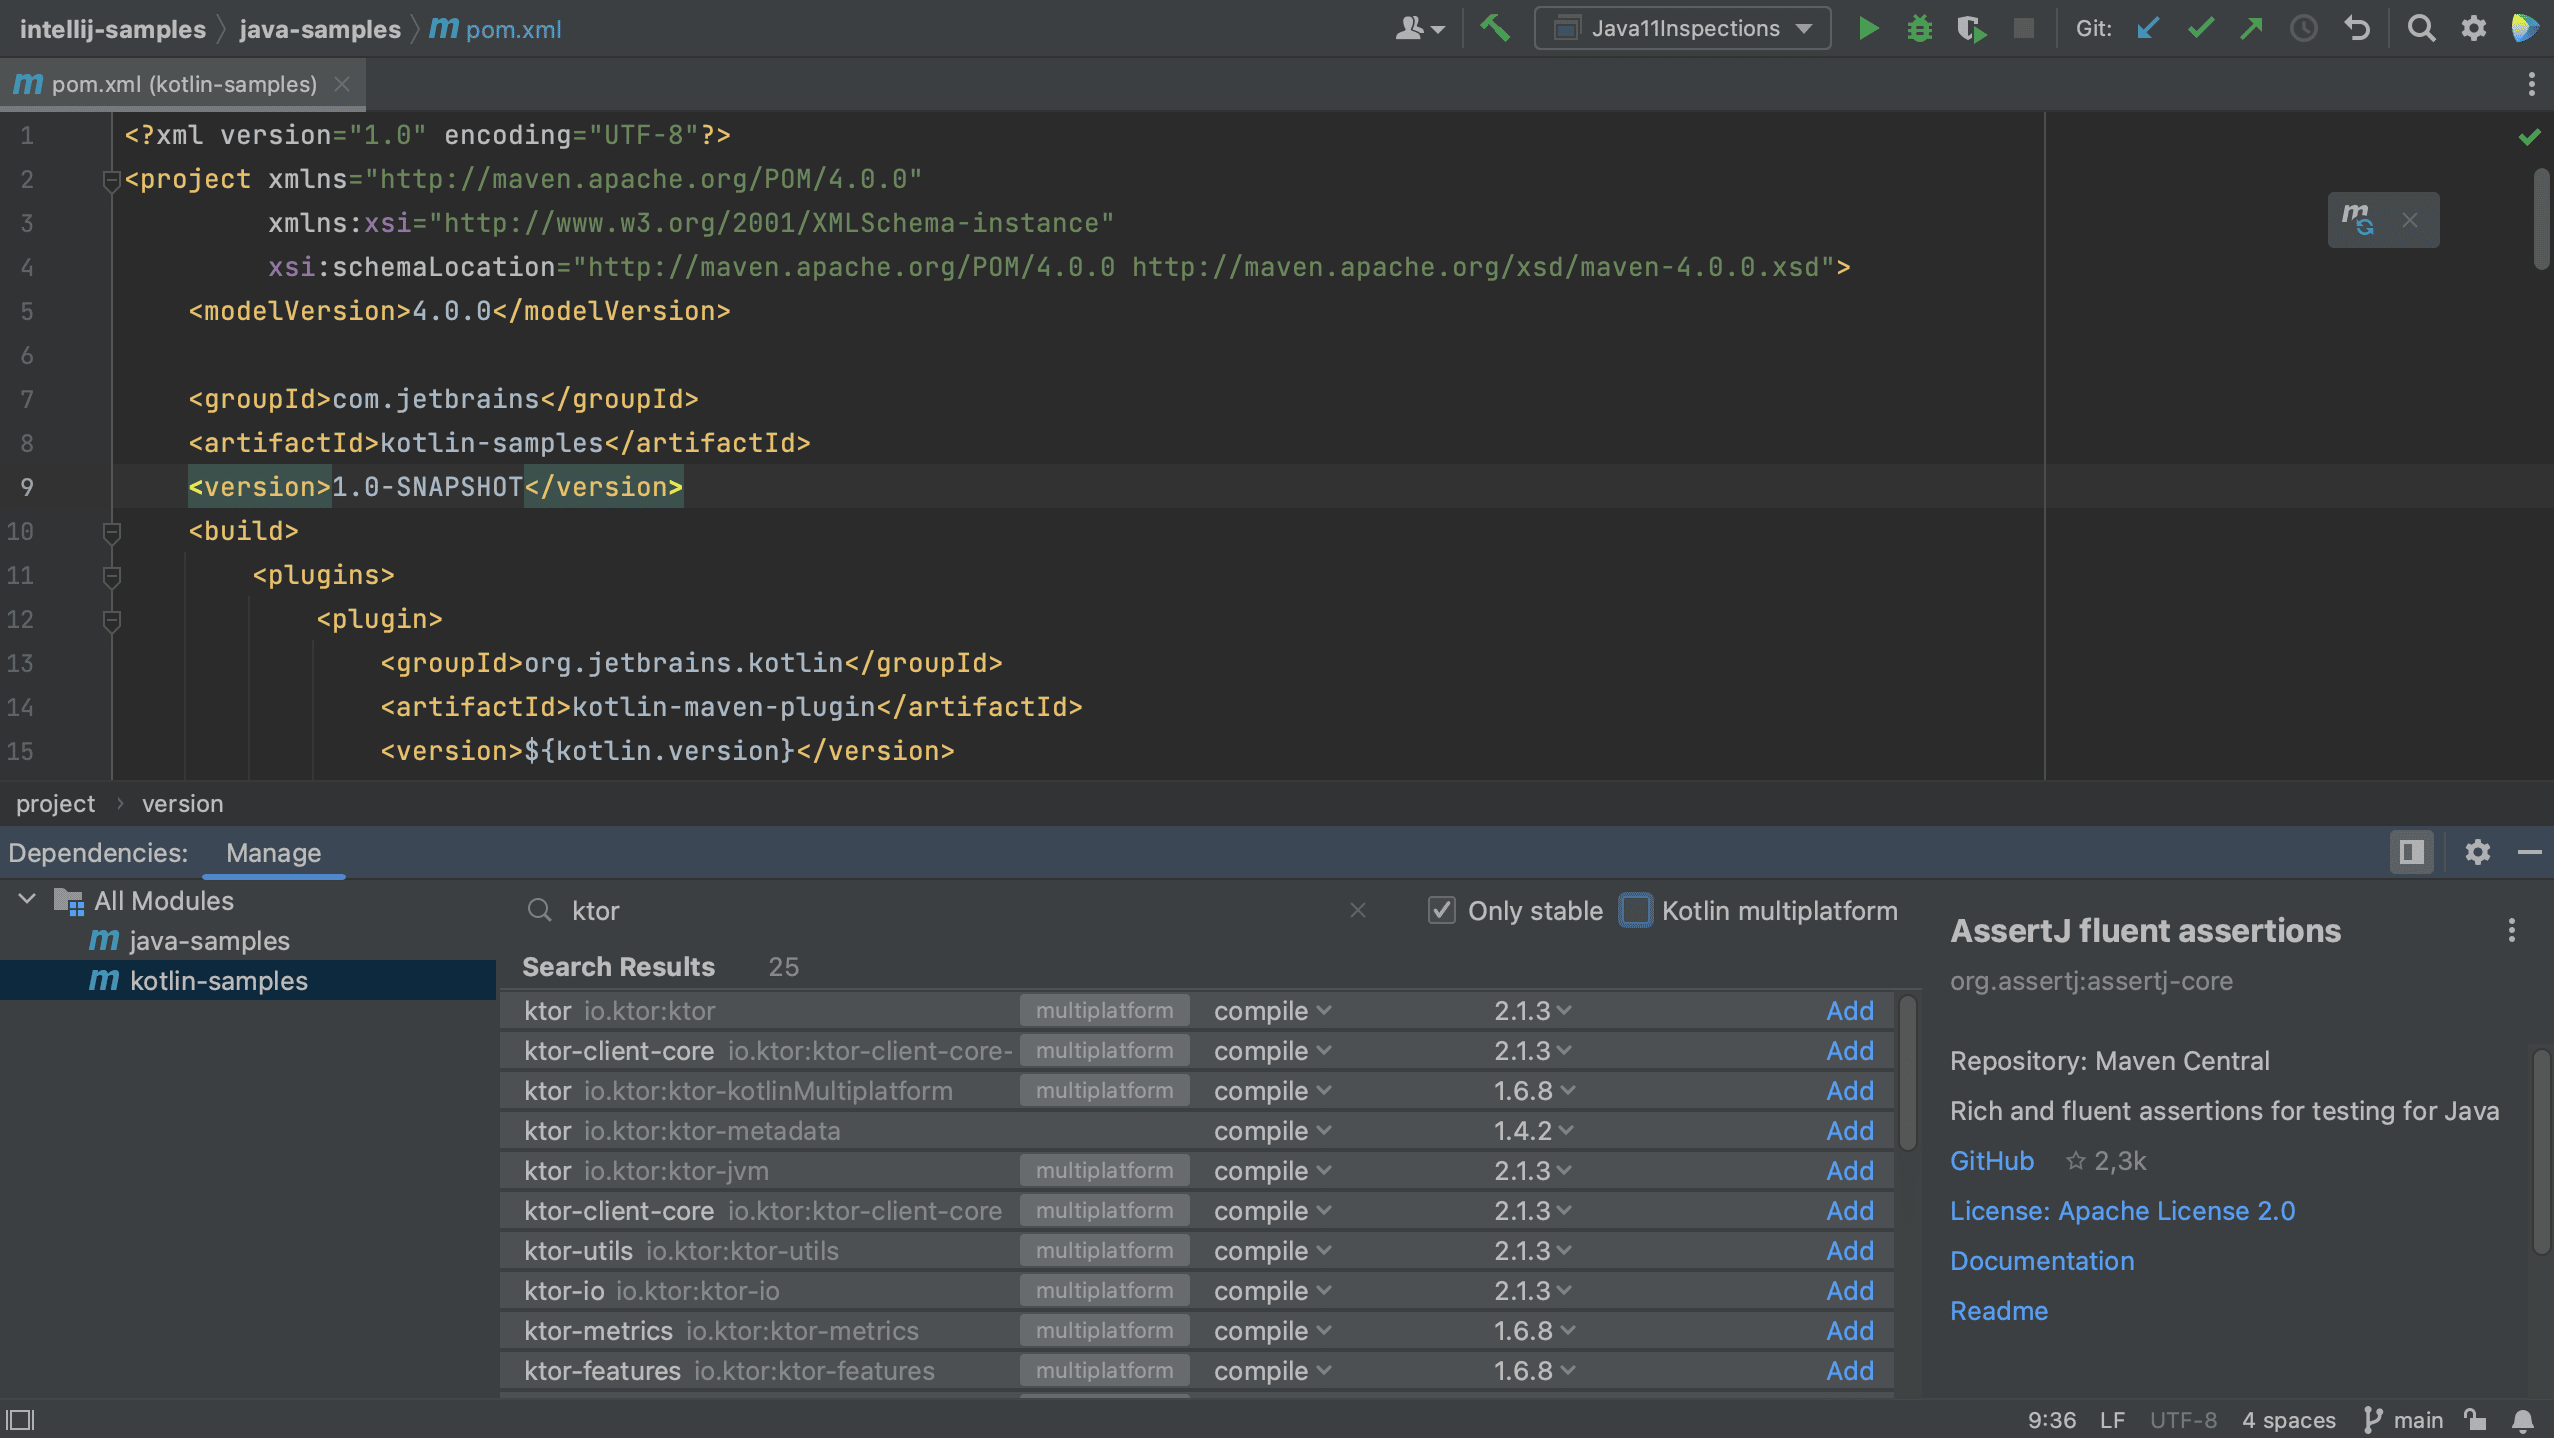
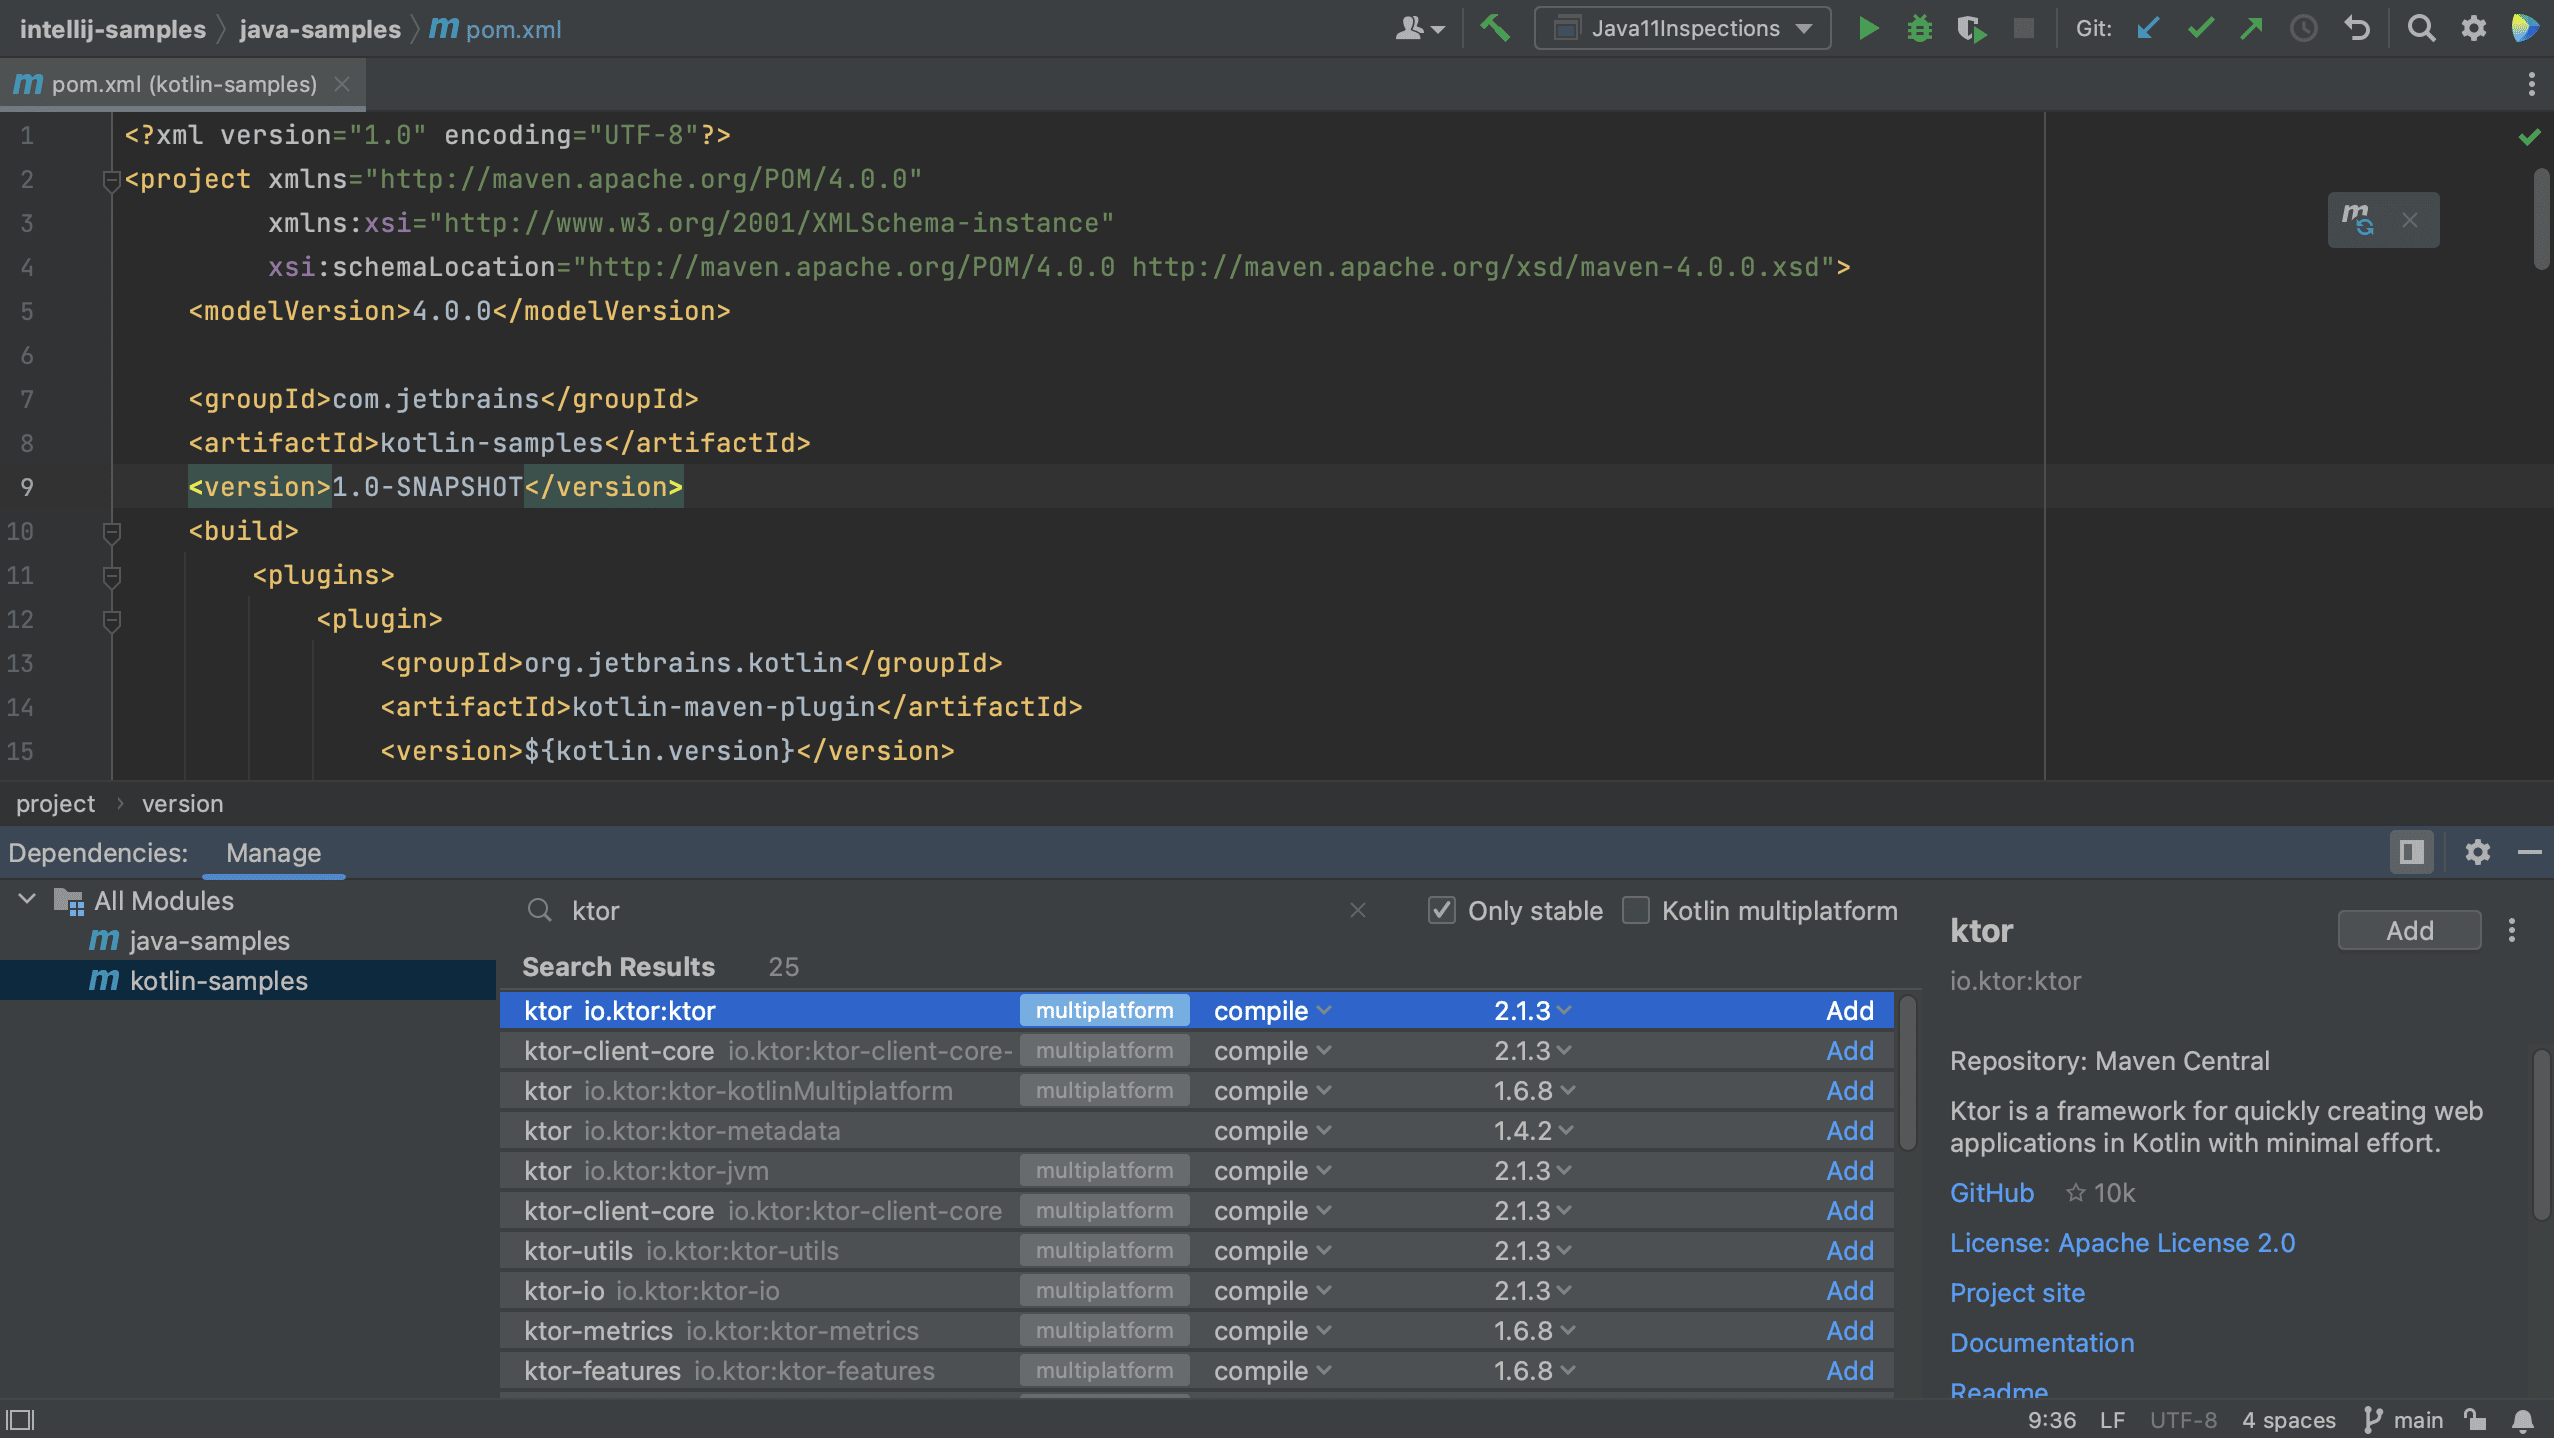
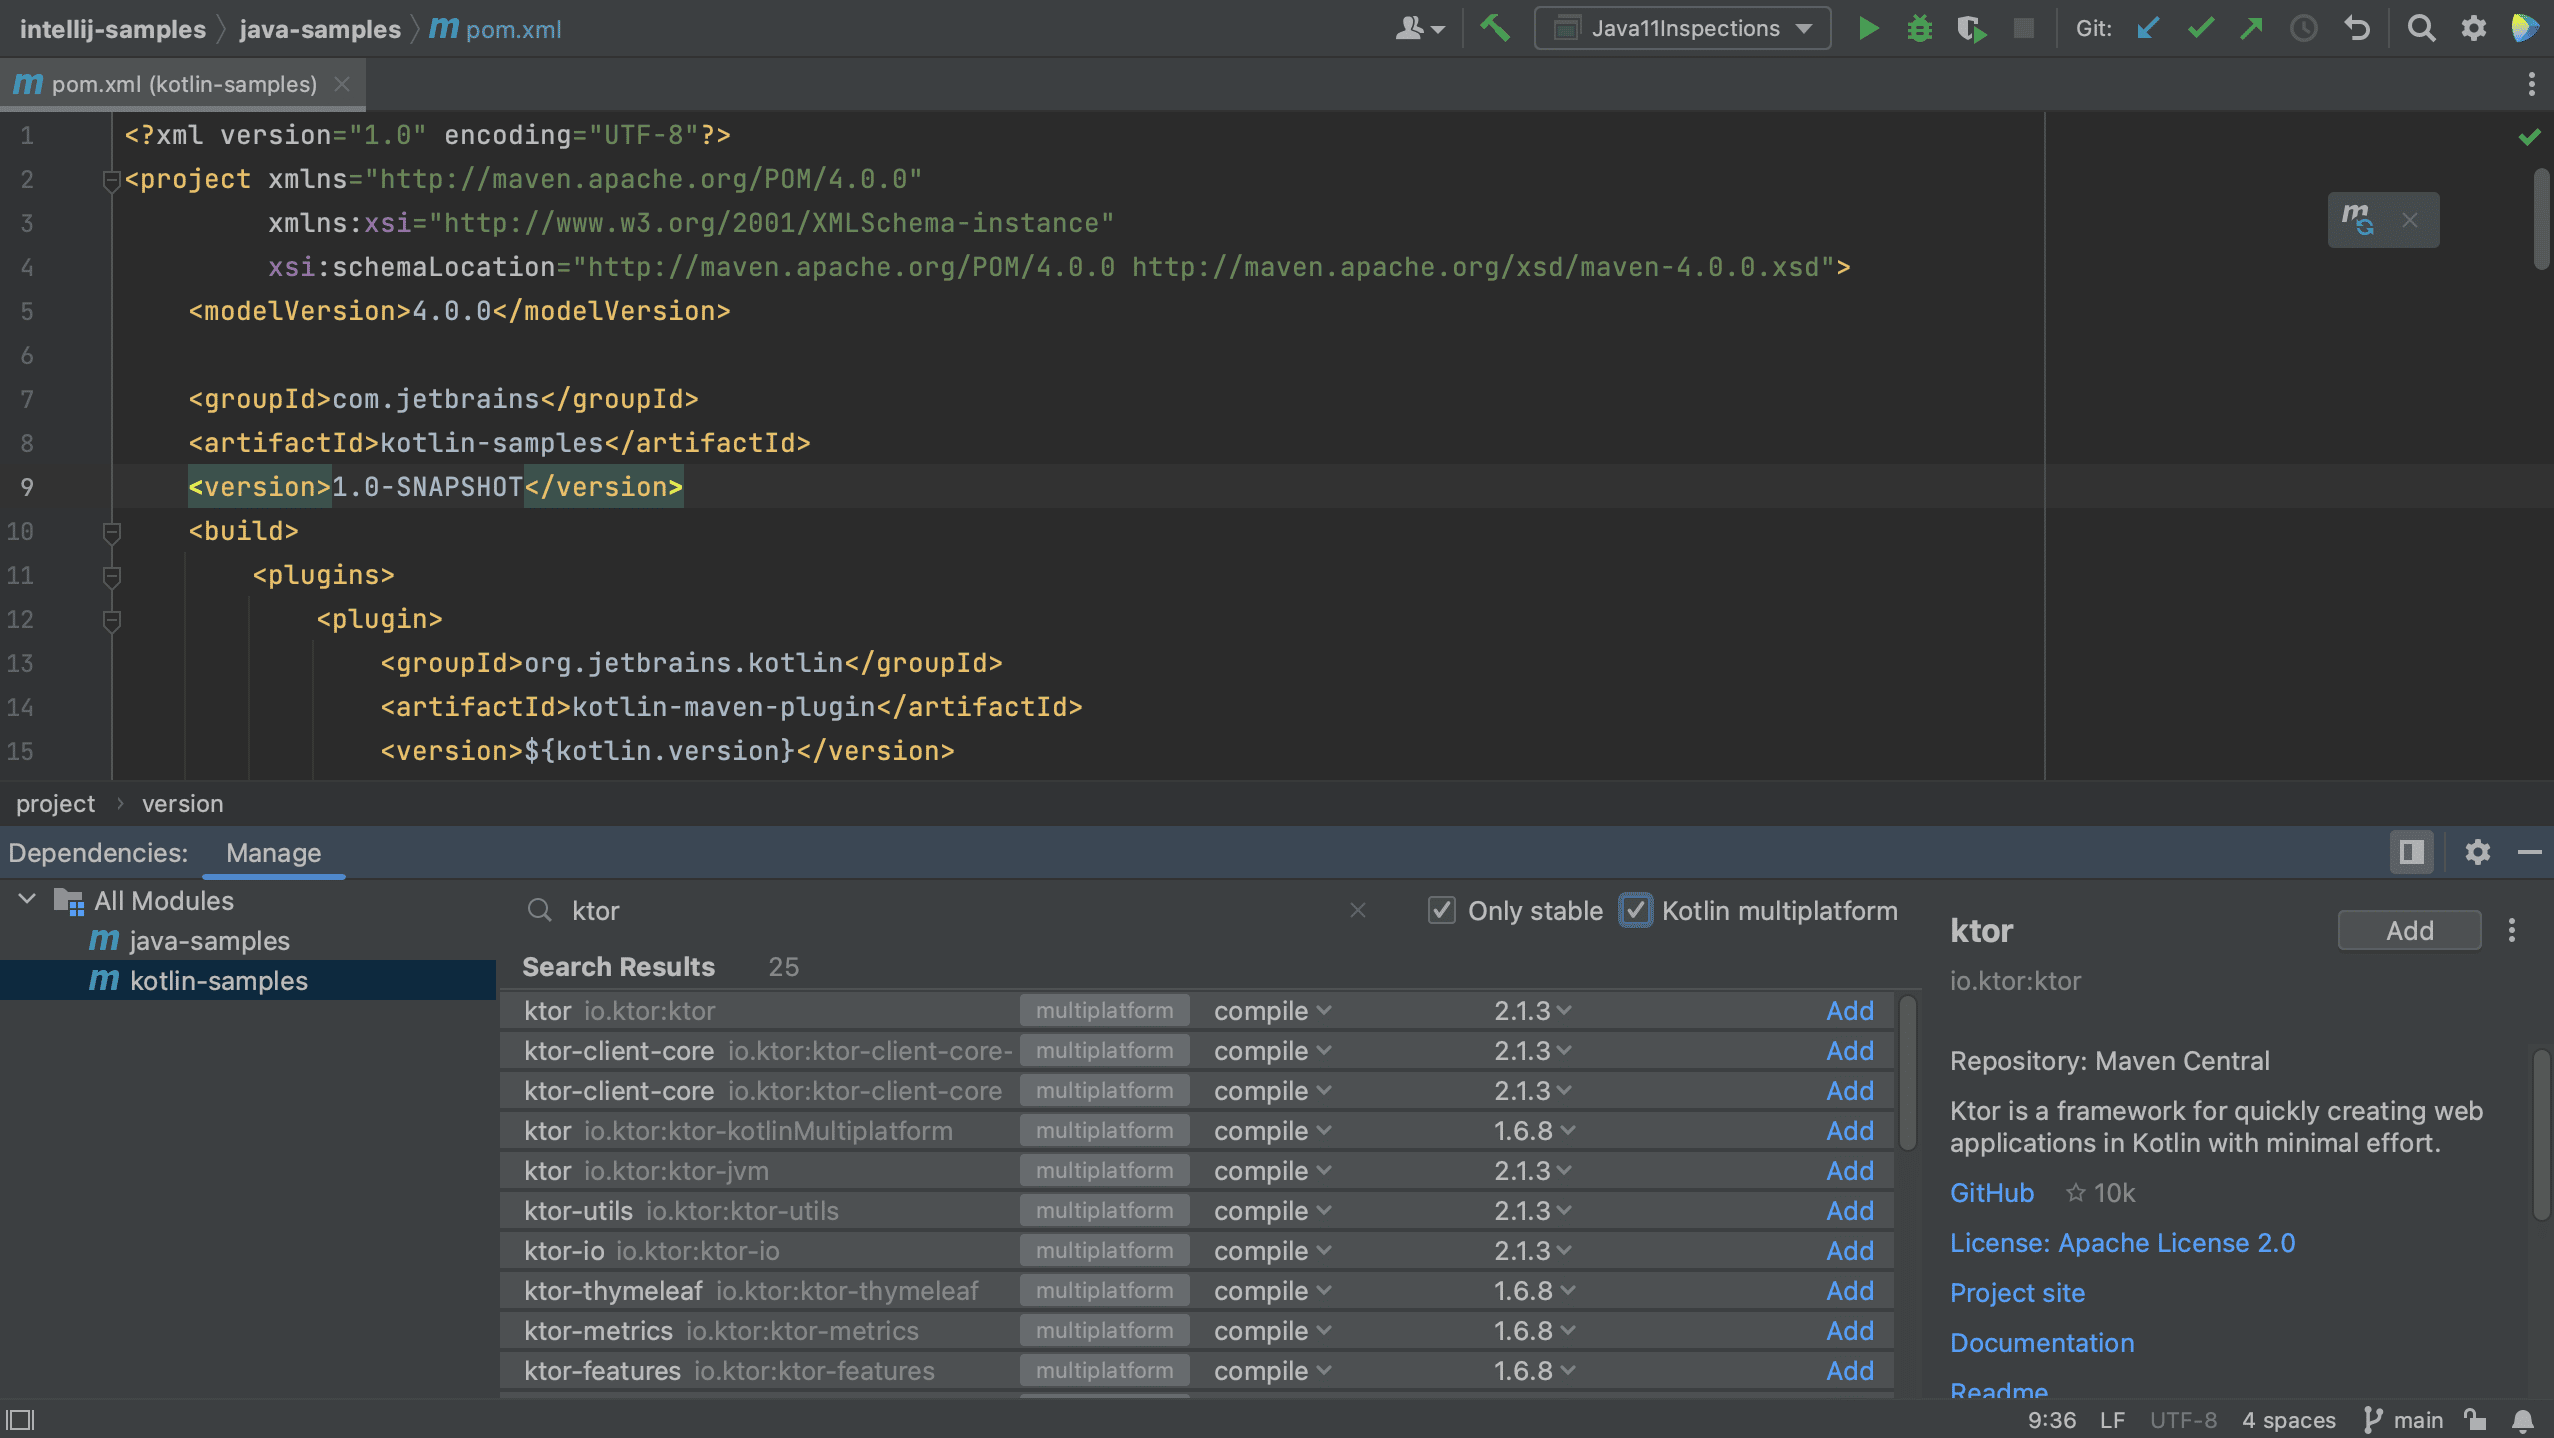
Finally, let’s also add a new dependency to the Kotlin module. Let’s switch to the Kotlin module and open the pom.xml for this module. Open the Dependencies Tool Window and search for Ktor.
Notice that some dependencies are marked as Multiplatform.
If we want to see only Kotlin multiplatform dependencies, we can select the Kotlin multiplatform checkbox, as shown below.
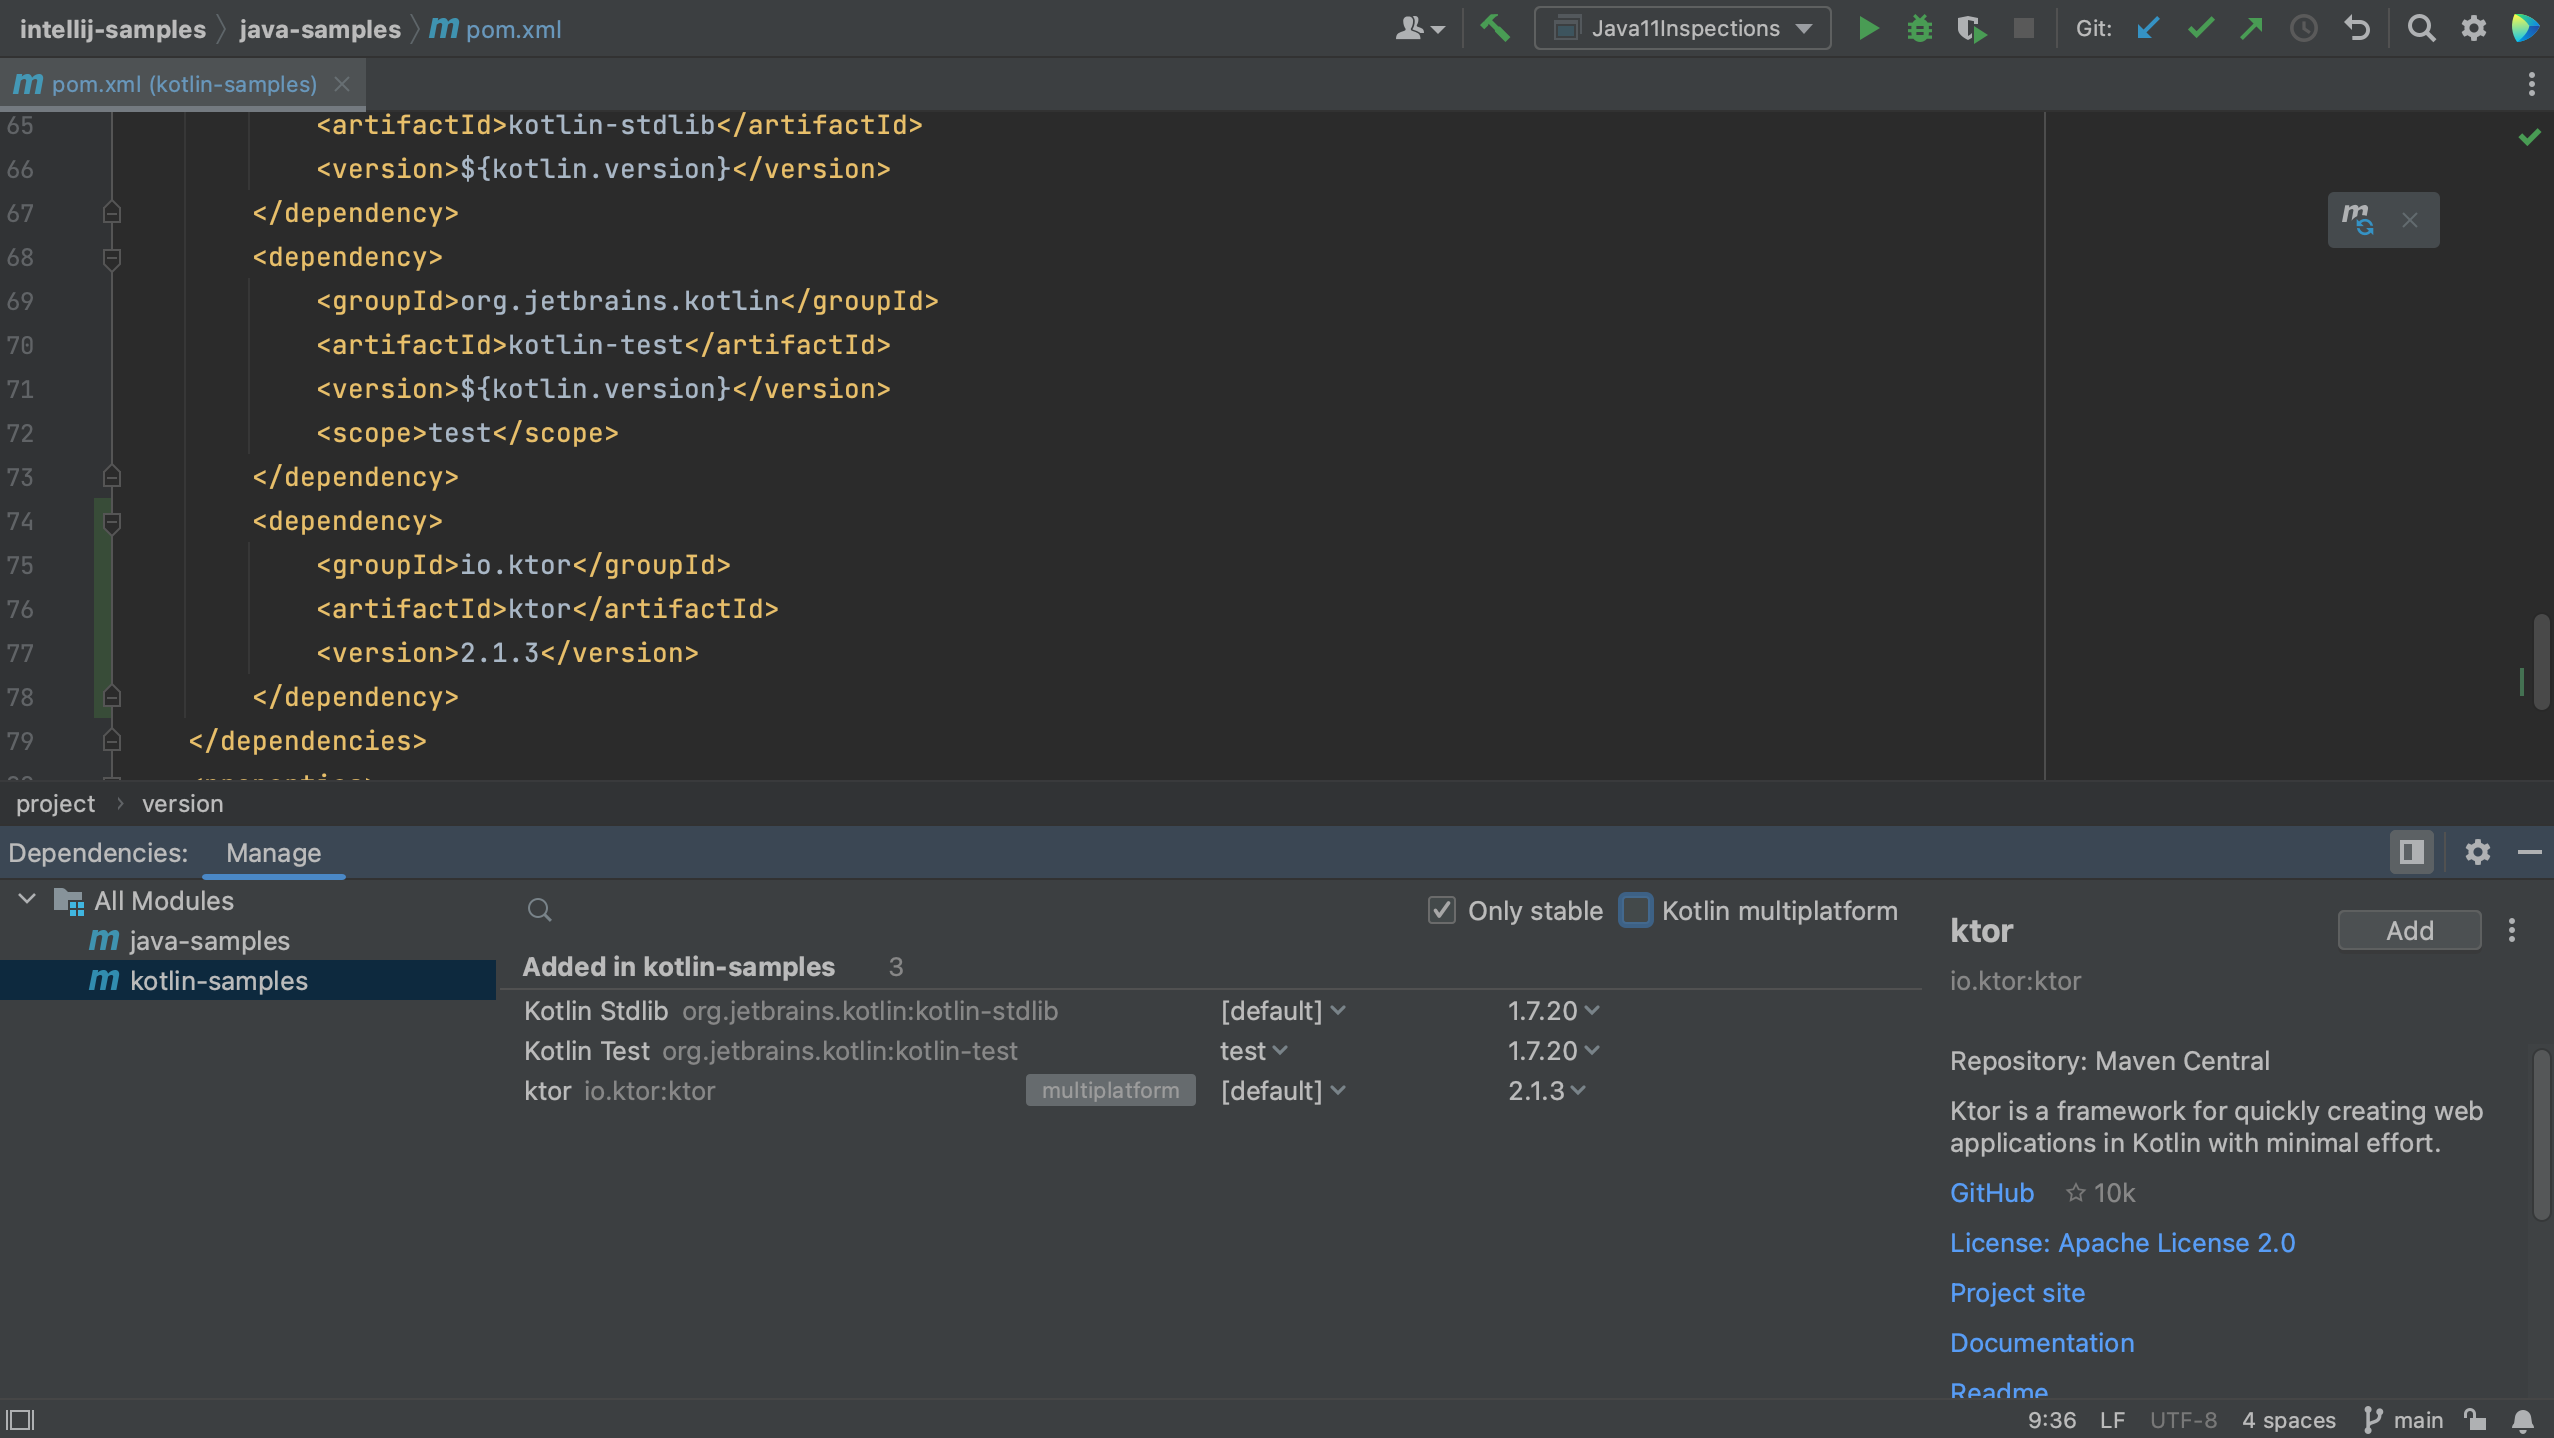
When we click Add to the right of the Ktor dependency, we see that Ktor is added to the list of dependencies and to the pom.xml for the Kotlin module.
Upgrade dependencies
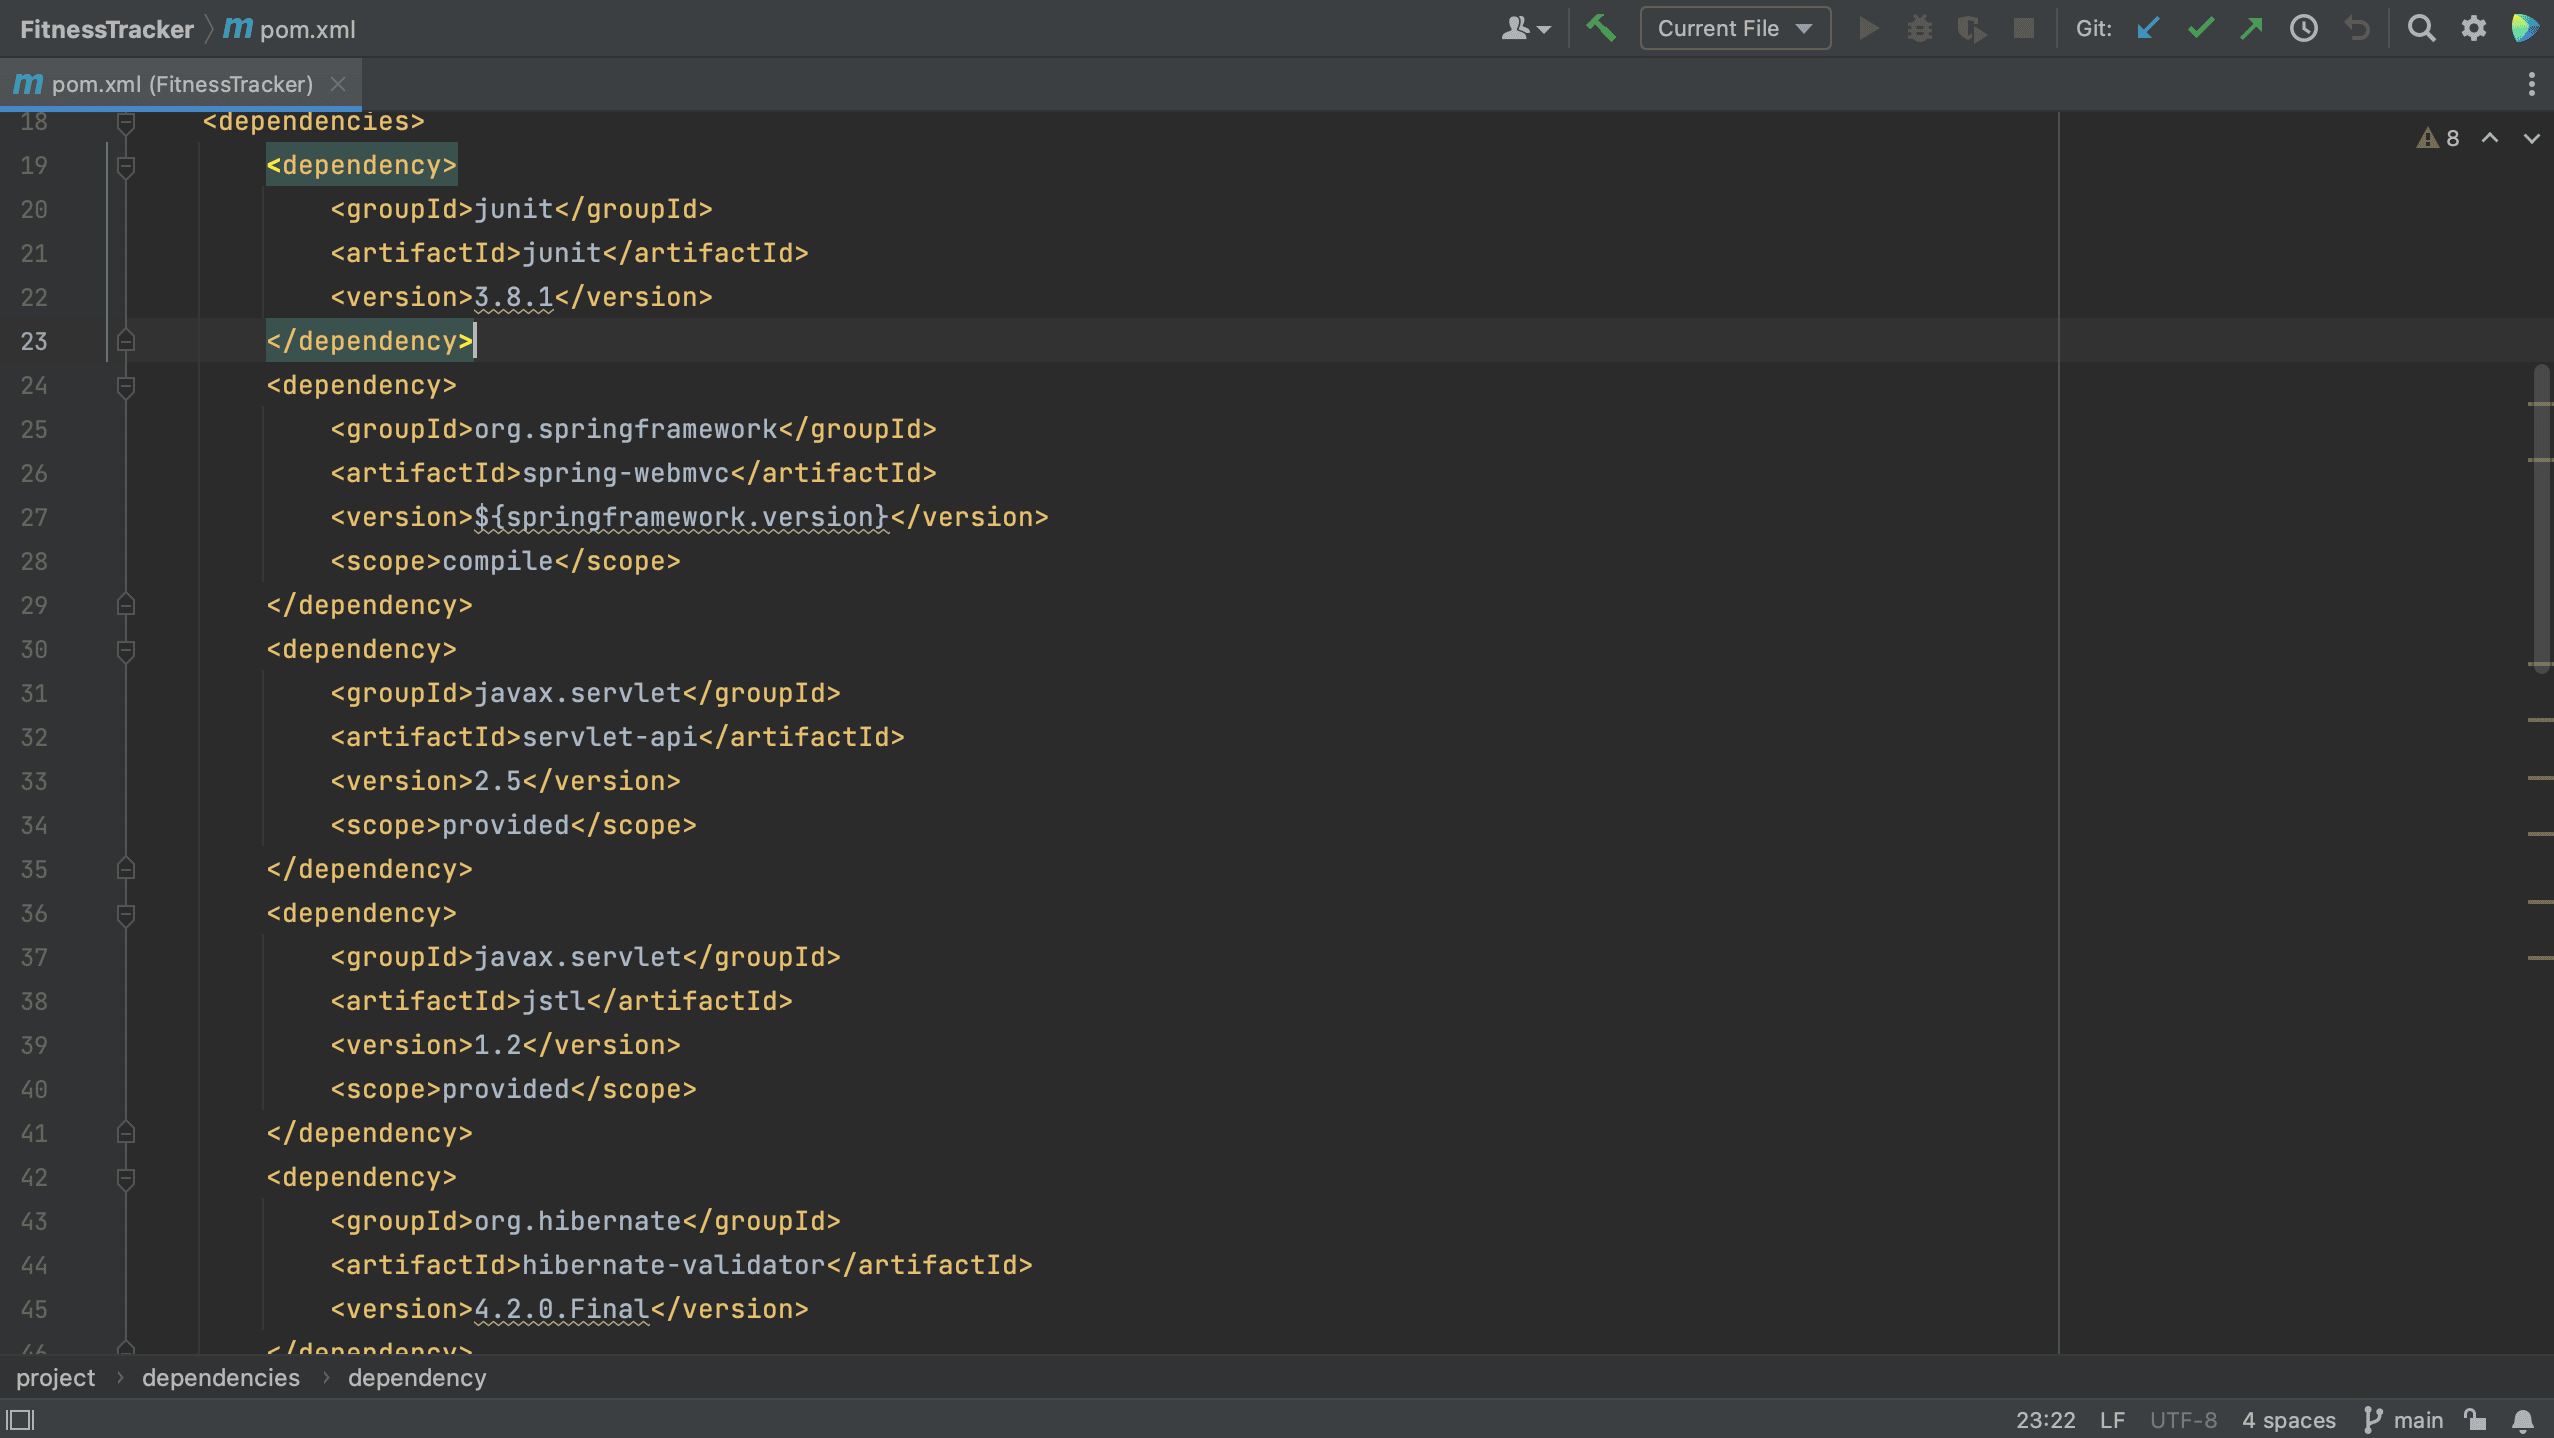
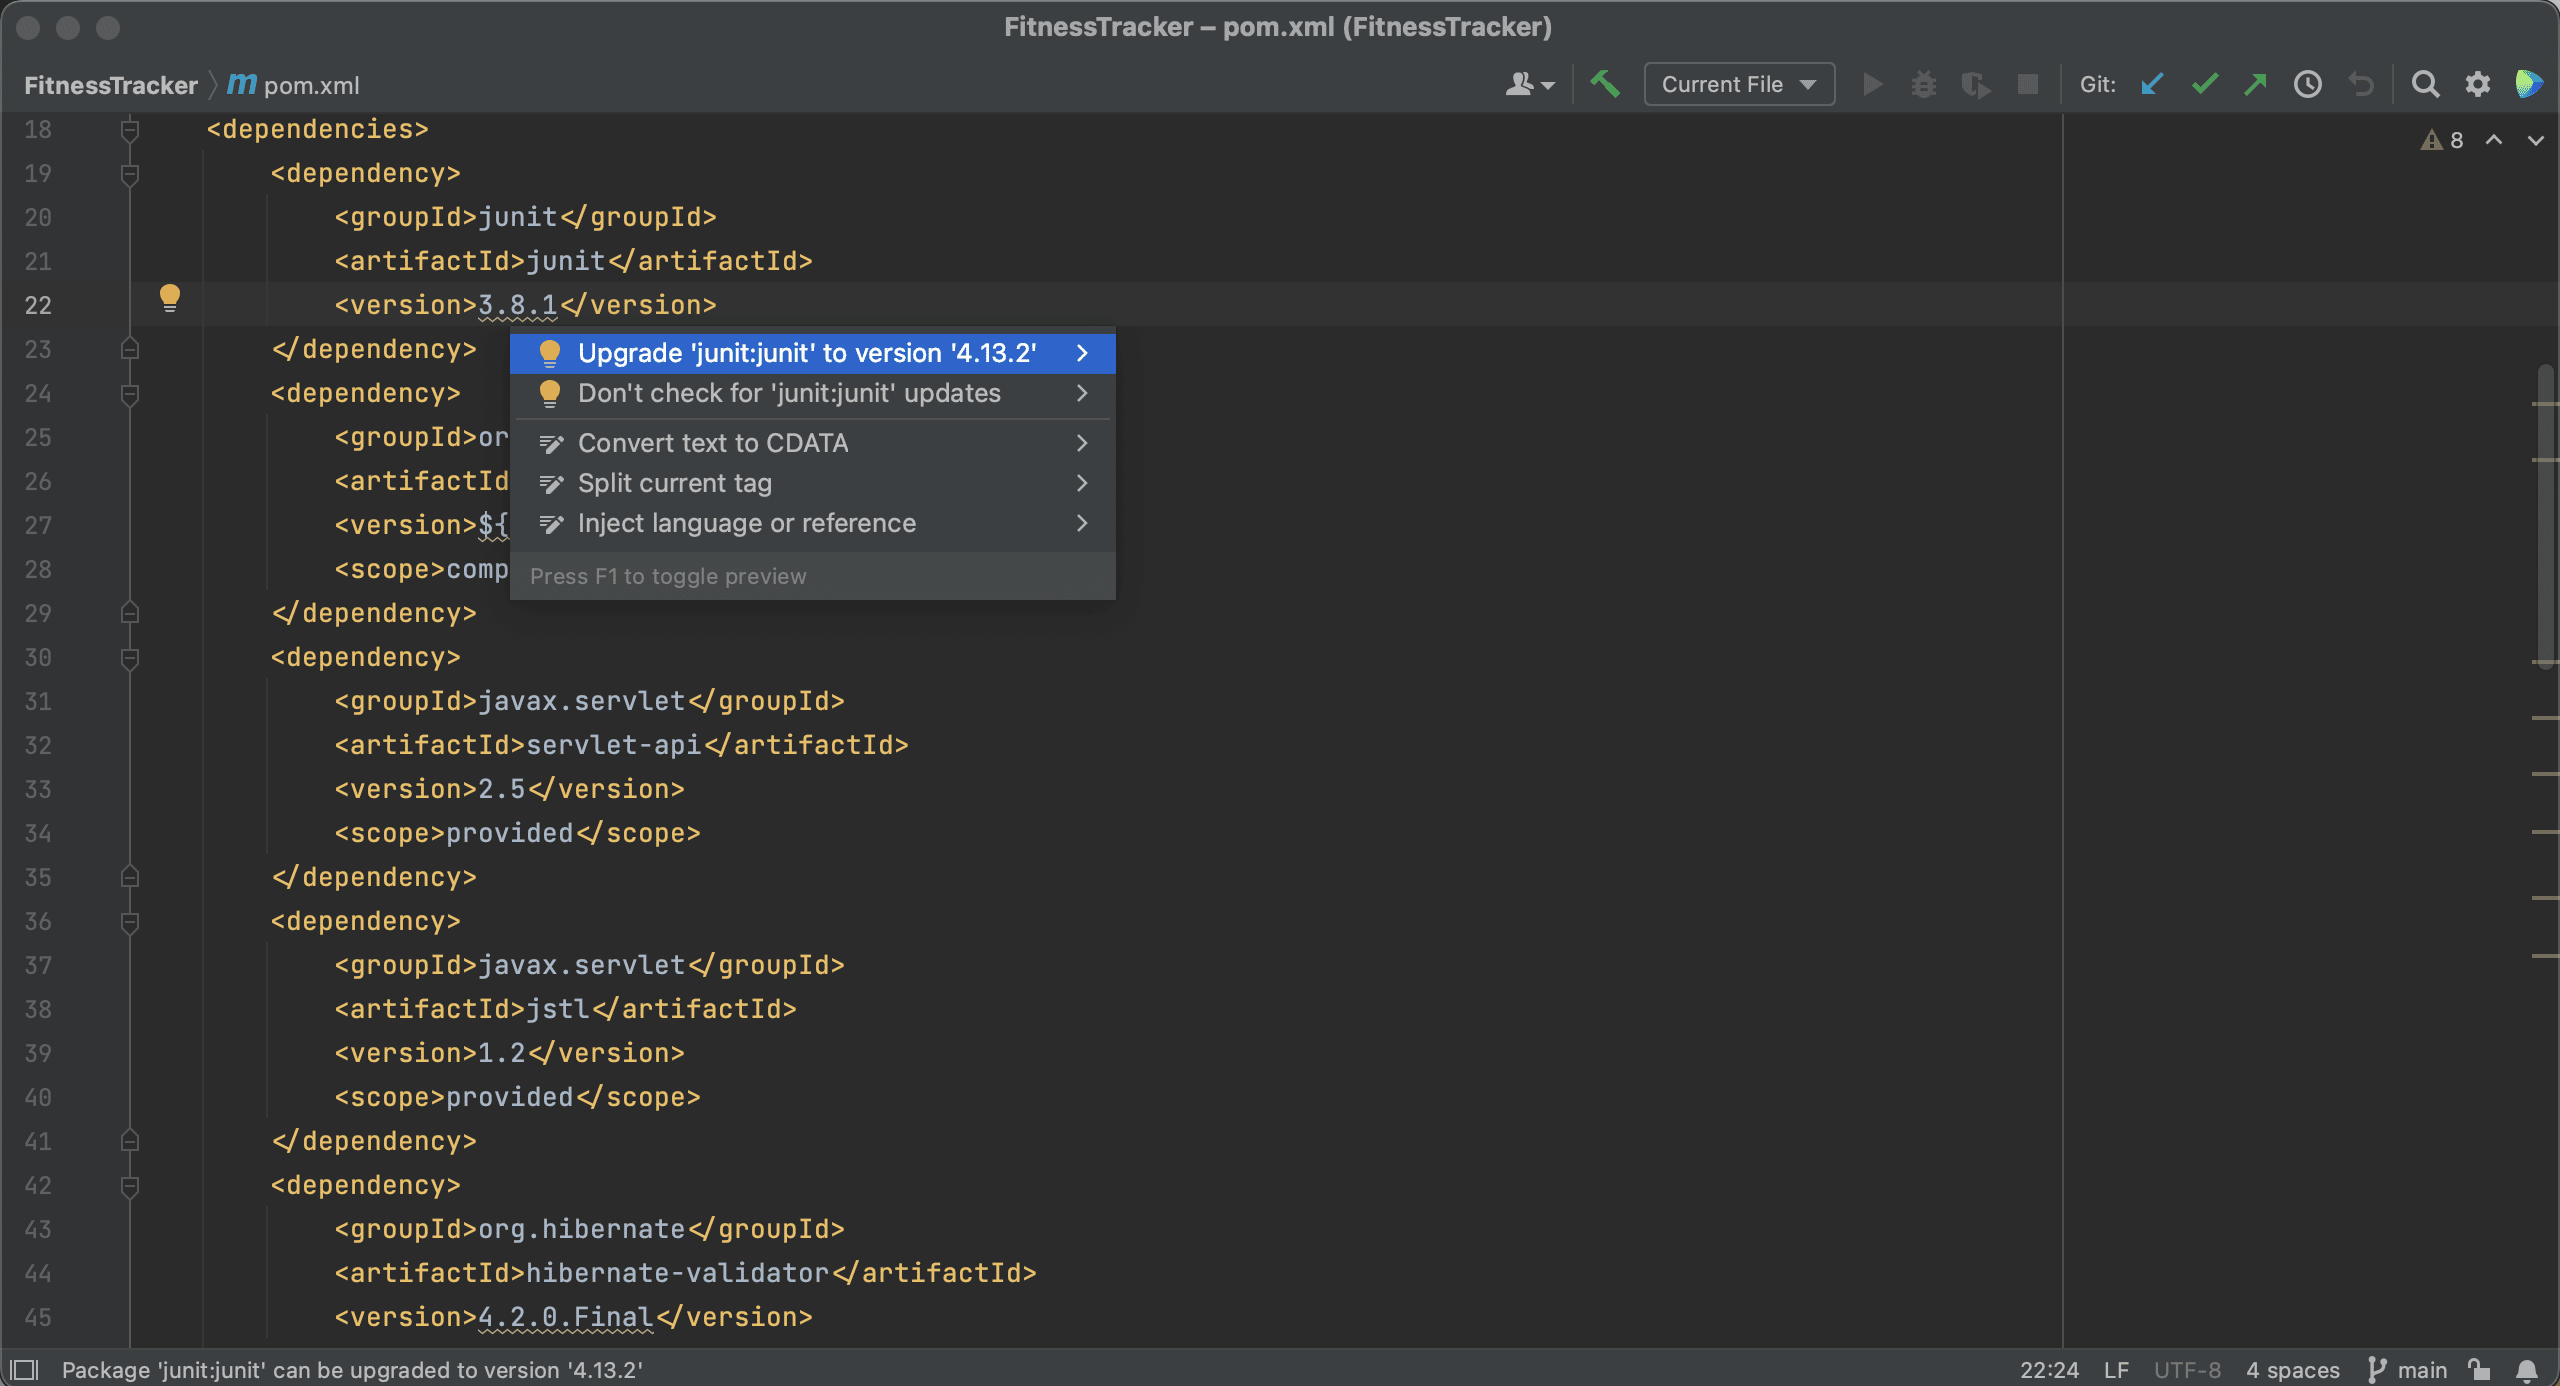
We will also need to keep our dependencies up to date. To show you how IntelliJ IDEA can help, we are using this extremely outdated project as an example. In the pom.xml below, we see that several dependencies are marked with squiggly lines underneath them.
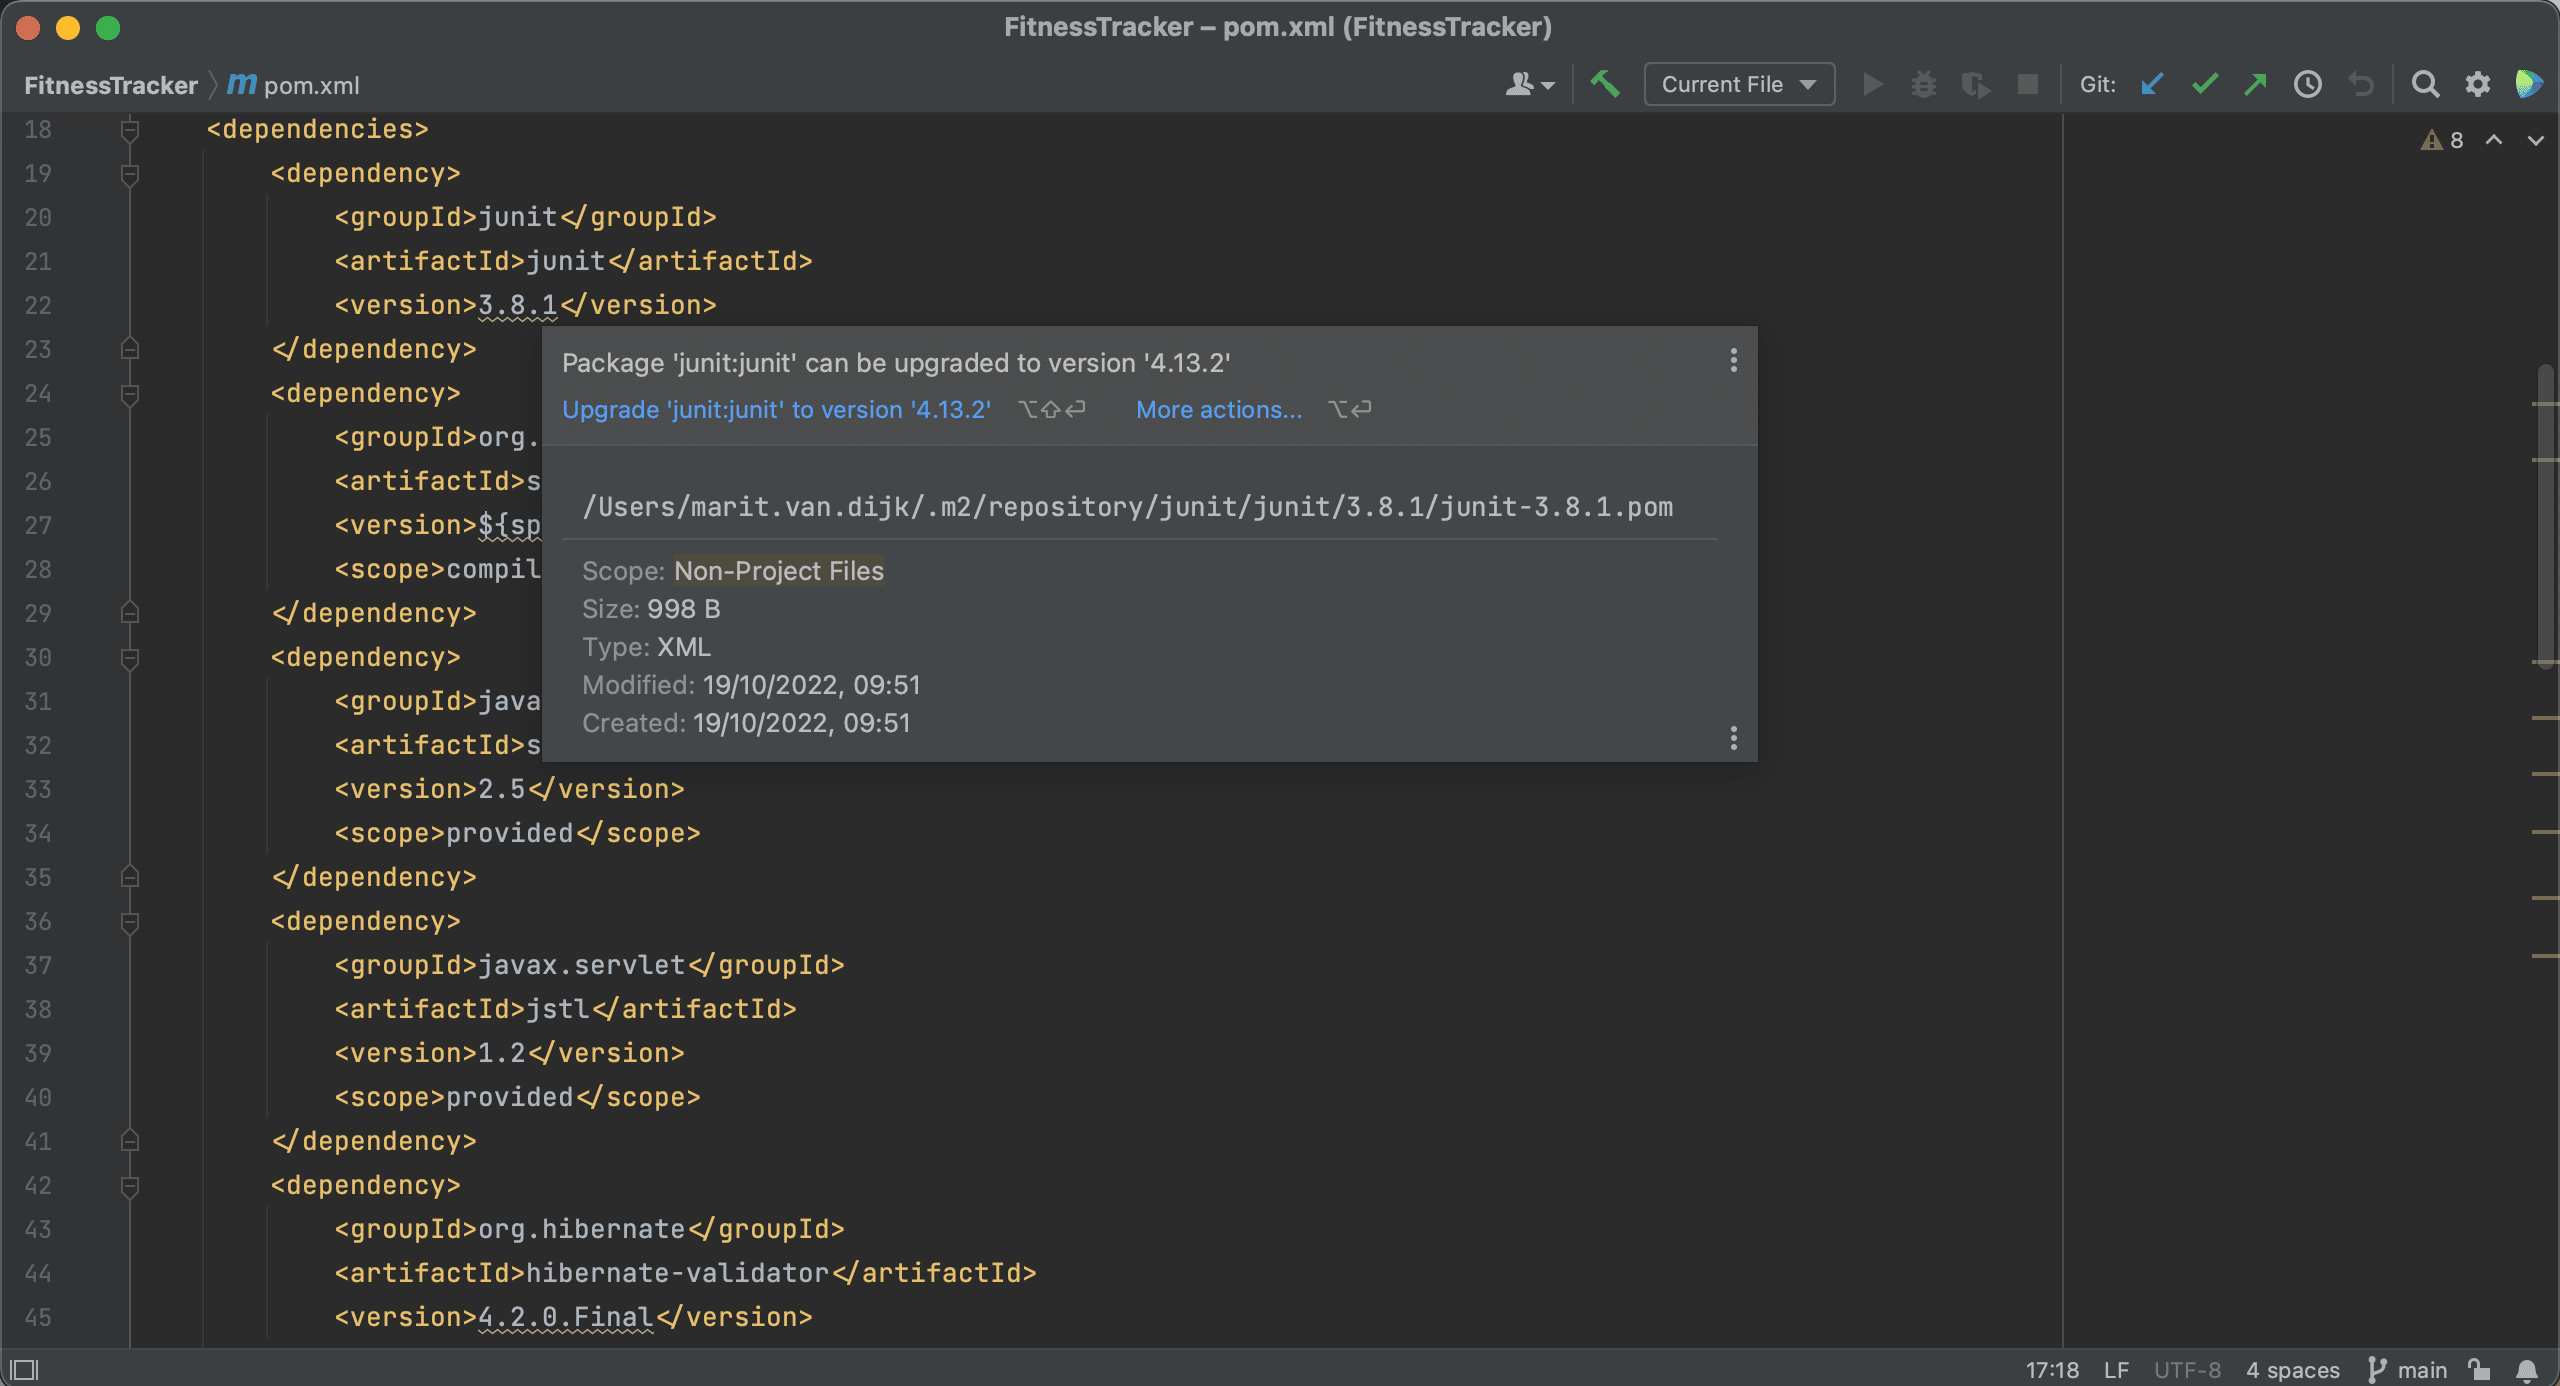
IntelliJ IDEA will show the suggestion to upgrade when we hover over the dependency, and we can click the suggestion to upgrade the dependencies.
Alternatively, we can use Context Actions ⌥⏎ (on macOS) or Alt+Enter (on Windows & Linux) to upgrade these dependencies.
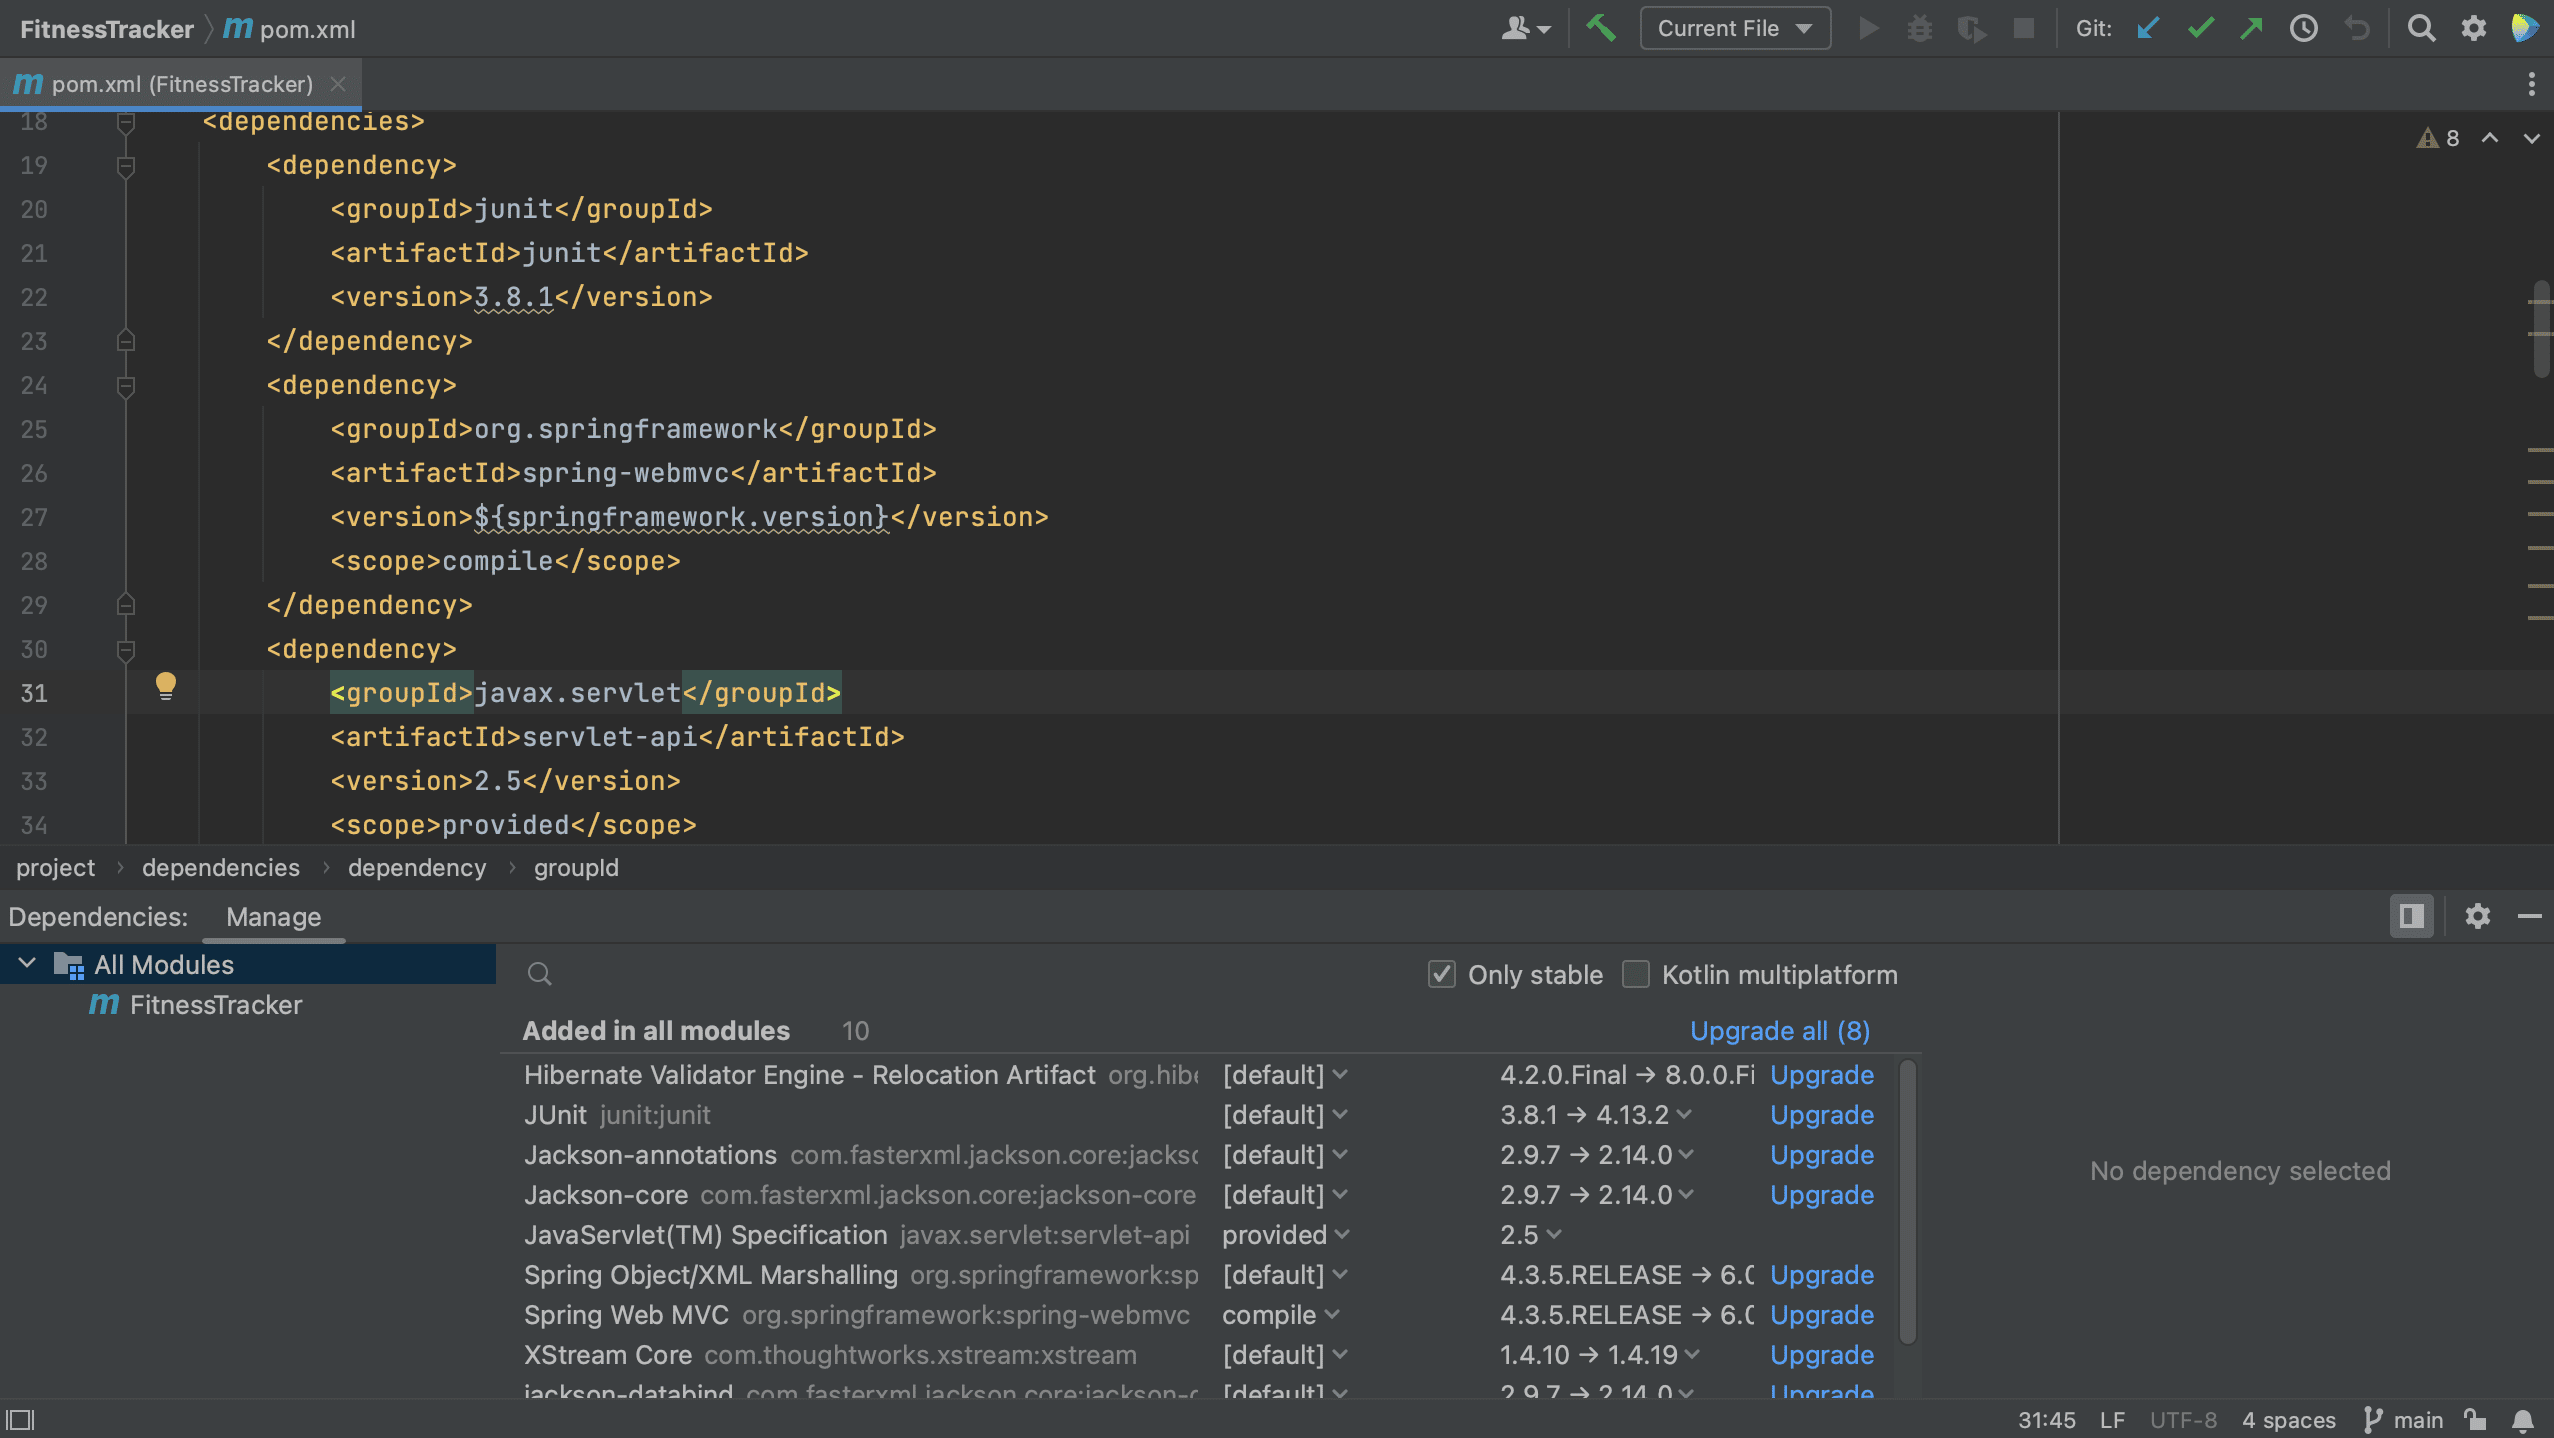
We can also upgrade our dependencies using the Dependencies tool window. The Dependencies tool window will tell us if there’s a newer version of a dependency, as we can see here.
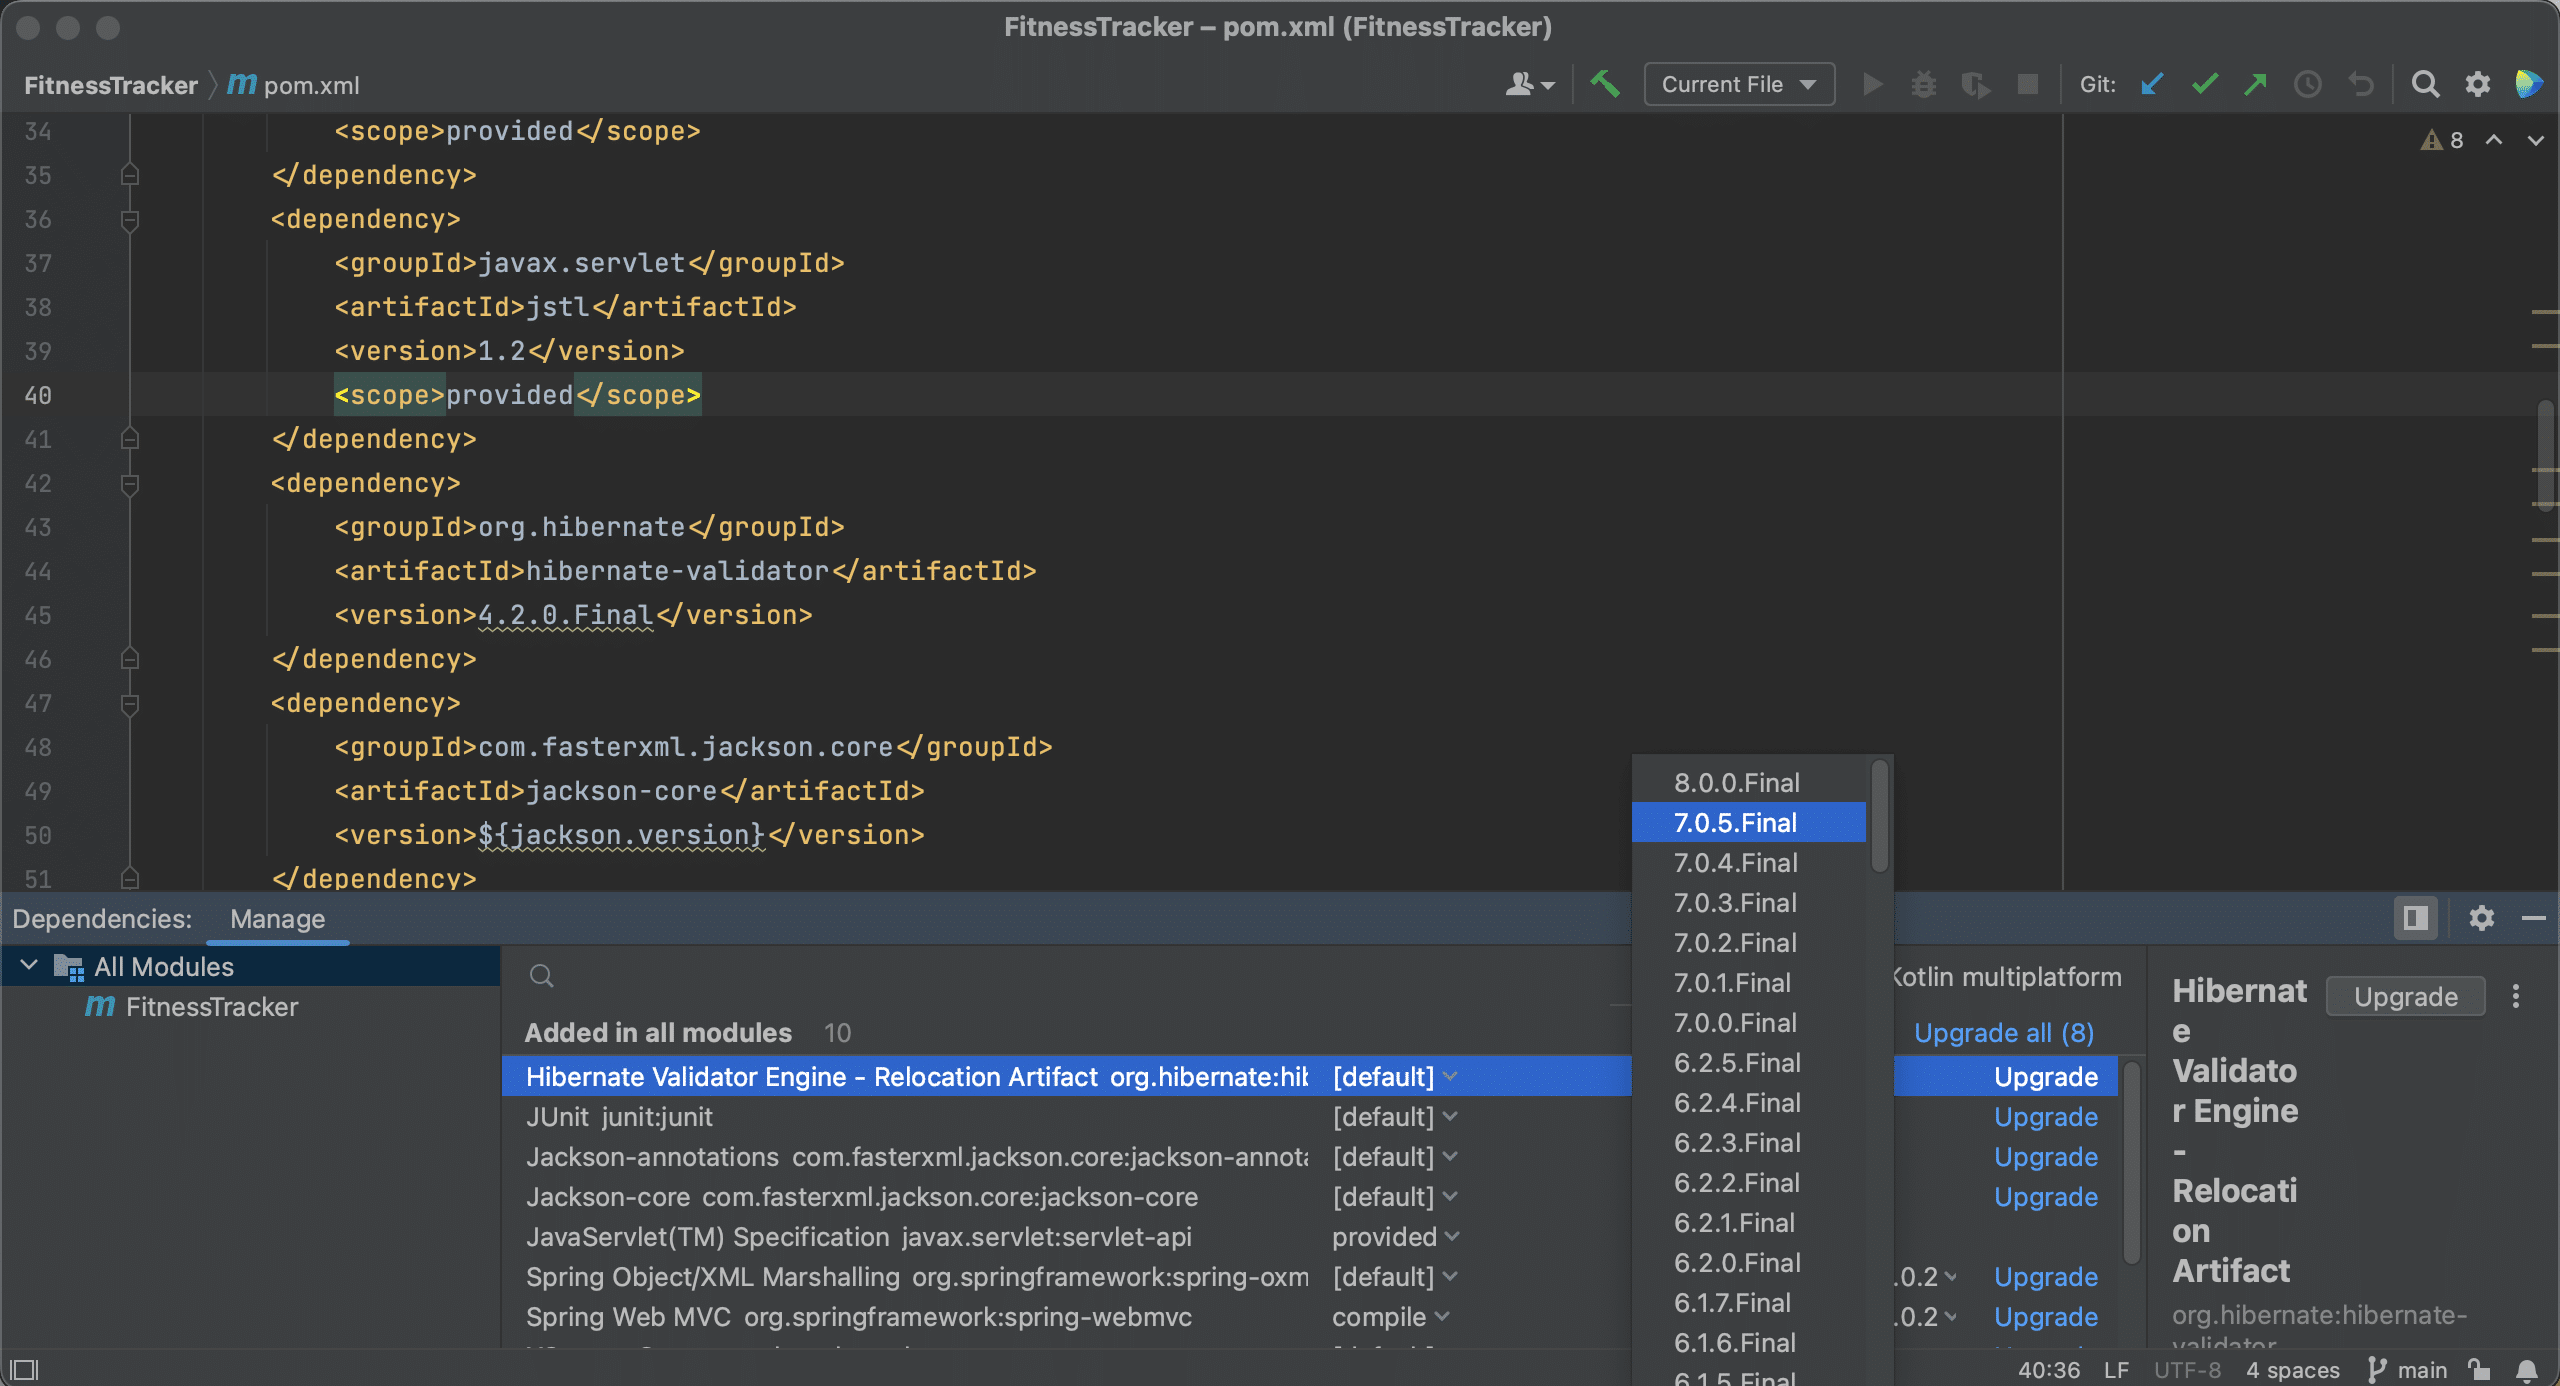
We can choose the version to upgrade to by clicking on the version number in the list. Note that we don’t have to use the latest version.
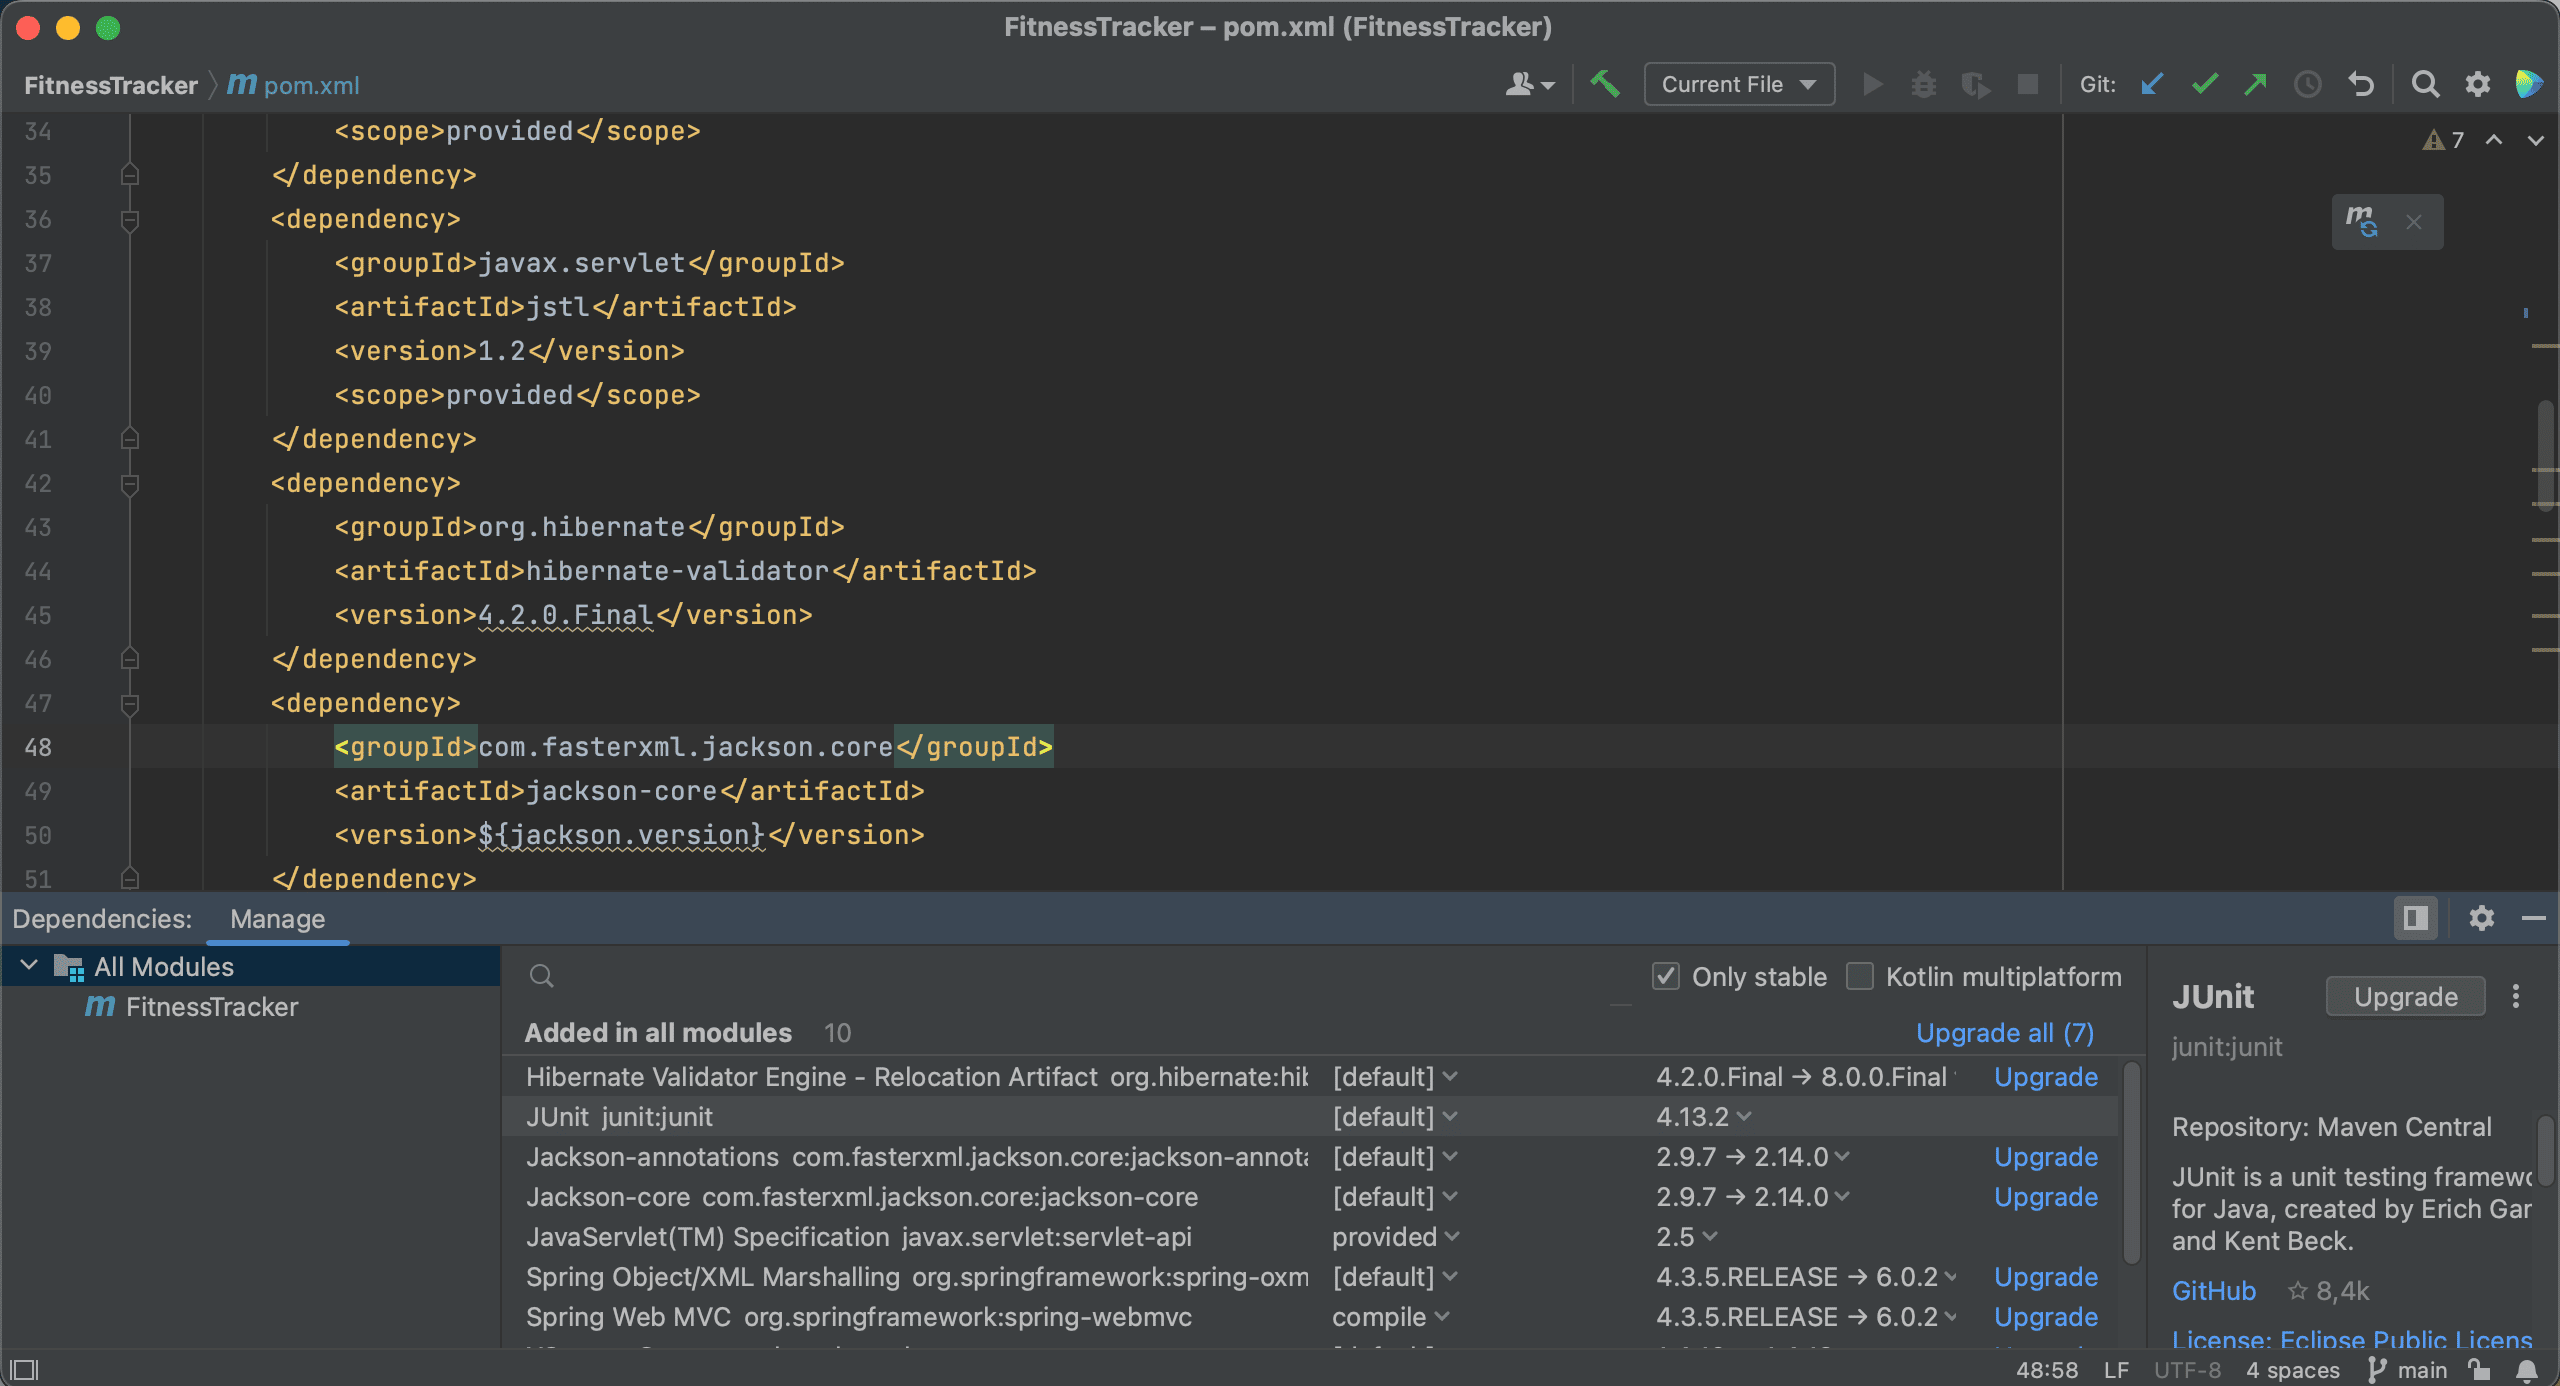
We can also automatically upgrade a dependency to the latest version by clicking Upgrade for that particular dependency.
Or, we can even upgrade all our dependencies at once, by clicking the Upgrade all link.
Remove dependencies
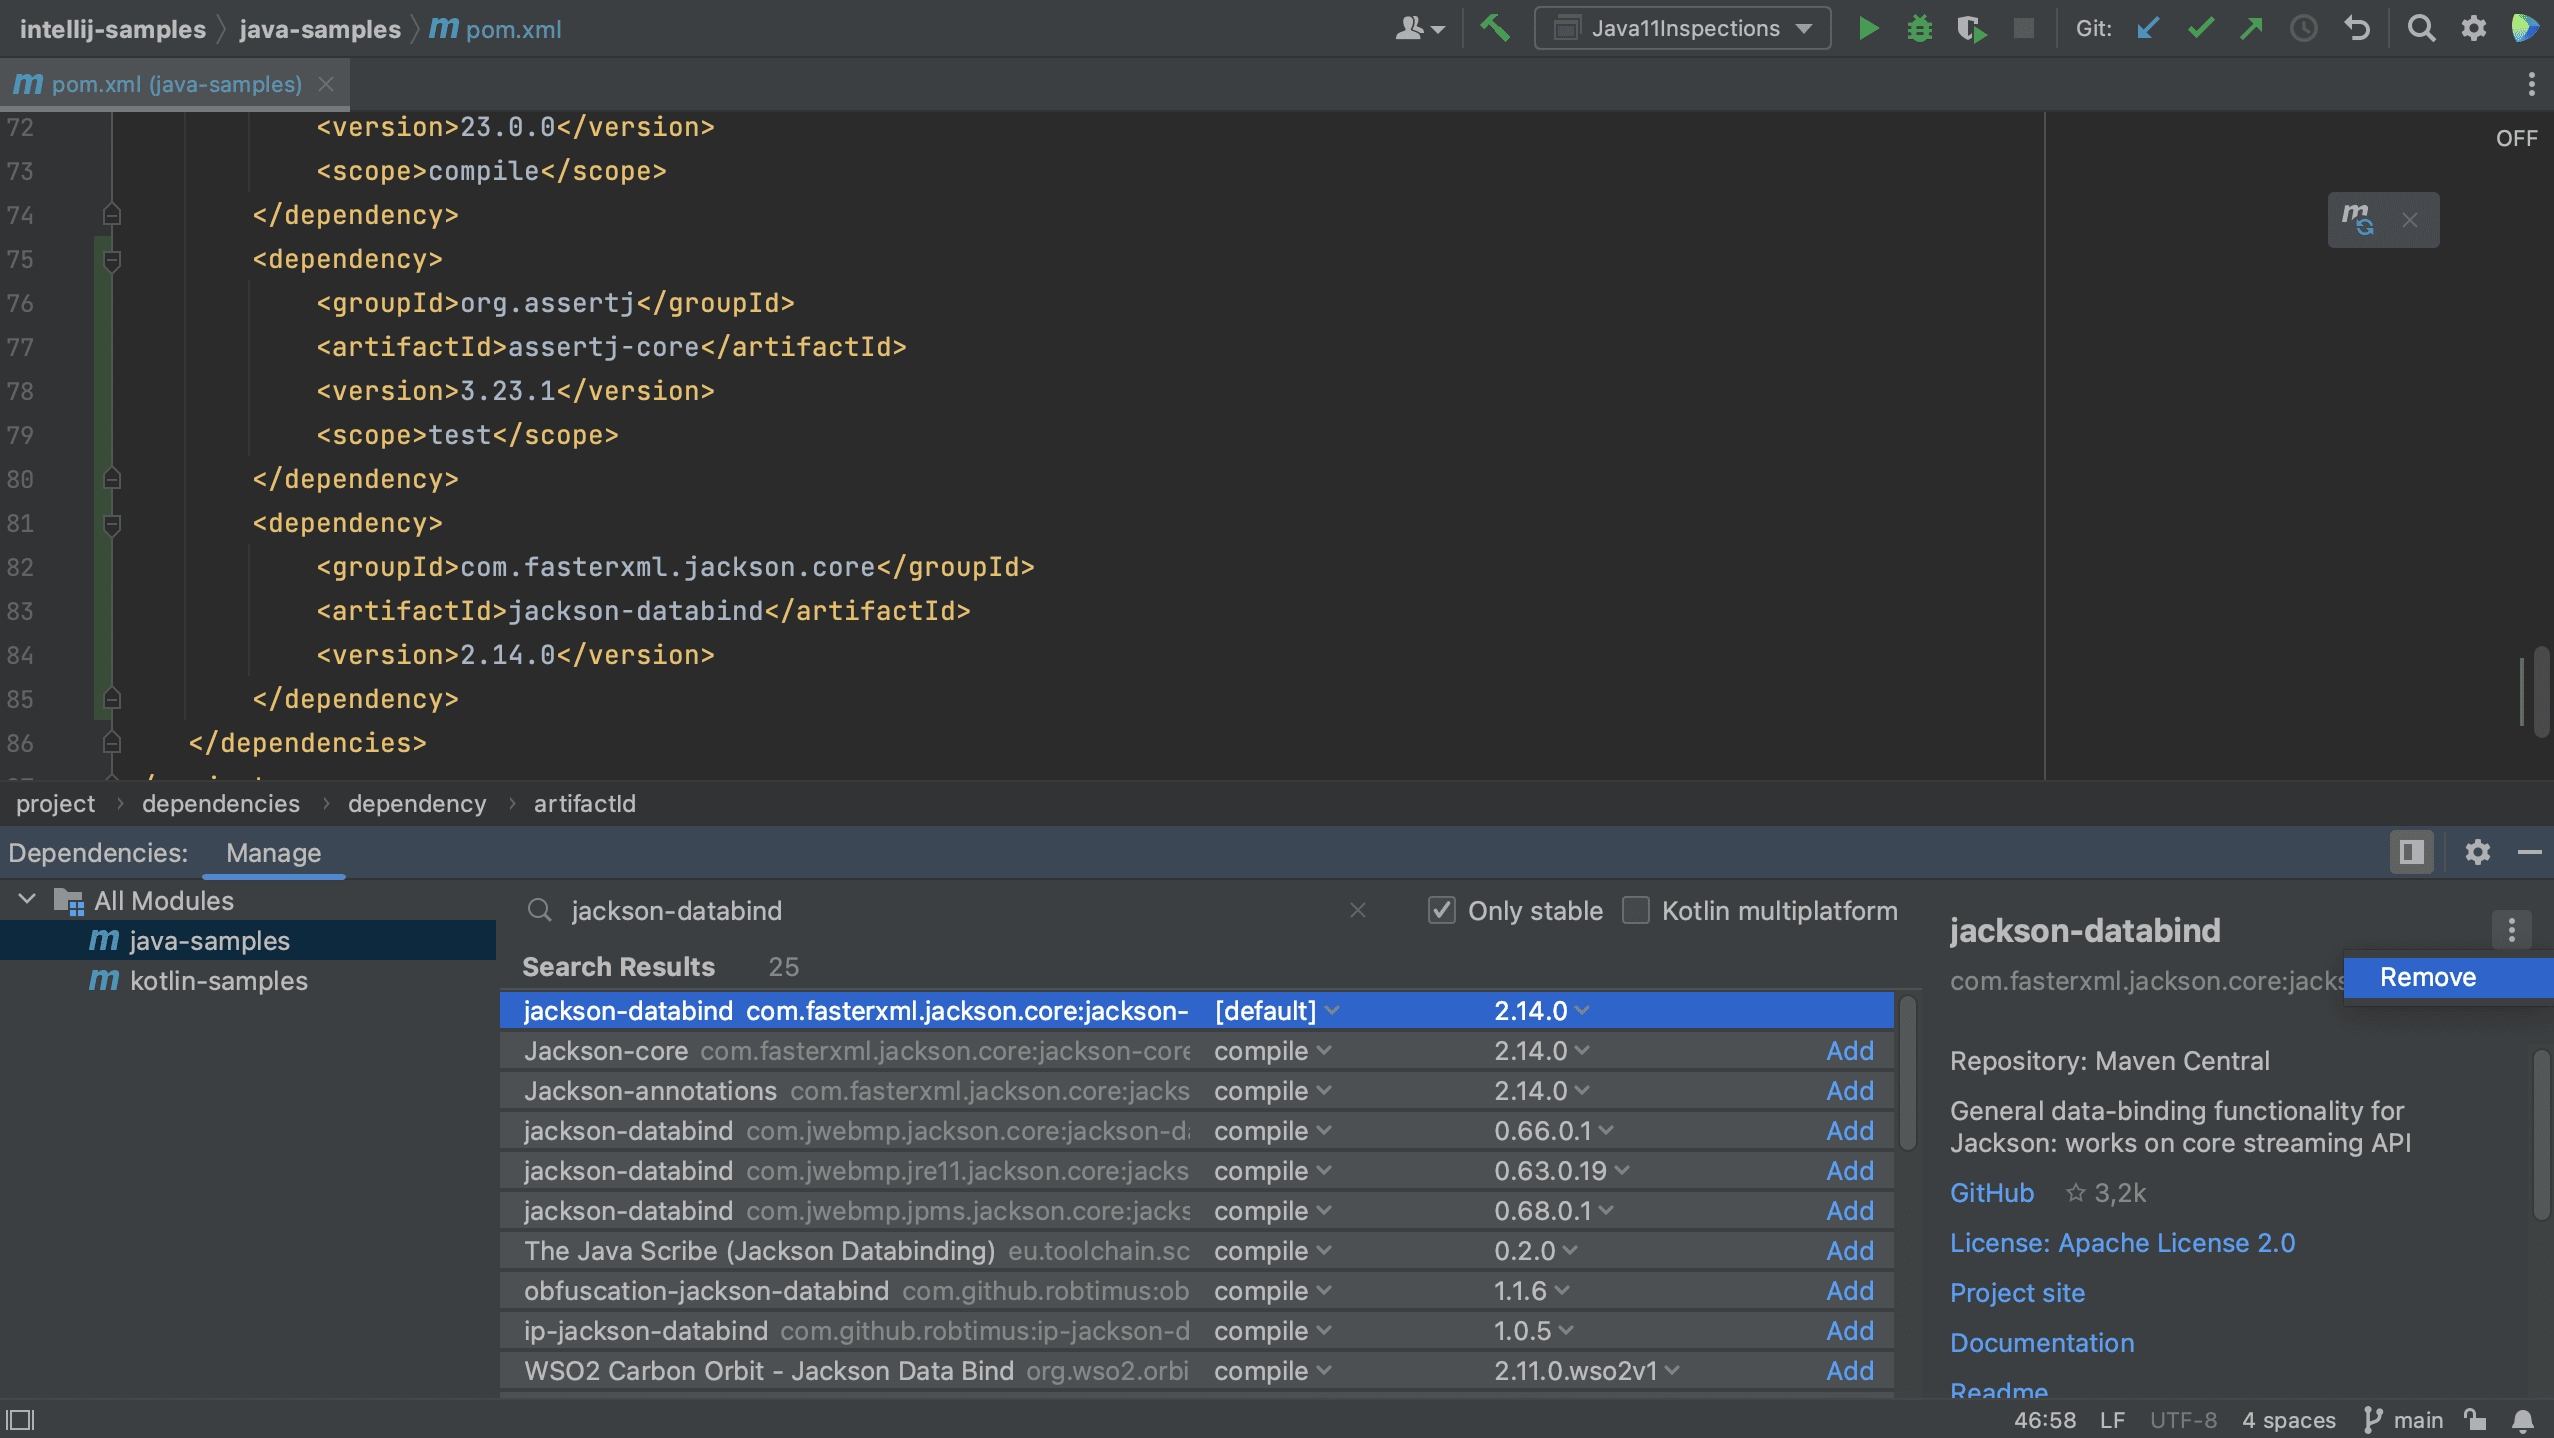
Finally, we can remove dependencies we no longer need. In the Dependencies tool window, let’s remove jackson-databind from the Java module. We select the dependency we want to remove (jackson-databind) and in the Dependency details pane on the right, click the More button (three dots) and select Remove.
We will see that the dependency is removed from the pom.xml and the dependency list. To remove a dependency from the whole project, select All Modules on the left.
Summary and Shortcuts
Now we know the different ways in which we can view our project’s dependencies in IntelliJ IDEA, and the different focus for each view.
IntelliJ IDEA Shortcuts Used
Here are the IntelliJ IDEA shortcuts that we used.
Used to determine whether a user is included in an A / B or Multivariate test.
18 months
_ga
ID used to identify users
2 years
_gali
Used by Google Analytics to determine which links on a page are being clicked
30 seconds
_ga_
ID used to identify users
2 years
_gid
ID used to identify users for 24 hours after last activity
24 hours
_gat
Used to monitor number of Google Analytics server requests when using Google Tag Manager
1 minute
_gac_
Contains information related to marketing campaigns of the user. These are shared with Google AdWords / Google Ads when the Google Ads and Google Analytics accounts are linked together.
90 days
__utma
ID used to identify users and sessions
2 years after last activity
__utmt
Used to monitor number of Google Analytics server requests
10 minutes
__utmb
Used to distinguish new sessions and visits. This cookie is set when the GA.js javascript library is loaded and there is no existing __utmb cookie. The cookie is updated every time data is sent to the Google Analytics server.
30 minutes after last activity
__utmc
Used only with old Urchin versions of Google Analytics and not with GA.js. Was used to distinguish between new sessions and visits at the end of a session.
End of session (browser)
__utmz
Contains information about the traffic source or campaign that directed user to the website. The cookie is set when the GA.js javascript is loaded and updated when data is sent to the Google Anaytics server
6 months after last activity
__utmv
Contains custom information set by the web developer via the _setCustomVar method in Google Analytics. This cookie is updated every time new data is sent to the Google Analytics server.


