Blog

Explore project structure with IntelliJ IDEA’s Dependency Matrix

In this tutorial, we’ll look at exploring project structure with IntelliJ IDEA‘s Dependency Matrix.

When working with large, complex software projects, we need to understand the dependencies between components in your projects. IntelliJ IDEA has a feature called Dependency Structure Matrix (DSM), or Dependency Matrix, that can help us with this.

When you are new to a project, the Dependency Matrix can help you get an overview of the dependencies in the project. The Dependency Matrix can also help us get an idea of how hard it will be to split a project, based on the dependencies between components. Finally, it can help us find and untangle cyclic dependencies.

It offers a matrix of the components in our project to help you and highlights the usage flow between them. Let’s take a look!

Opening the Dependency Matrix

You can open the Dependency Matrix from the main menu by going to Code | Analyze Code | Dependency Matrix.

Alternatively, use Find Action (⌘⇧A on macOS, or Ctrl+Shift+A on Windows/Linux) and search for “matrix”.

To use this feature, the Dependency Matrix plugin needs to be enabled.

When opening the Dependency Matrix, specify the scope you want to analyze. You can select the Whole project or specify a Custom scope, and whether to include test sources or not.

After defining the scope, click Analyze.

If the project’s class files are out of date, the analysis may result in incomplete or incorrect data. To avoid this, IntelliJ IDEA will prompt you to compile the project before continuing the DSM analysis. Click Yes to build the project and make sure everything is up-to-date.

The DSM tool window will open in a popup, showing a matrix of your project’s components.

Interpreting the Dependency Matrix

Let’s take a look at how to interpret the Dependency Matrix.

The row headers represent the program structure. In this example, the matrix contains the same modules from the Project tool window as rows.

Notice that the modules are not sorted alphabetically, as they are in the Project tool window. The matrix moves the components that are used the most to the bottom. This means that the components located at the top of the matrix depend on the components below.

Since this is a matrix, the column headers are the same as the row headers. They are omitted to save space. The dashes on the diagonal correspond to self-dependencies, which are not shown.

As you can see in the legend at the top right of the DSM tool window:

  • dependencies are shown in blue
  • mutual or cyclic dependencies, meaning that two components depend on each other, are shown in red
  • dependencies flow from green to yellow.

Dependencies

Dependencies are shown in blue. The numbers in the cells show the number of dependencies of the selected row on the selected column. An ellipsis (the three dots) in a cell means that there are more than 99 dependencies. Hover over the cell to get more information. In the example below, we see the tooltip “cucumber-java -> cucumber-core (209)”. This means that in this project the component cucumber-java (represented in the column) depends on the component cucumber-core 209 times.

You can click rows or cells to examine the relationship between the components in more detail.

When you select a row to see the relationship between the selected component and others, the selected row and corresponding column are highlighted to visualize row dependencies.

The column shows the dependencies of the selected row.

The row shows the dependencies on the selected row.

Remember from the legend that dependencies flow from green to yellow.

In this example, the core module is selected. You can see that this module uses several other modules, marked in yellow. In turn, you see that this module is used by several modules marked in green.

You can select different rows to see which components they use or are used by. You’ll see that the components at the top mostly use the components at the bottom, while the components at the bottom are mostly used by components at the top and no longer using other components themselves.

You can drill down further into specific cells. When you click a cell, one component will be marked green and the other will be marked yellow. The green component uses the yellow component. The corresponding cell (marked purple) will show dependencies in the other direction, in this case 0.

We can drill down even further.

Expand components

Right now everything is collapsed and only the modules are shown. You can click a module to expand its packages. The module name is shown to the left, the packages are shown as rows and the dependencies between the packages are shown in the matrix inside the box marked with a black line.

You can expand the packages further to show the classes in that package, and see the dependencies between classes inside the packages. You can expand modules and packages by clicking the arrows in the rows on the left, and collapse them again.

You can also expand the modules and packages by double-clicking a cell. We can collapse everything again by using the Flatten Packages button on the top left.

Limit scope

You can limit the scope of your Dependency Matrix. Right-click the row you want to look at in more detail, and from the context menu, select Limit Scope To Selection.

The limited scope will be opened in a new tab in the DSM tool window.

You can limit the view to see only selected dependencies. In the DSM tool window, right-click the cell representing the dependency you’re interested in and select Explore Dependencies Between.

The classes that produce these dependencies will be opened in a new tab in the DSM tool window. In contrast to the Limit Scope option, only classes which produce selected dependencies are left.

Another way to open the Dependency Matrix, with the option to select a specific scope, is from the Project tool window (⌘1 on macOS, or Alt+1 on Windows/Linux). Right-click an item in the Project tool window and select Analyze | Analyze Dependency Matrix.

Notice how you can now select the module or directory as scope for the Dependency Matrix, in addition to the whole project or a custom scope.

Navigate to relevant code

We can also navigate to the relevant code from the Dependency Matrix. To select a specific dependency for further source-code analysis, right-click the dependency you are interested in in the DSM tool window, and select Find Usages for Dependencies.

The Find tool window will open, showing the usages of the selected dependency. Close the DSM tool window to look at the results and explore the code you’re interested in. We can open the relevant code by double-clicking it in the Find tool window (⌘3 on macOS, or Alt+3 on Windows/Linux).

You can reopen the window again from the main menu by going to View | Tool Windows | DSM.

And remember that all windows can be opened from Recent Files (⌘E on macOS, or Ctrl+E on Windows/Linux) as well.

Cyclic dependencies

Remember from the legend that mutual or cyclic dependencies are shown in red. This means that two components depend on each other.

In a large application with multiple cyclic dependencies, you don’t need to expand all the nodes one by one to find all the cyclic dependencies. You can press F2 or select Go to Next Cycle from the context menu to quickly jump to the next cycle.

Summary

In this tutorial you’ve seen how the Dependency Matrix can help visualize and explore dependencies between components in
your project.

IntelliJ IDEA Shortcuts Used

Here are the IntelliJ IDEA shortcuts that we used.

NamemacOS ShortcutWindows / Linux Shortcut
Find Action⌘⇧ACtrl+Shift+A
Project Tool Window⌘1Alt+1
Find Tool Window⌘3Alt+3
Recent Files⌘ECtrl+E
Go to Next CycleF2F2

Related Links

Unexpected Things That Make You a Senior Developer

Co-authored with Frank Delporte

It’s a Friday, late in the afternoon. To end your work week in a clean way, you decide to get rid of some test data and files from your PC. You hit the enter button to drop a table from your local test database. Within a split second, you realize your error. Your body turns hot and cold at the same time. You double-check, but you already know the truth. You were connected to the production database and just deleted the table with all the customers…

Congratulations! You will never forget this day. It’s the day you become a real developer, and all senior developers will welcome you into their world, as they all have made a similar mistake at least once.

Database Disasters

Dropping a table or a complete database is a mistake that can happen very quickly. Another one is forgetting the WHERE part of your SQL statement. There is a big difference between DELETE FROM clients and DELETE FROM clients WHERE id = 1

But the main mistake happens when you have multiple connections defined in your database UI and assume you are modifying the test database while having the production database open. And that’s a problem that actually should not be possible to happen, or at least not easily. Do developers need access to the production database? While it can be helpful to be able to check data directly in the live system, read-only rights are probably sufficient for most cases…

Another database disaster waiting to happen is when you forget to validate the input. SQL injection should be a well-known problem by now, but still, a lot of errors happen in this field, causing not only disasters but also security nightmares. Or, as XKCD nicely illustrates it:

Dates and Times

Working with dates and times is the real test that distinguishes beginners from experienced developers. The defining factor is not only their ability to handle them correctly but also the number of “yes, I have seen this problem before” moments.

Before we dive into the problems, let’s summarize the most important guideline when working with dates and times in your database: store them completely, including the timezone. This is an article that goes into more details about timestamptz in PostgreSQL.

Here are some interesting situations related to dates, times, and time zones.

Young developers will probably not remember what the Y2K problem was all about, but let’s just mention here that storing a year’s value as only two numbers is a bad idea. No, the year 2000 (“00”) was not before the year 1999 (“99”). And we may be facing a similar problem in the year 2038, as I wrote in an earlier blog: “Schedule your holiday for 2038“.
While writing that article, I never imagined seeing an error being caused by that Y2K38 problem already in 2023!

Frank

Of course, if your company only operates in one time zone, you might think that you will escape the problem of having to deal with time zones. And this might be true… Until you move to the cloud. Now you’ll have to deal with time zones too!
And there are many reasons why dates and time zones are fertile ground for great conference talks and famous blog posts.

Marit

Computer System Breakdowns

But be aware, we can not only make mistakes in our code and database! Our whole computer infrastructure is prone to errors!

Many years ago, I was working on my first big multimedia project for a light fixtures manufacturer to bring their expensive thick catalogs to CD-ROM (for young people, a blinking disk that could contain a whopping 640 MB of data…). We had a strict deadline and had a first working version after three weeks of hard work. But then disaster struck! The hard disk of my fancy blue iMac broke.

After many hours of investigation, I ended up with four conclusions:

  • The backup tapes on our server that ran daily to ensure we would never lose any work contained not a single file!
  • It would take weeks and a lot of money to send the hard disk to a data recovery company without any guarantee to be able to recover anything.
  • Backups must be checked regularly and you must try from time to time if you can recover a deleted file to make sure both the backup and restore process work OK.
  • I had to start my work again from scratch…

Another lesson I learned from that disaster: weeks of work on a project that you have never done before can be repeated in a few days as you learned a lot during those weeks, and now know how to do things. And in the end, it even gets a cleaner and better result!

Another system disaster: never, never, NEVER, type the command rm -rf /. The remove command parameter f removes all prompts, so you let it go ahead without asking for any confirmations. The r lets the remove command work recursively, meaning it will go through all nested directories. Combine this with /, being the very root of your hard disk, and you are heading towards a total nightmare…

Frank

Testing Mistakes

In the same category of testing versus production databases: mailing lists! The number of stories of test emails reaching thousands of clients is incredibly long.It’s still amazing how many times one still receives an email with all recipients in the TO field. Any programmed emailing system should generate a single mail per person. And if you really, really need to send to multiple persons with one message, the BCC field is your only friend!Another well-known example is sending test messages in production, like the time Airbnb sent test notifications to users around the world or an intern at HBO Max sent an integration test email to subscribers.

I can remember a story, in the early days of the internet, when networks were not that fast, and servers were smaller. Most companies had their own internal email server. But when someone mailed a big PDF report or other file to everyone at the company, the complete system could crash. Suddenly too much storage was needed, and a ping-pong of email error replies, led to a total breakdown of the server.

Frank

Similarly, I remember several situations where we’ve had to (re)upload batches of data and somehow miscalculated the size and processing time, leading to queues being full and data processing to be severely delayed.

Marit

Conclusions

While some of the mistakes mentioned here are honest mistakes made by developers, some of the bad events described here actually reveal a problem within the organization. Do developers need unrestricted access to the production database? Why are they able to access the entire production mailing list for a test? Some data (especially personal data) should be behind heavily closed doors with minimal access. But in many companies, all this data is widely accessible to the whole developer team (or worse). If this is not guarded by the organization, developers should always be professional and handle data with care.

In addition, tooling should be used in such a way as to make mistakes like these harder. For example, environments should be clearly marked so it’s easy to see whether you are working on a test environment or the production environment. In some cases, additional steps have to be taken in order to get access to a production environment. Evaluate potential risks in your organization and act accordingly.

But as much as you try to avoid them, mistakes do happen. In the end, it’s essential to keep in mind that people will mostly remember how you reacted to a disaster. After the initial adrenaline spike has settled down, grab a cup of coffee, cancel your plans for the following days, and fix the problem. Everything will be OK soon. Afterward, you will wear the badge of “Senior Developer” with pride…

IntelliJ IDEA: Explore project structure with the Dependency Matrix

When working with large, complex software projects, we need to understand the dependencies between components in your projects.

IntelliJ IDEA’s Dependency Structure Matrix (DSM), or Dependency Matrix, that can help us with this! Let’s take a look at how to use the Dependency Structure Matrix to see dependencies between different components, like modules, packages, and classes. See how to identify dependencies, find cyclic or mutual dependencies, and visualize the flow of dependencies to see which components use or depend on other components and vice versa.

Working with GitLab Merge Requests in IntelliJ IDEA

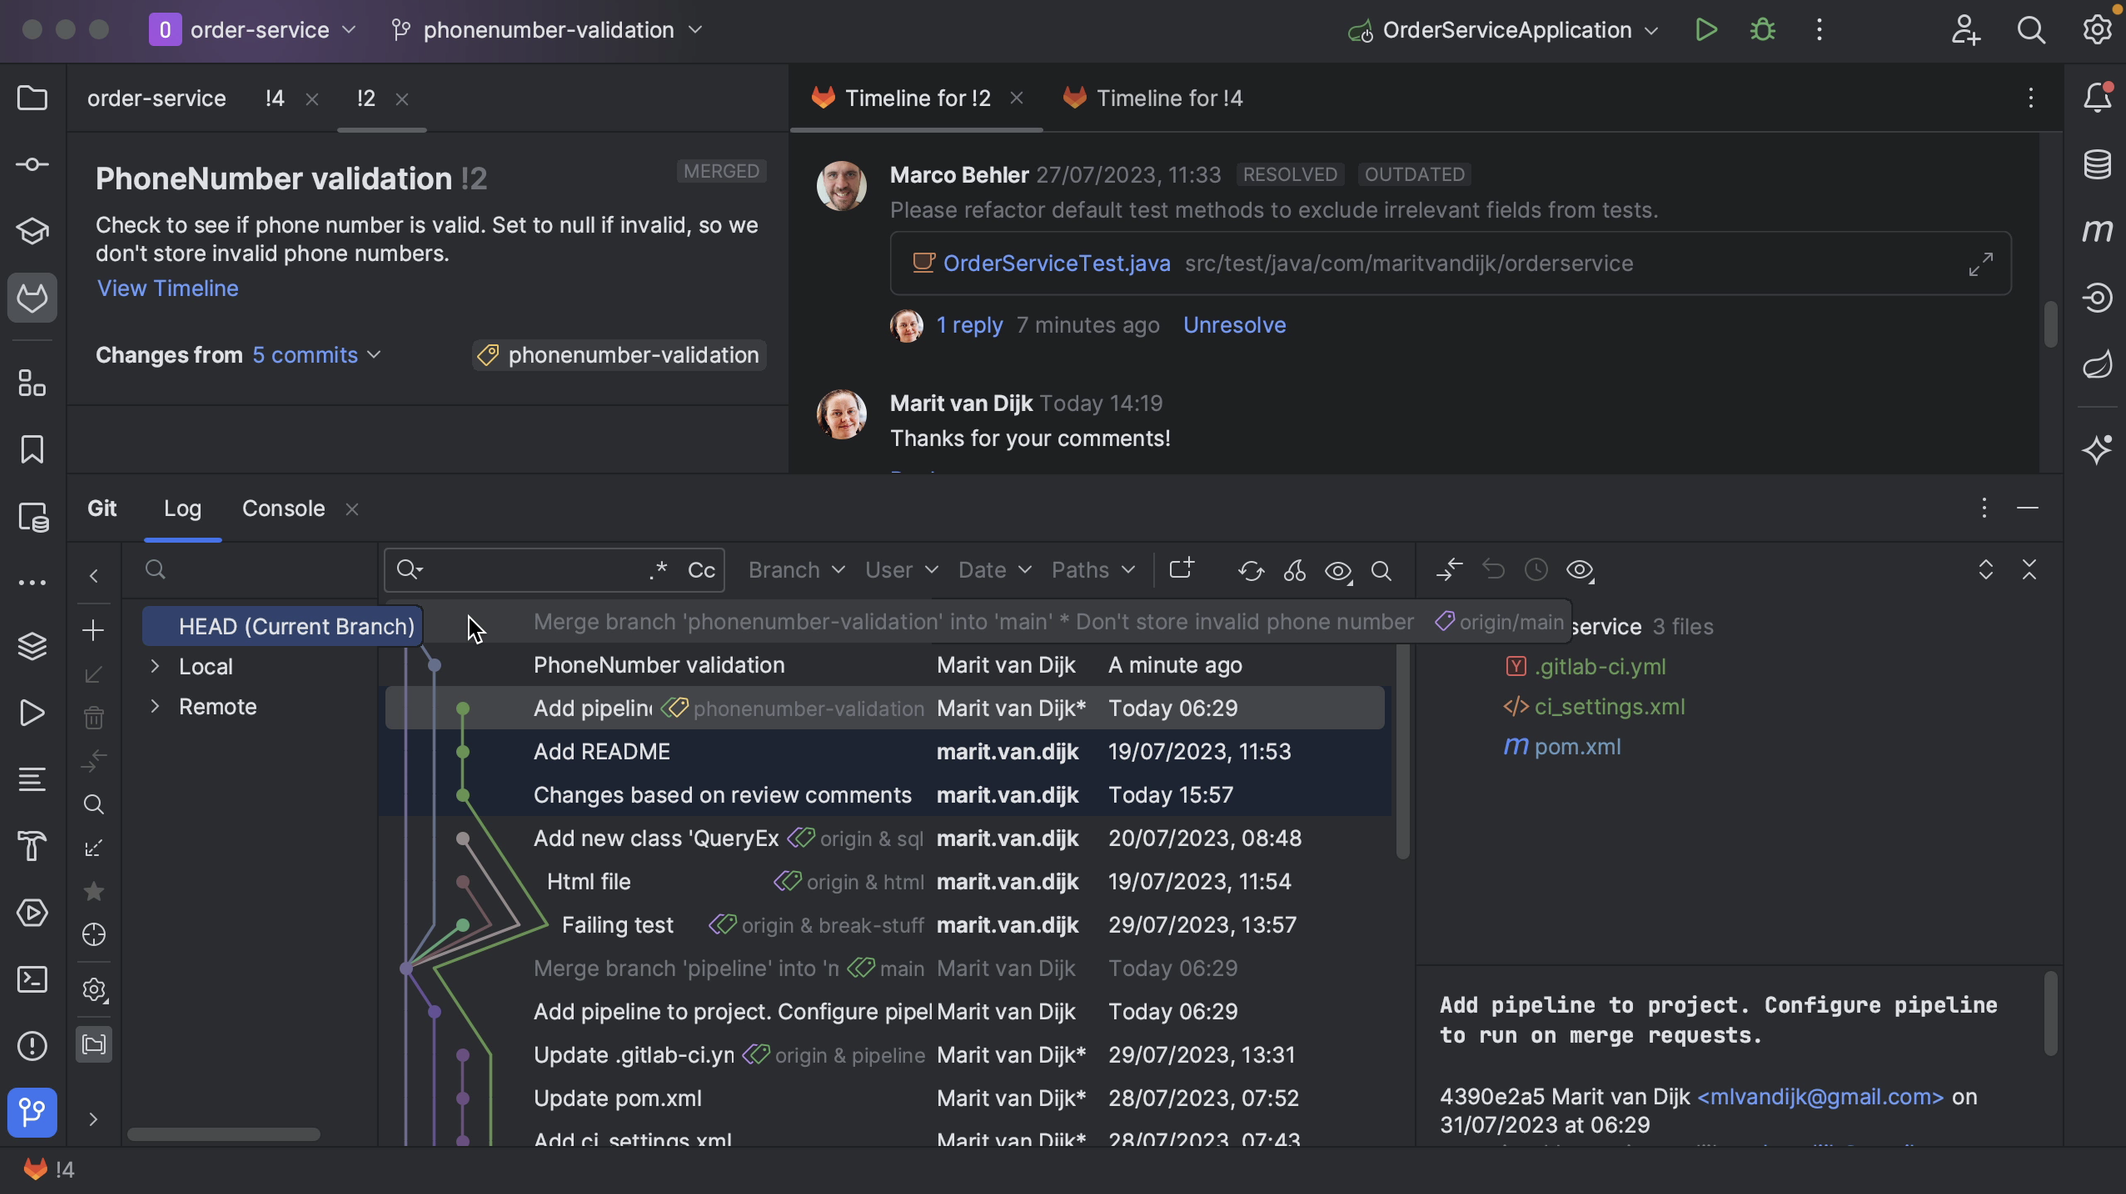
In this tutorial, we will take a look at working with GitLab Merge Requests inside IntelliJ IDEA.

When reviewing Merge Requests in a web interface, we don’t have the same support that our IDE gives us, like syntax highlighting and the context within which the code was written.

IntelliJ IDEA has support for reviewing and merging GitLab Merge Requests. These features are available if the IntelliJ IDEA project has a remote that points to GitLab.
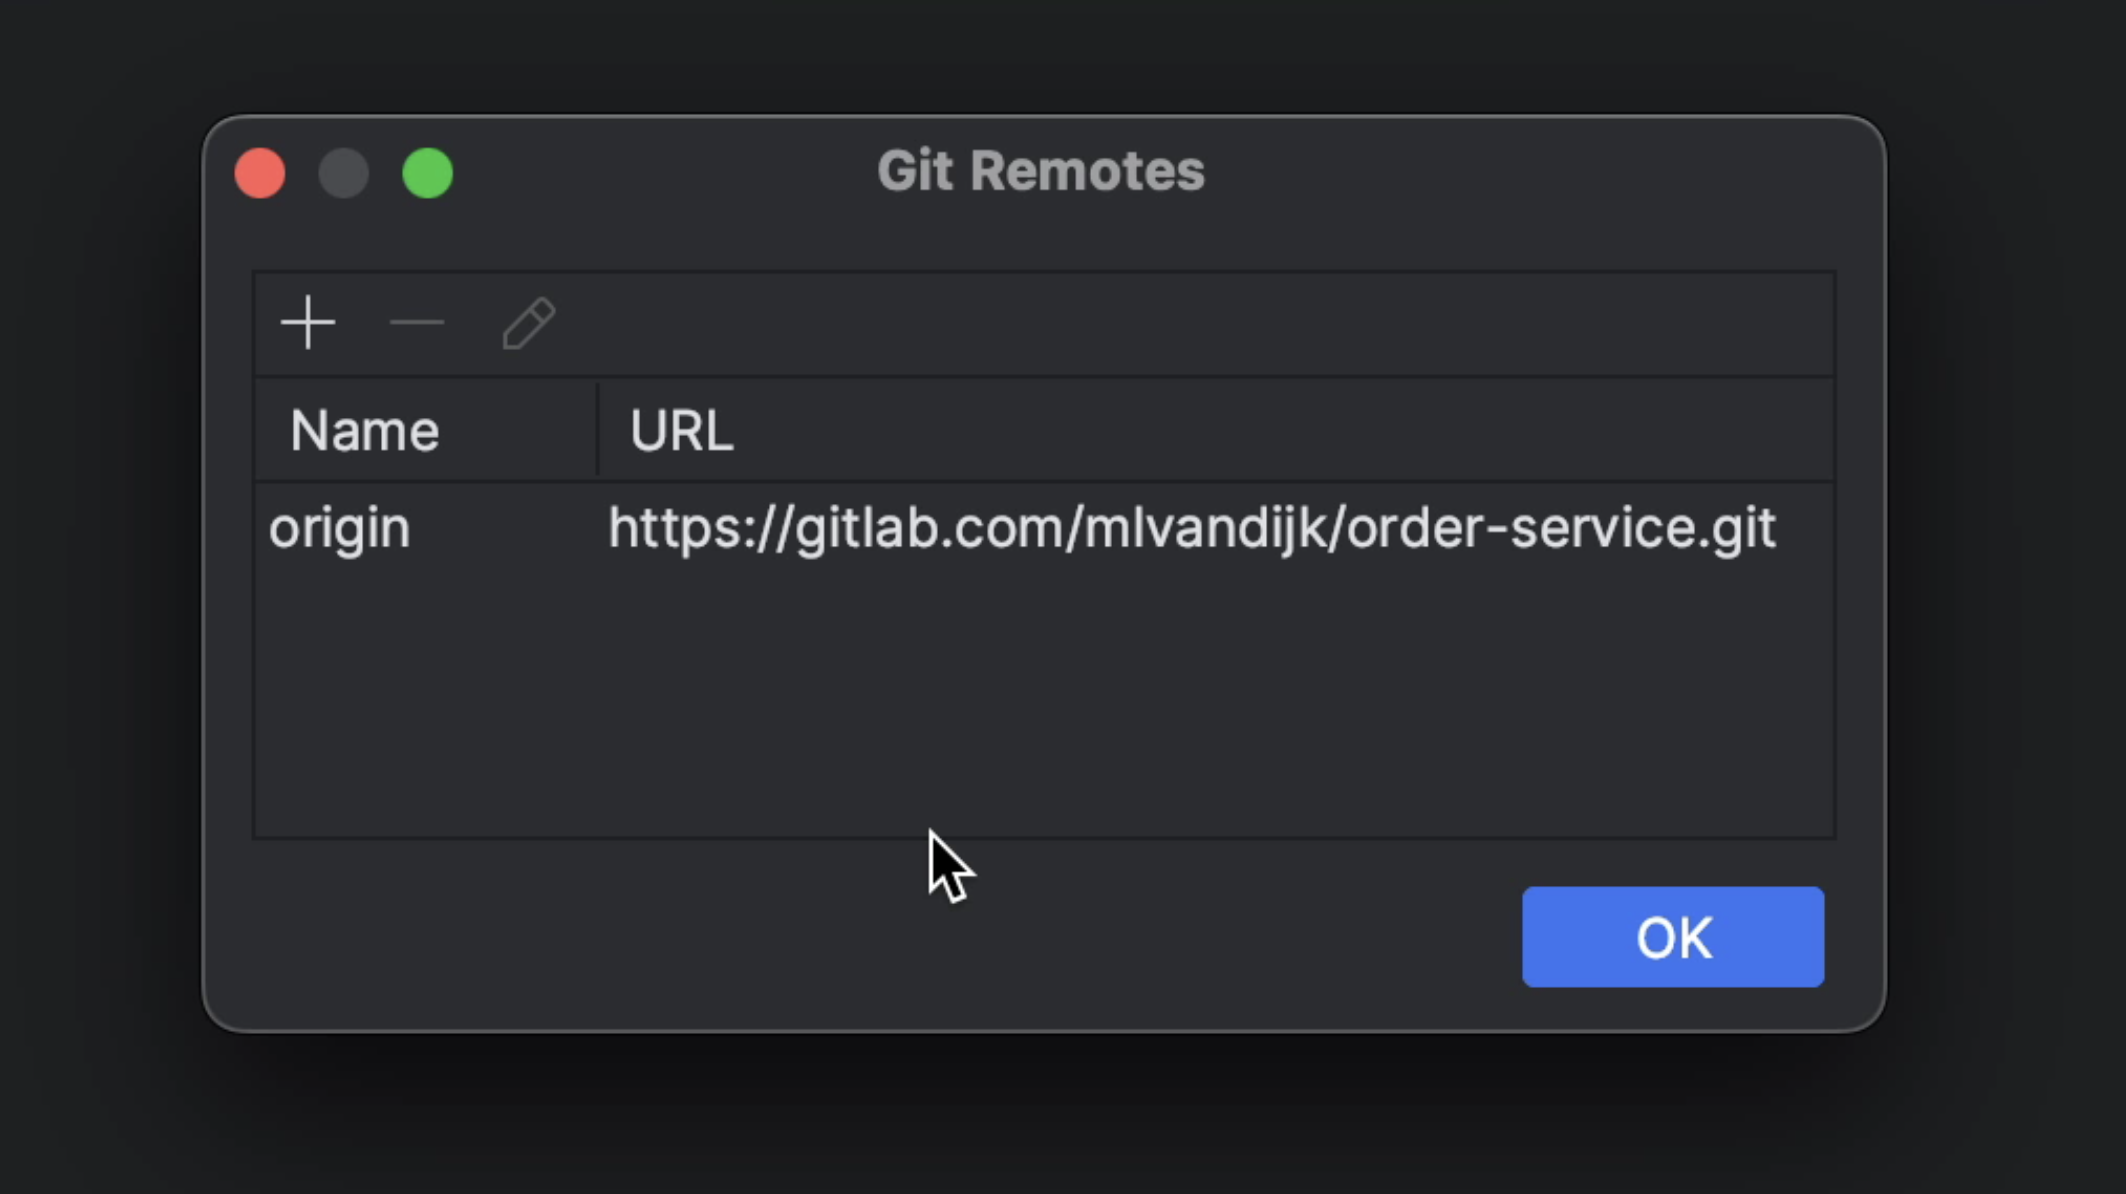
Remote

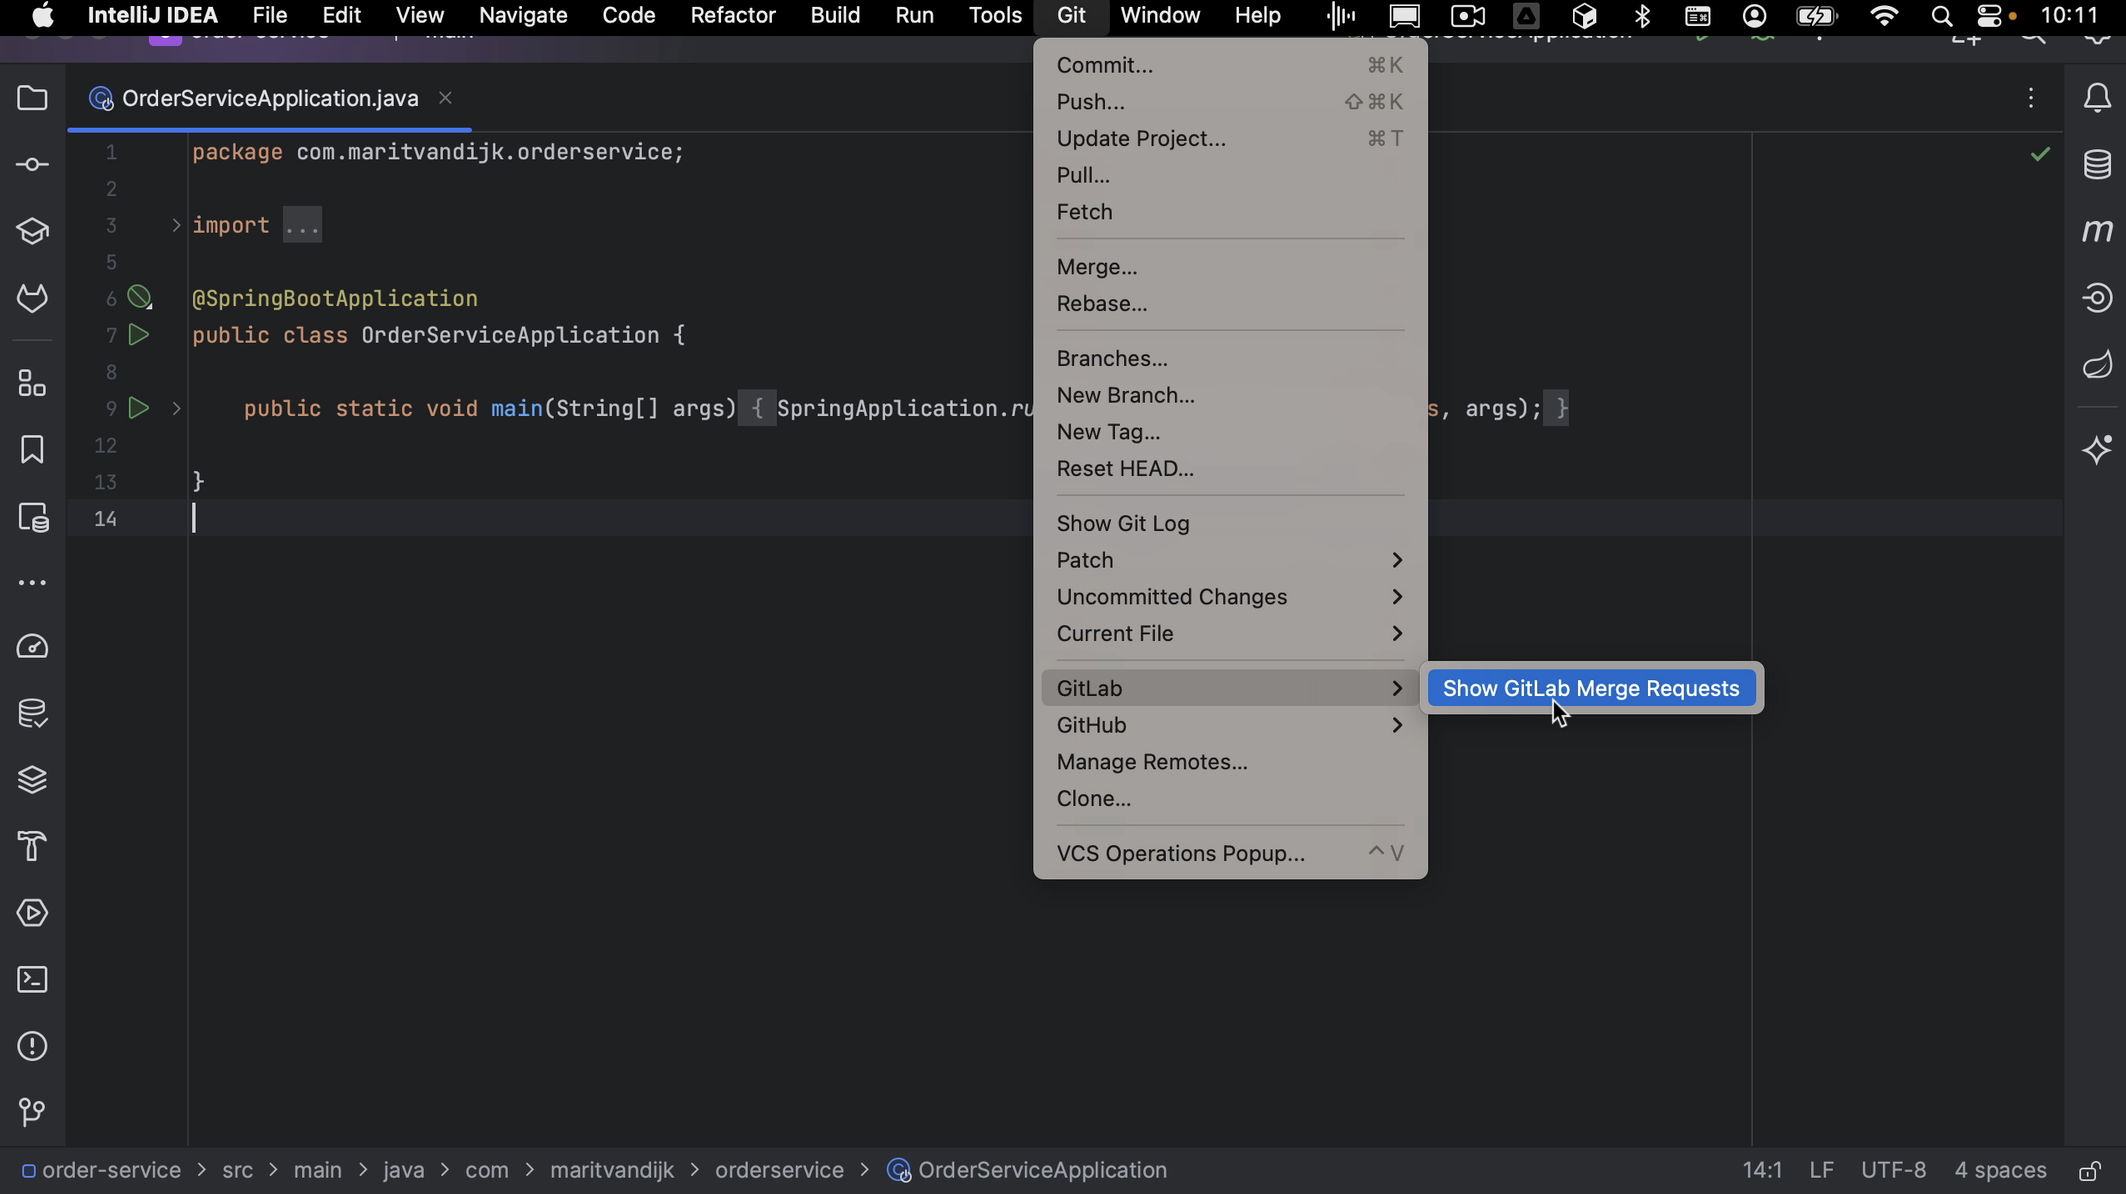
We can open the GitLab Merge Requests using the GitLab logo on the left, or from the menu by going to Git > Gitlab > Show Gitlab Merge Request.
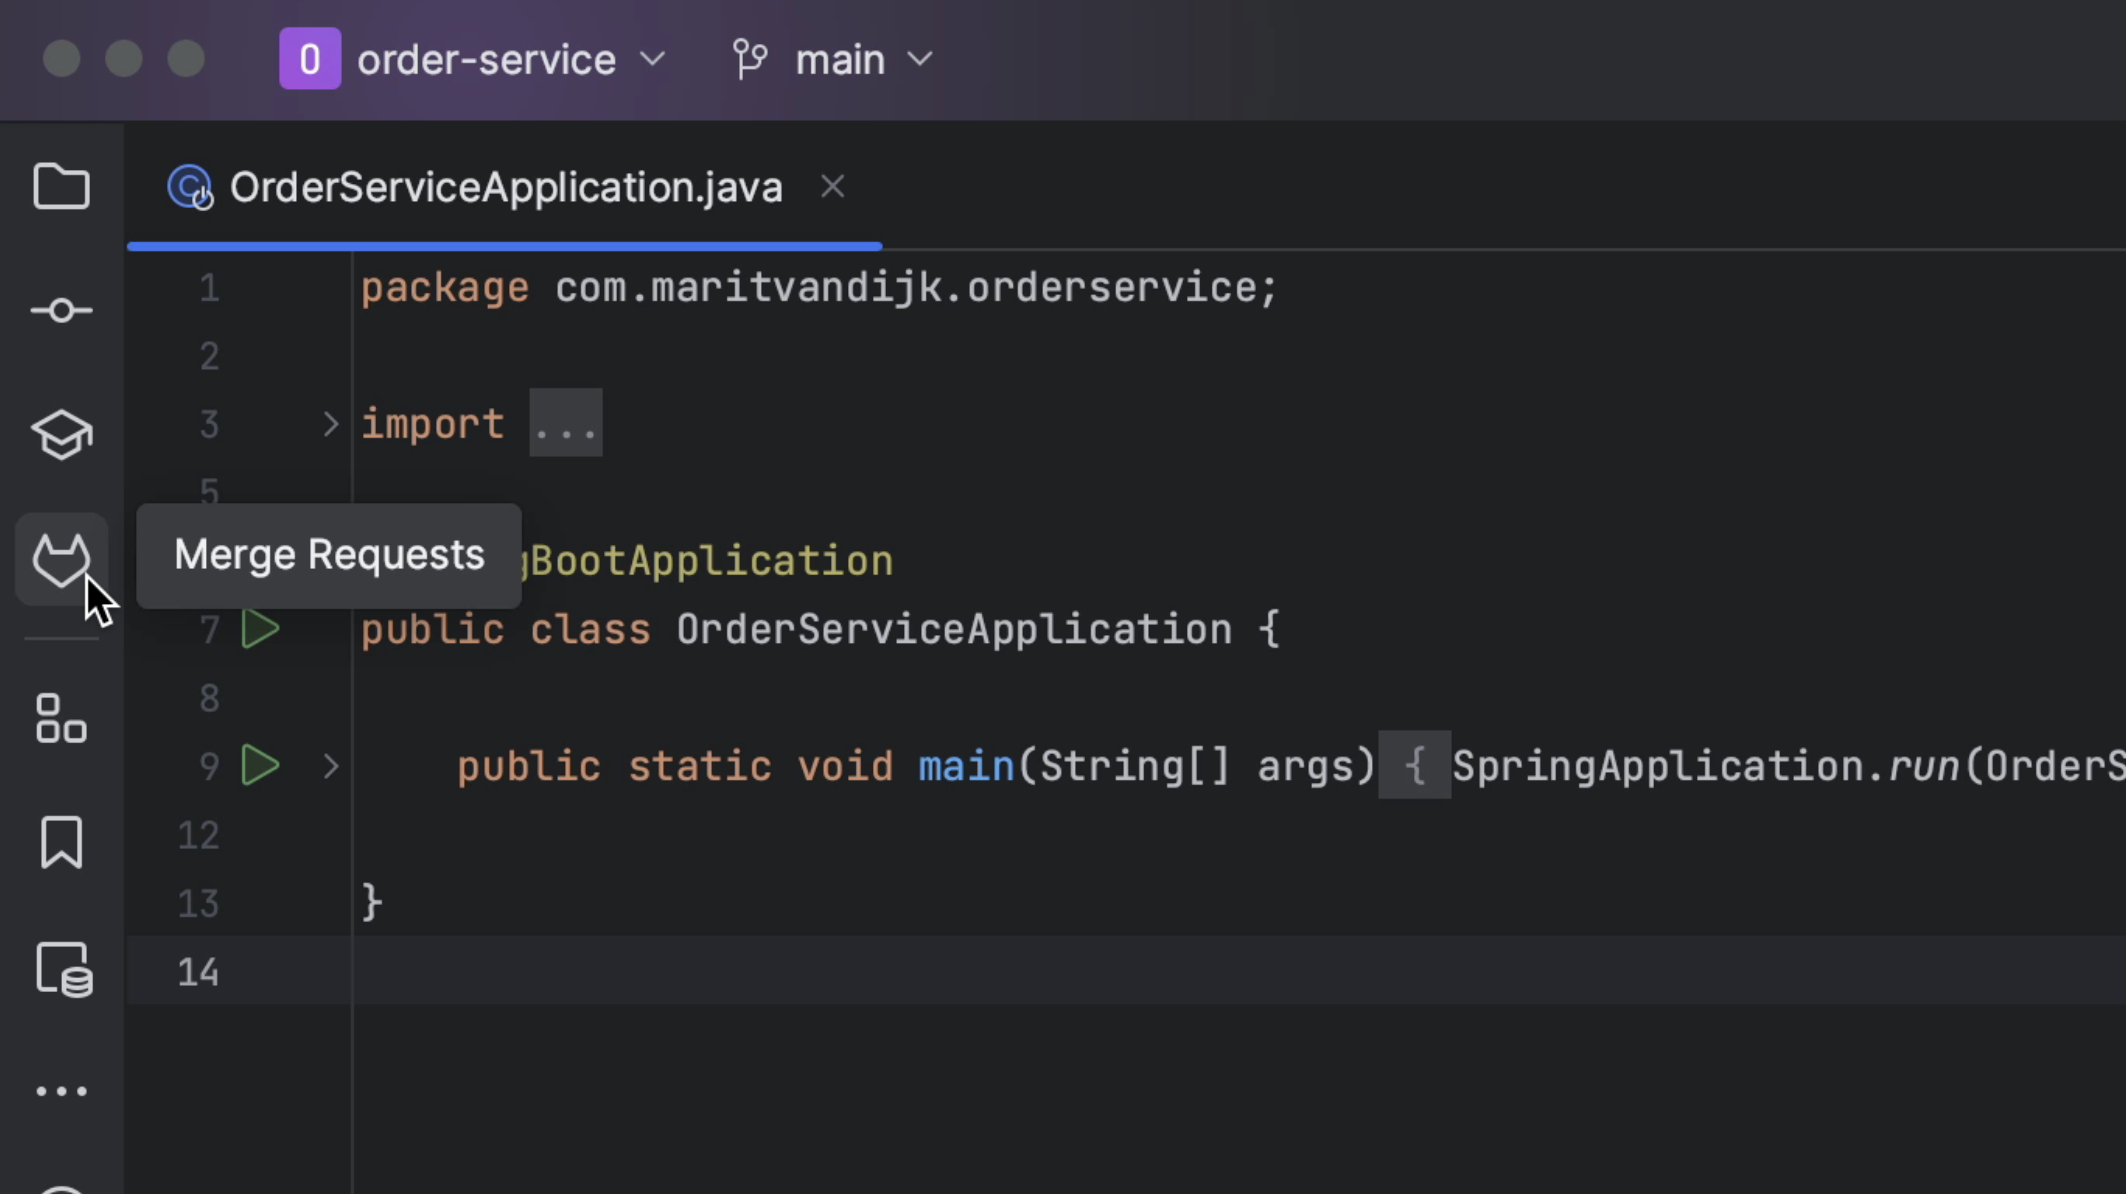
Open Merge Requests from logo
Open Show GitLab Merge Requests from menu

Logging in to GitLab from IntelliJ IDEA

If we aren’t already logged in to GitLab via IntelliJ IDEA, the GitLab Merge Requests tool window will prompt us to Log In.
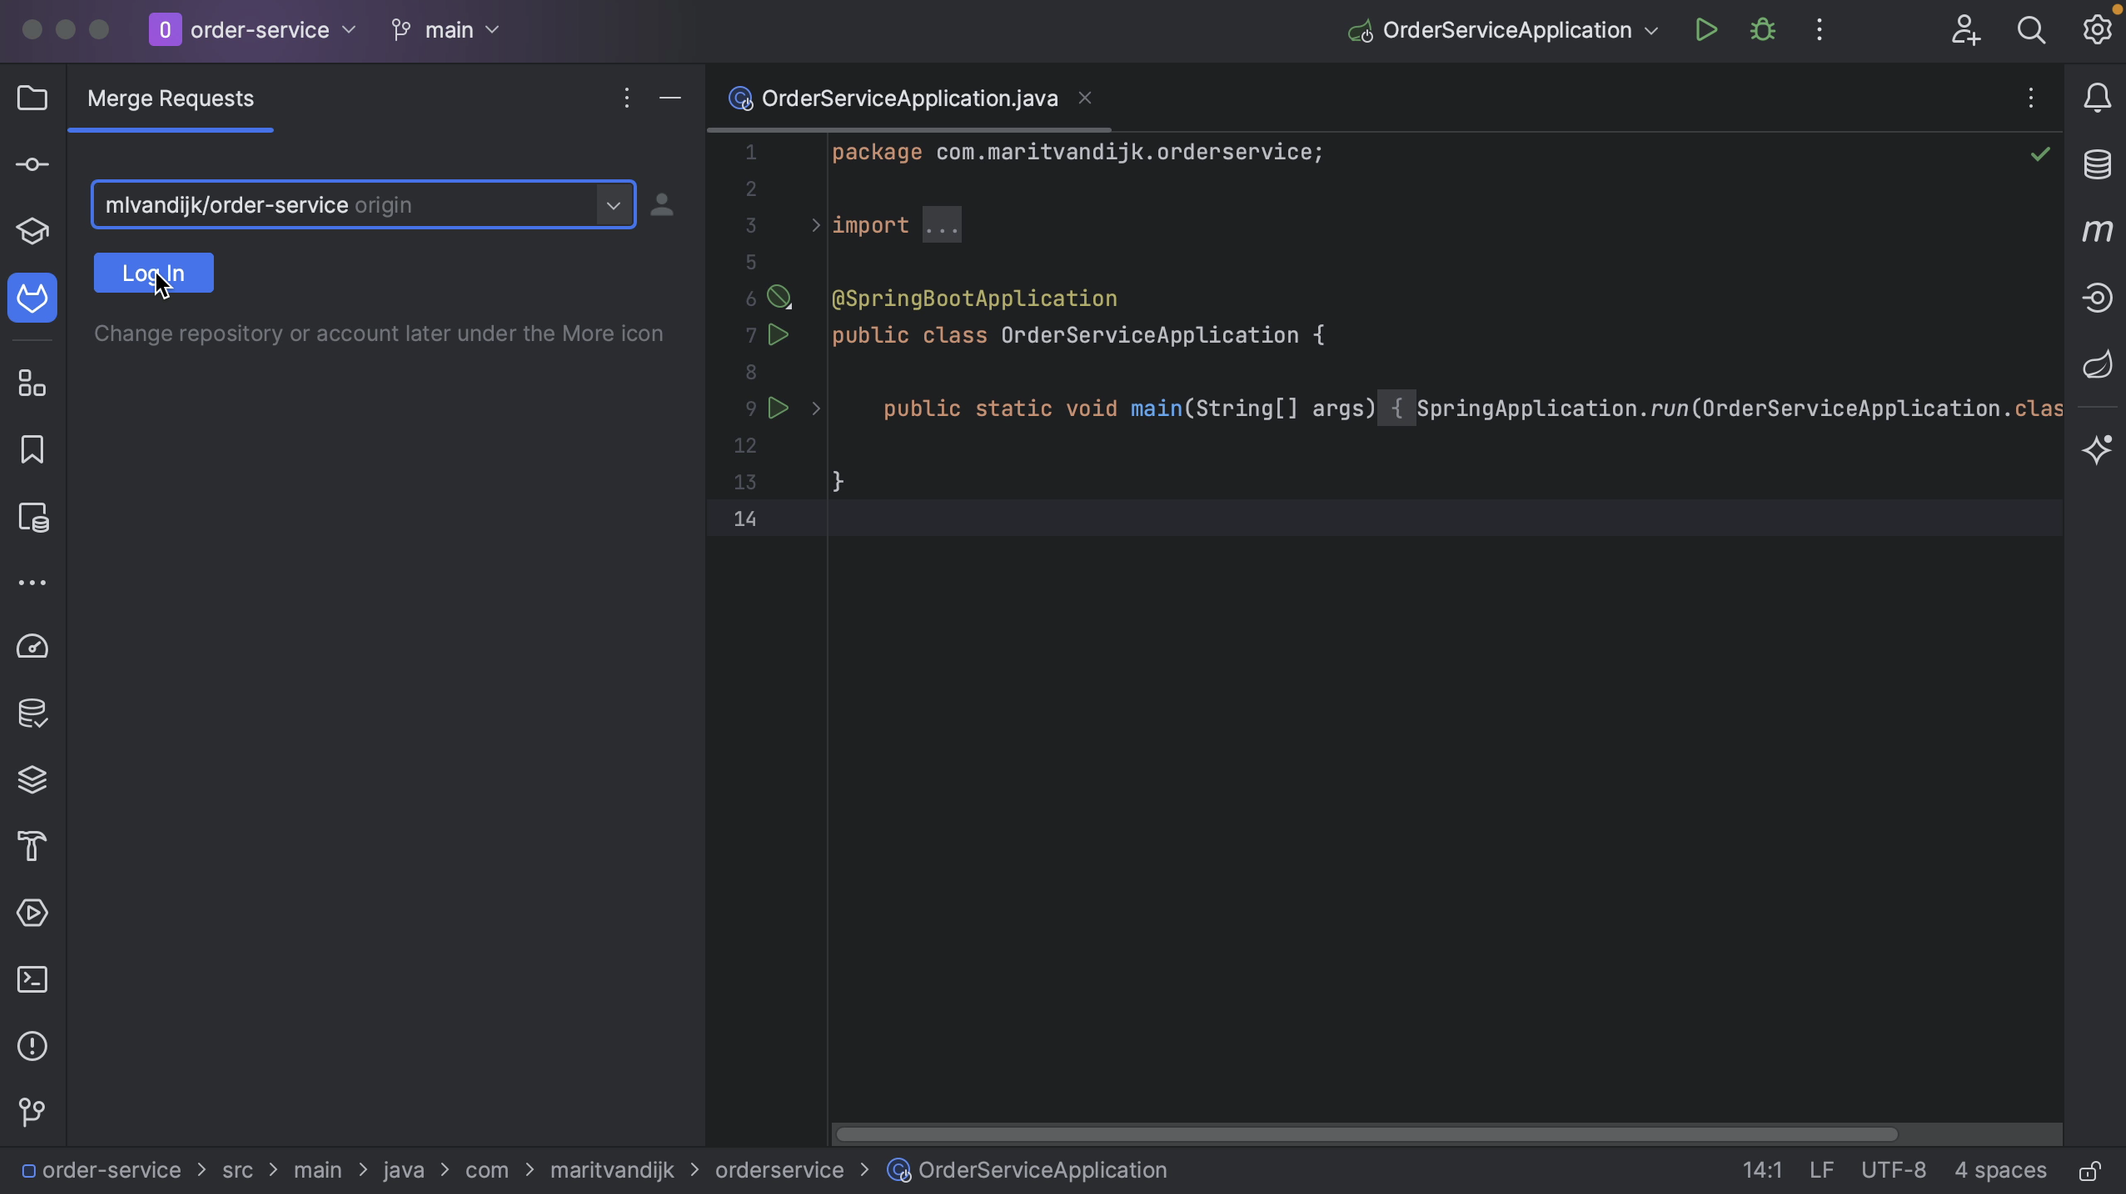
Log In

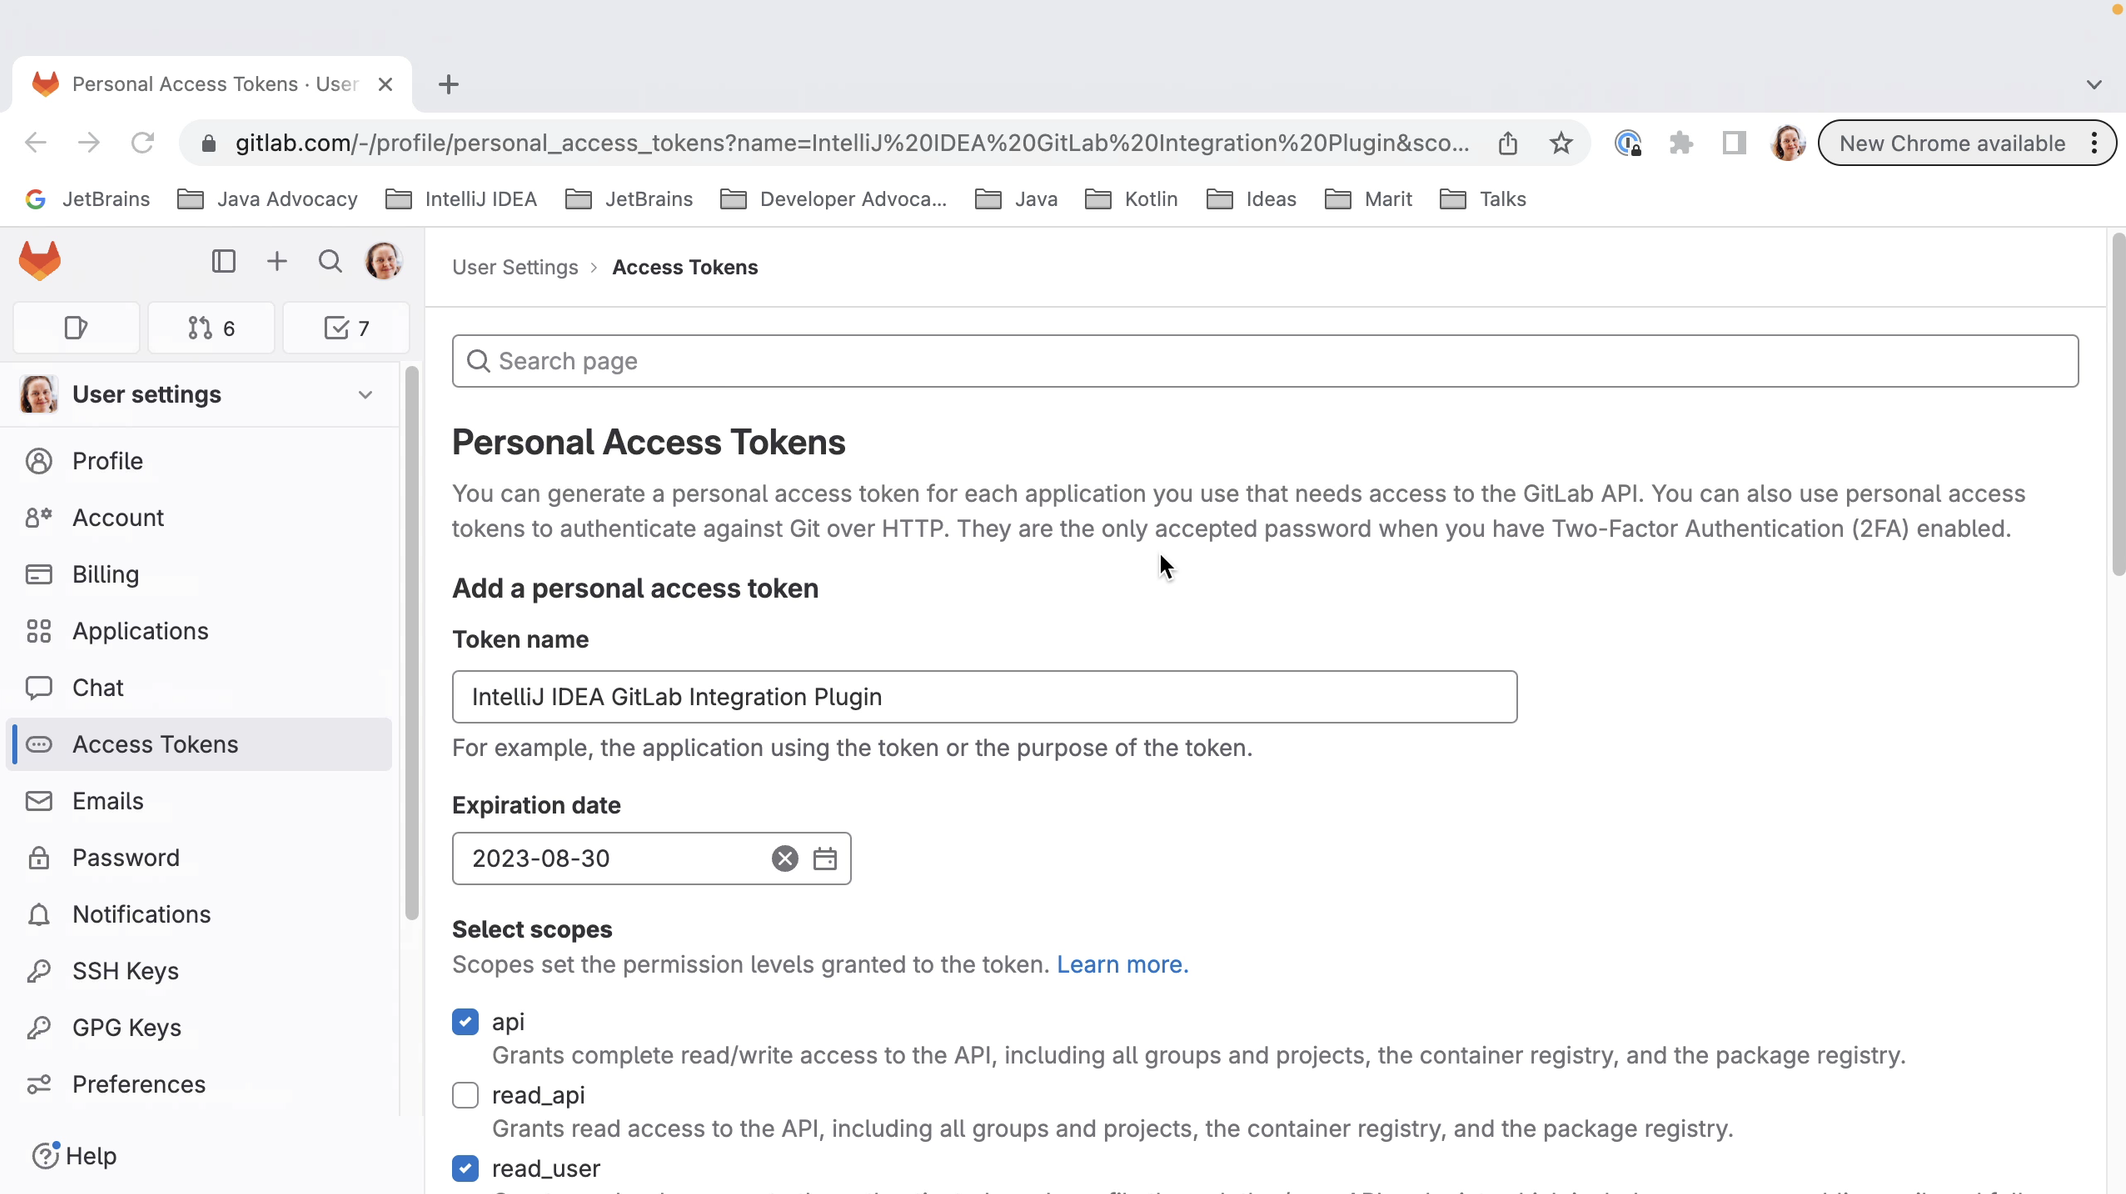
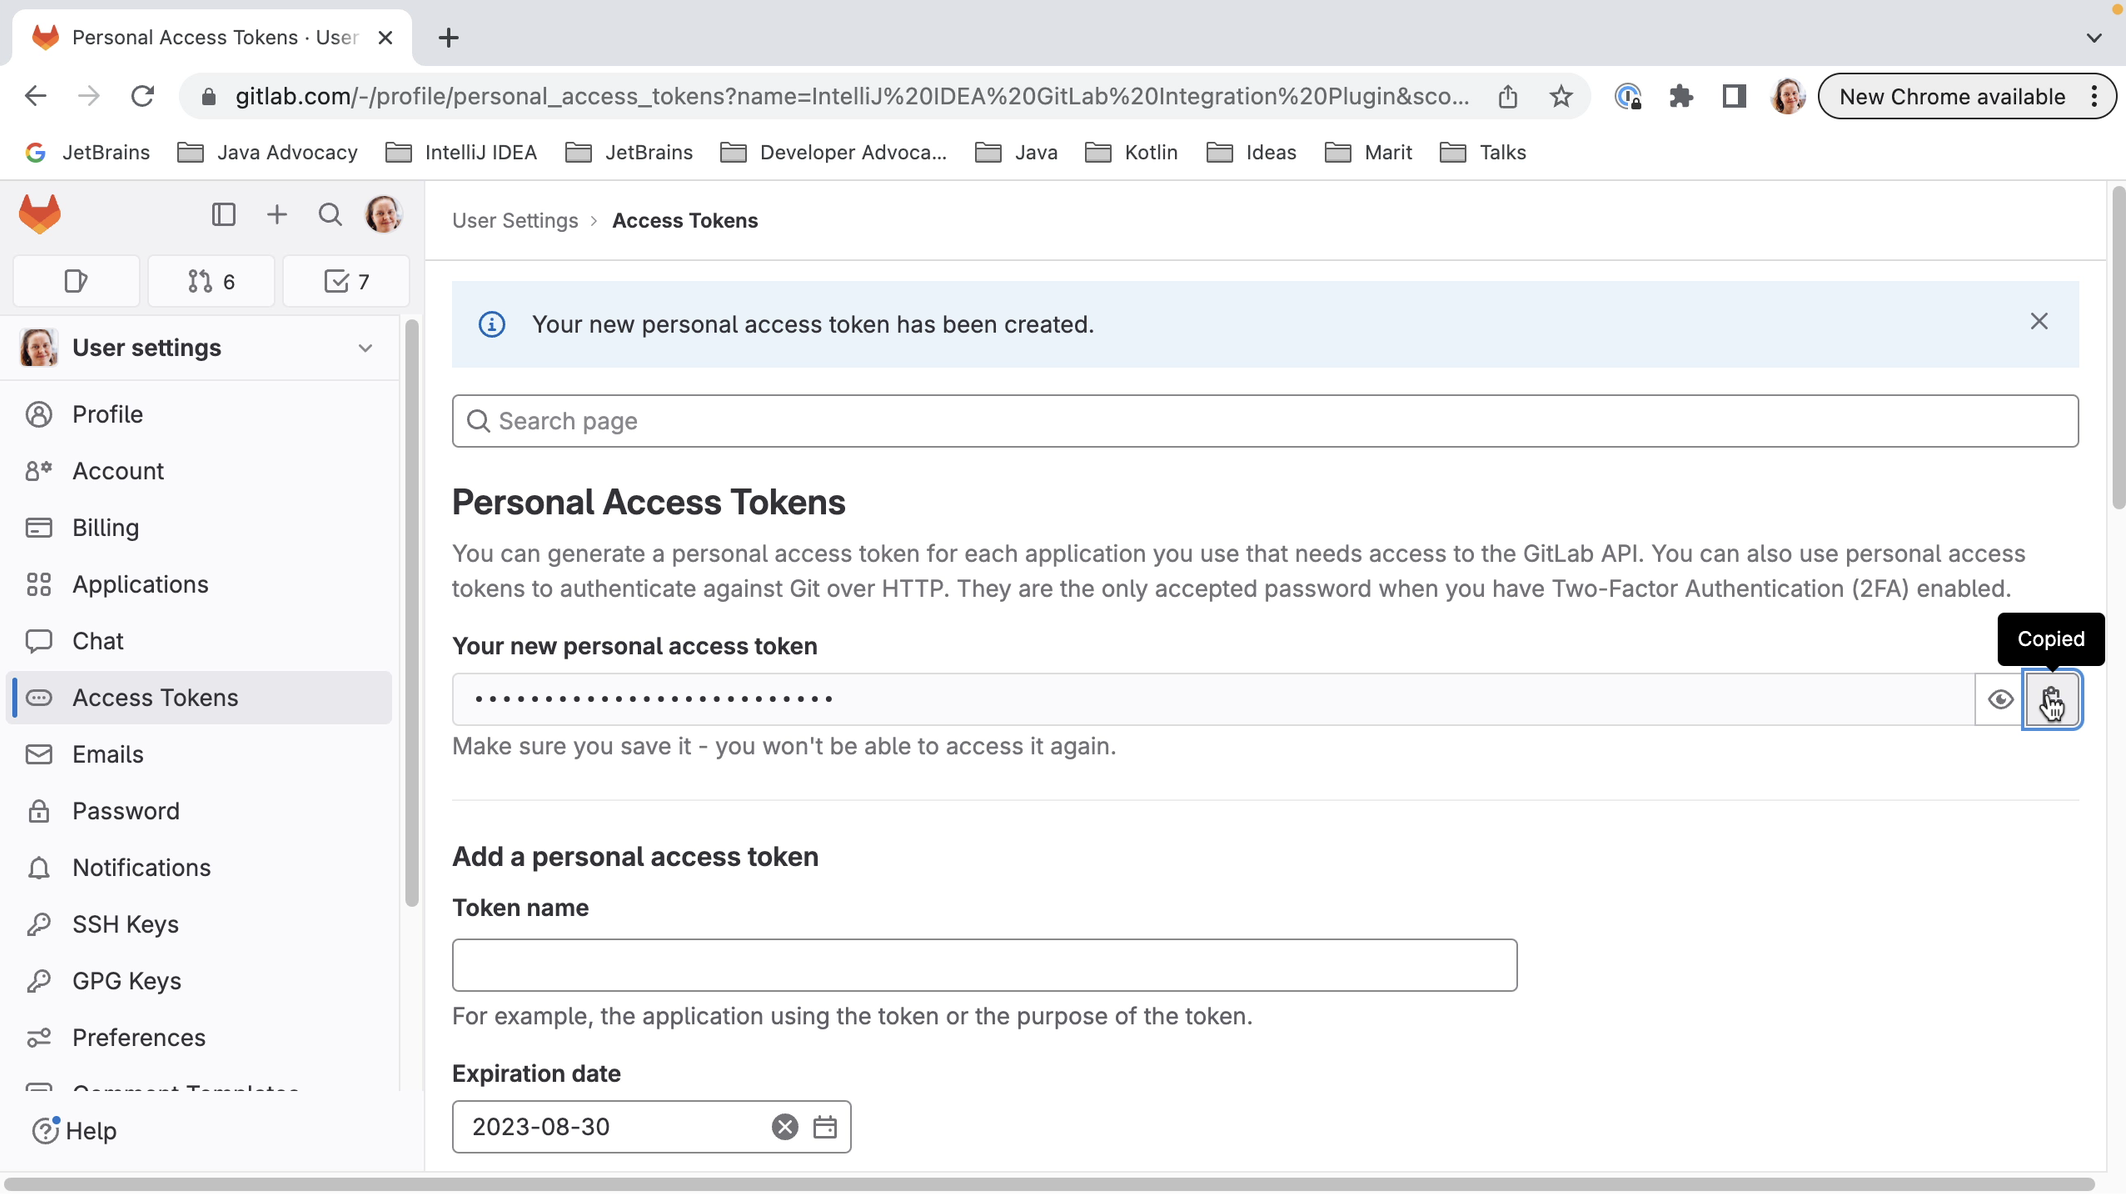
We can log into GitLab with a token. When we click Generate, this will take us to the GitLab page where a token with the right scopes can be generated for us. Click the button Create personal access token to create the token. When the token is generated, click the button to copy the token.
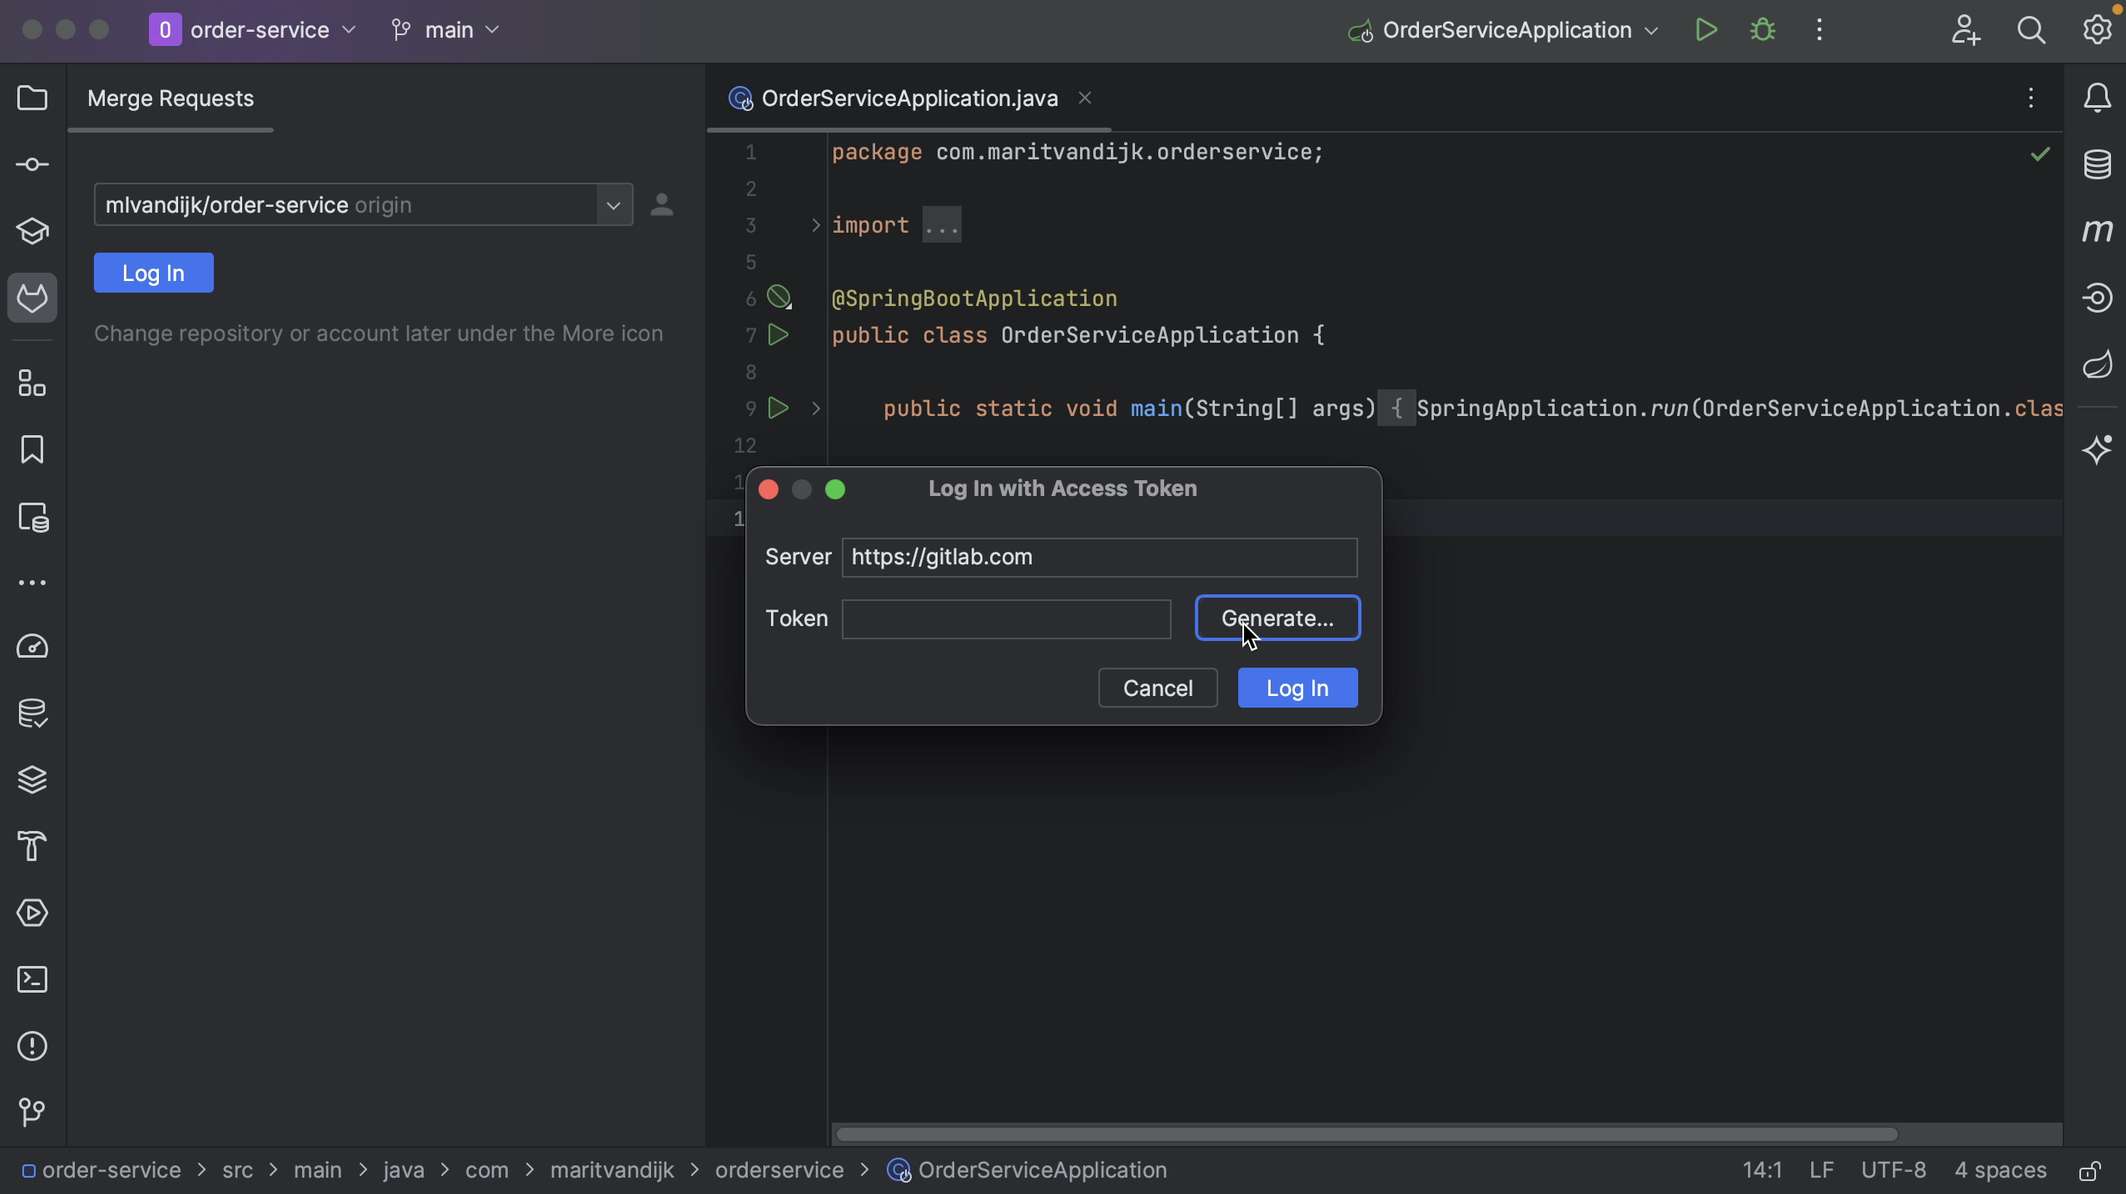
Generate a token
Create Personal Access Token
Copy the token

We can copy the token into the Token field in the popup and click Log In.
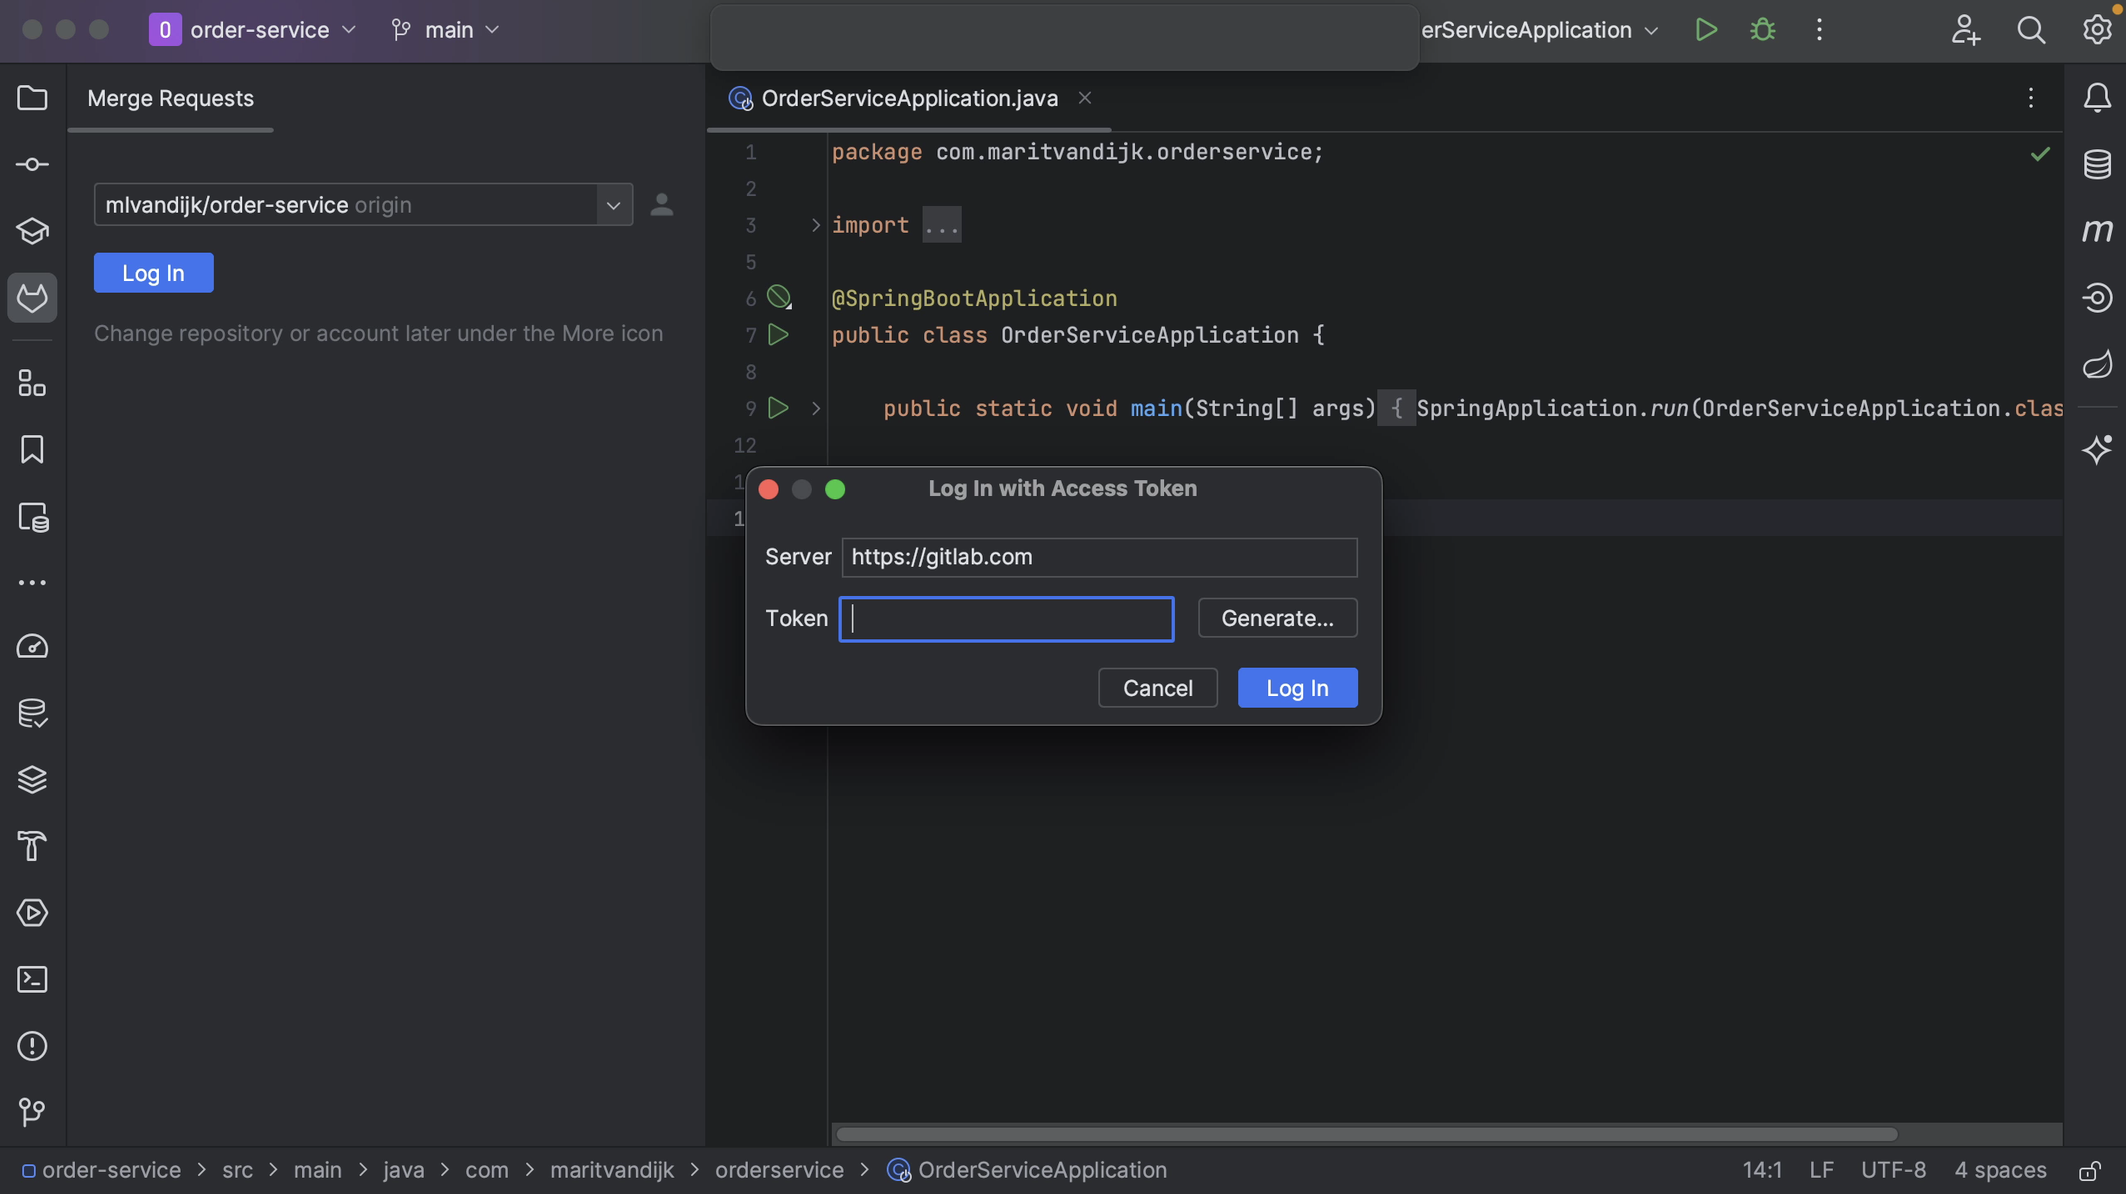
Paste the token into the Token field

Alternatively, we can use an existing token, as long as it has the required scopes.

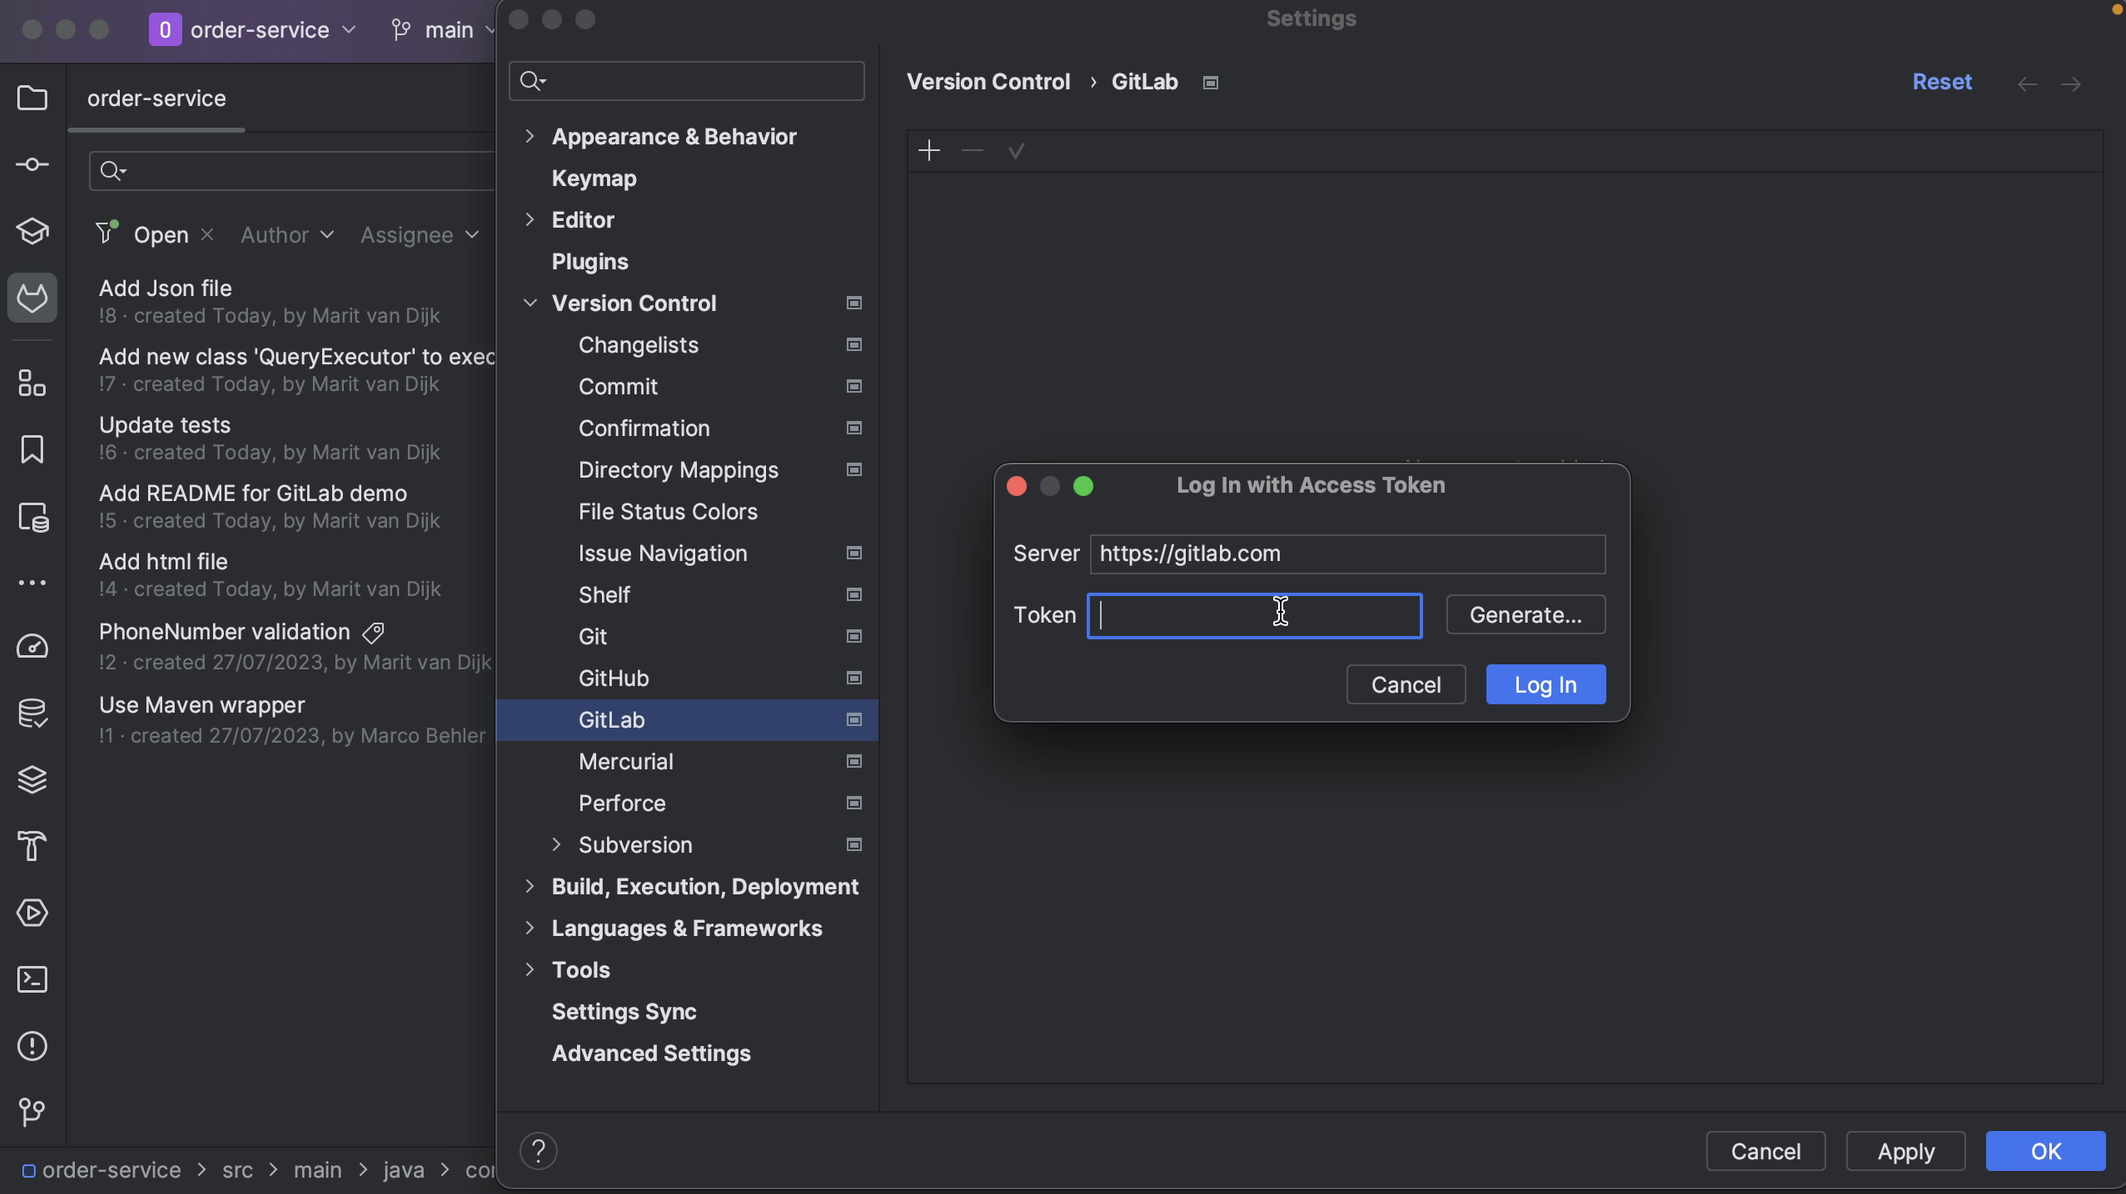
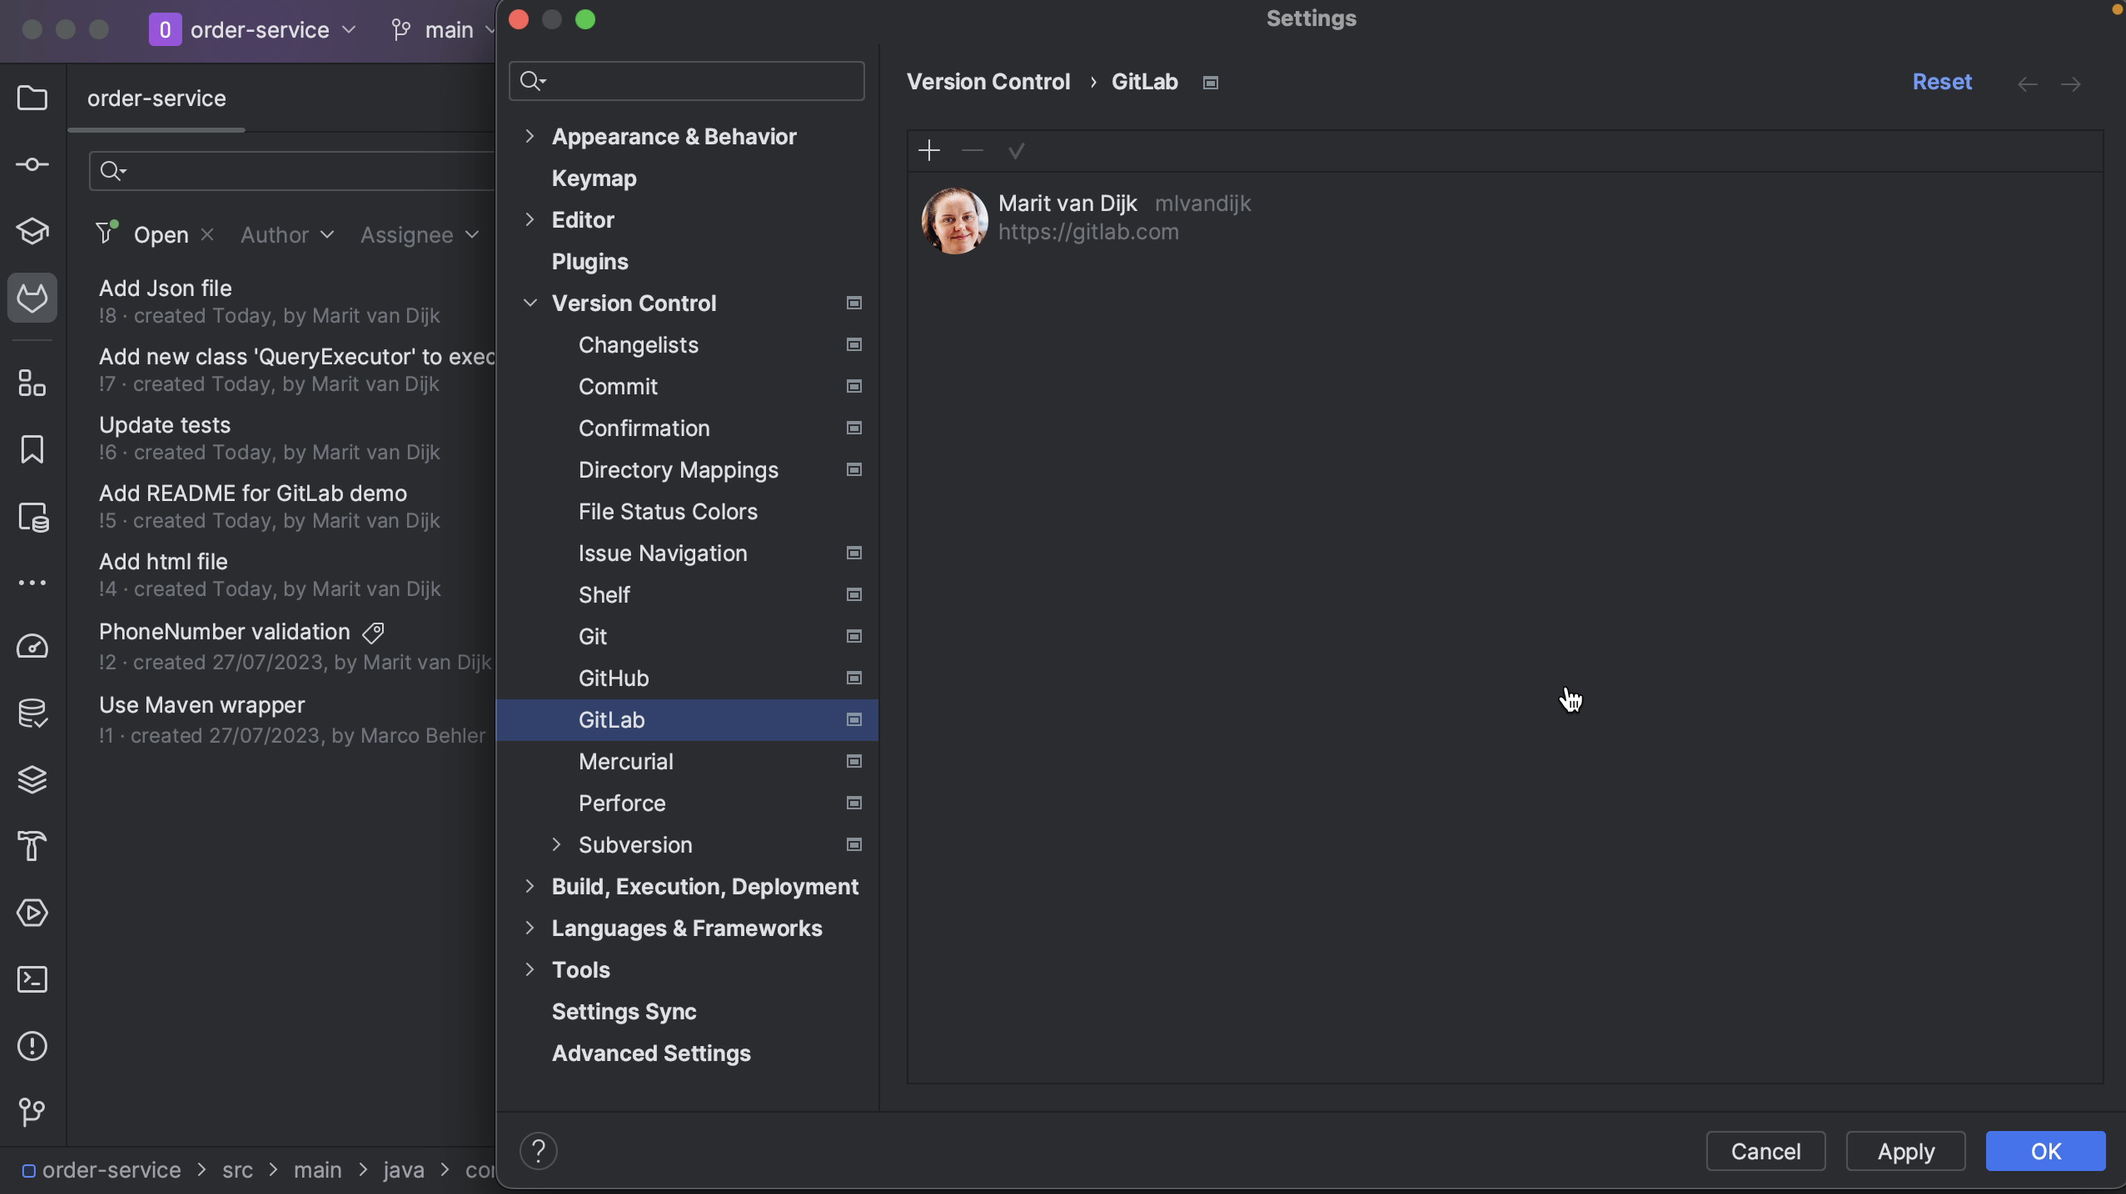
We can also log in to our GitLab account in the Settings. Open the Settings (⌘, on macOS | Ctrl+Alt+S on Windows/Linux) and go to Version Control > GitLab. Click Add Account (⌘N on macOS | Alt+Insert on Windows/Linux) to add an account if there is no account logged in, or click the + button at the top left to add an account. In the popup, add the Server if needed, paste the token from GitLab into the Token field in the popup and click Log In.
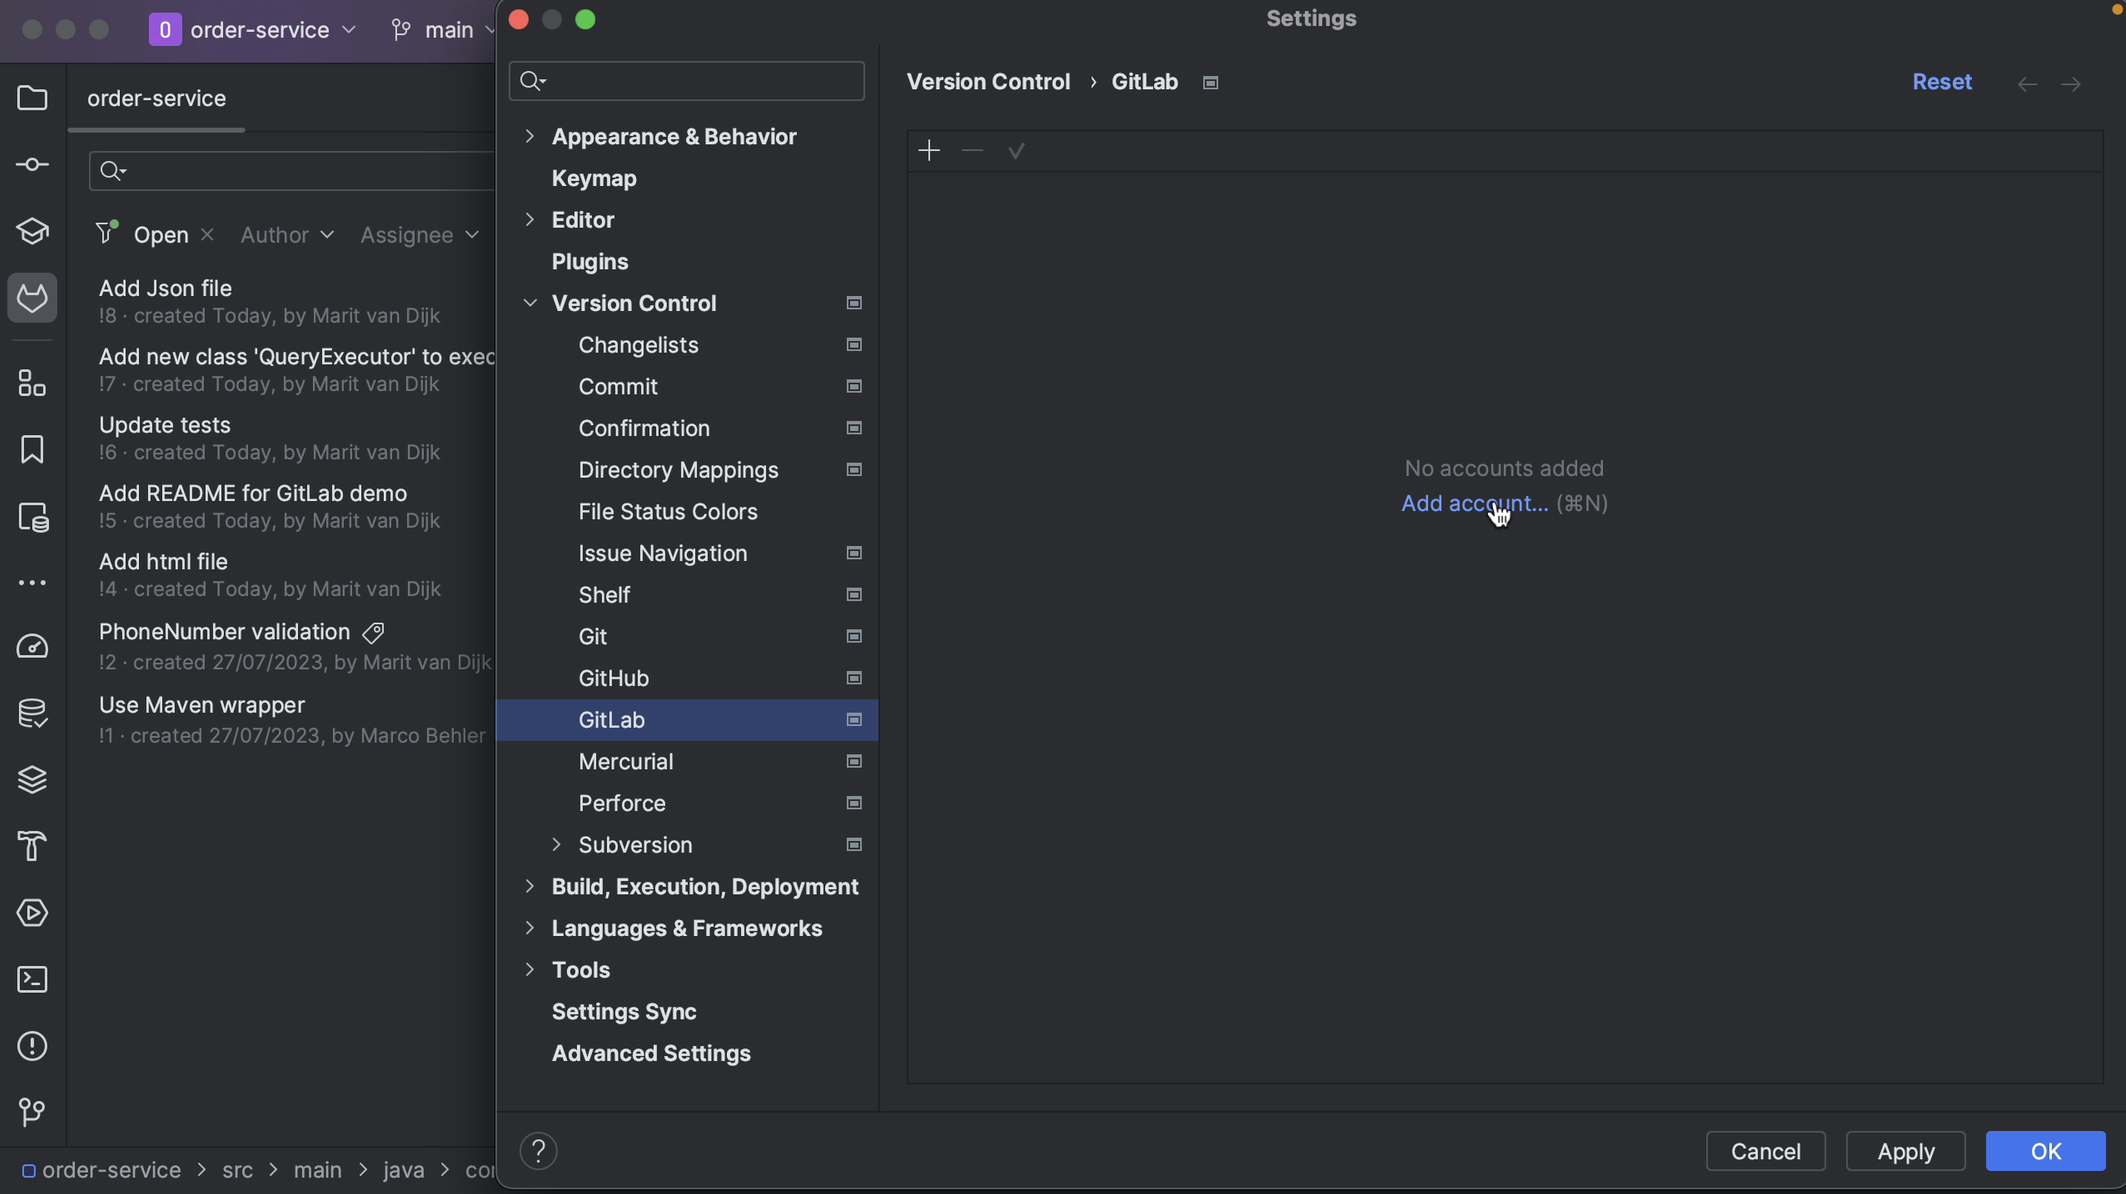
Add GitLab account in Settings
Paste the token into the Token field in Settings
Account added in Settings

GitLab Merge Request tool window

Once we’re logged in, the GitLab Merge Requests tool window will show all open Merge Requests for the GitLab repository.
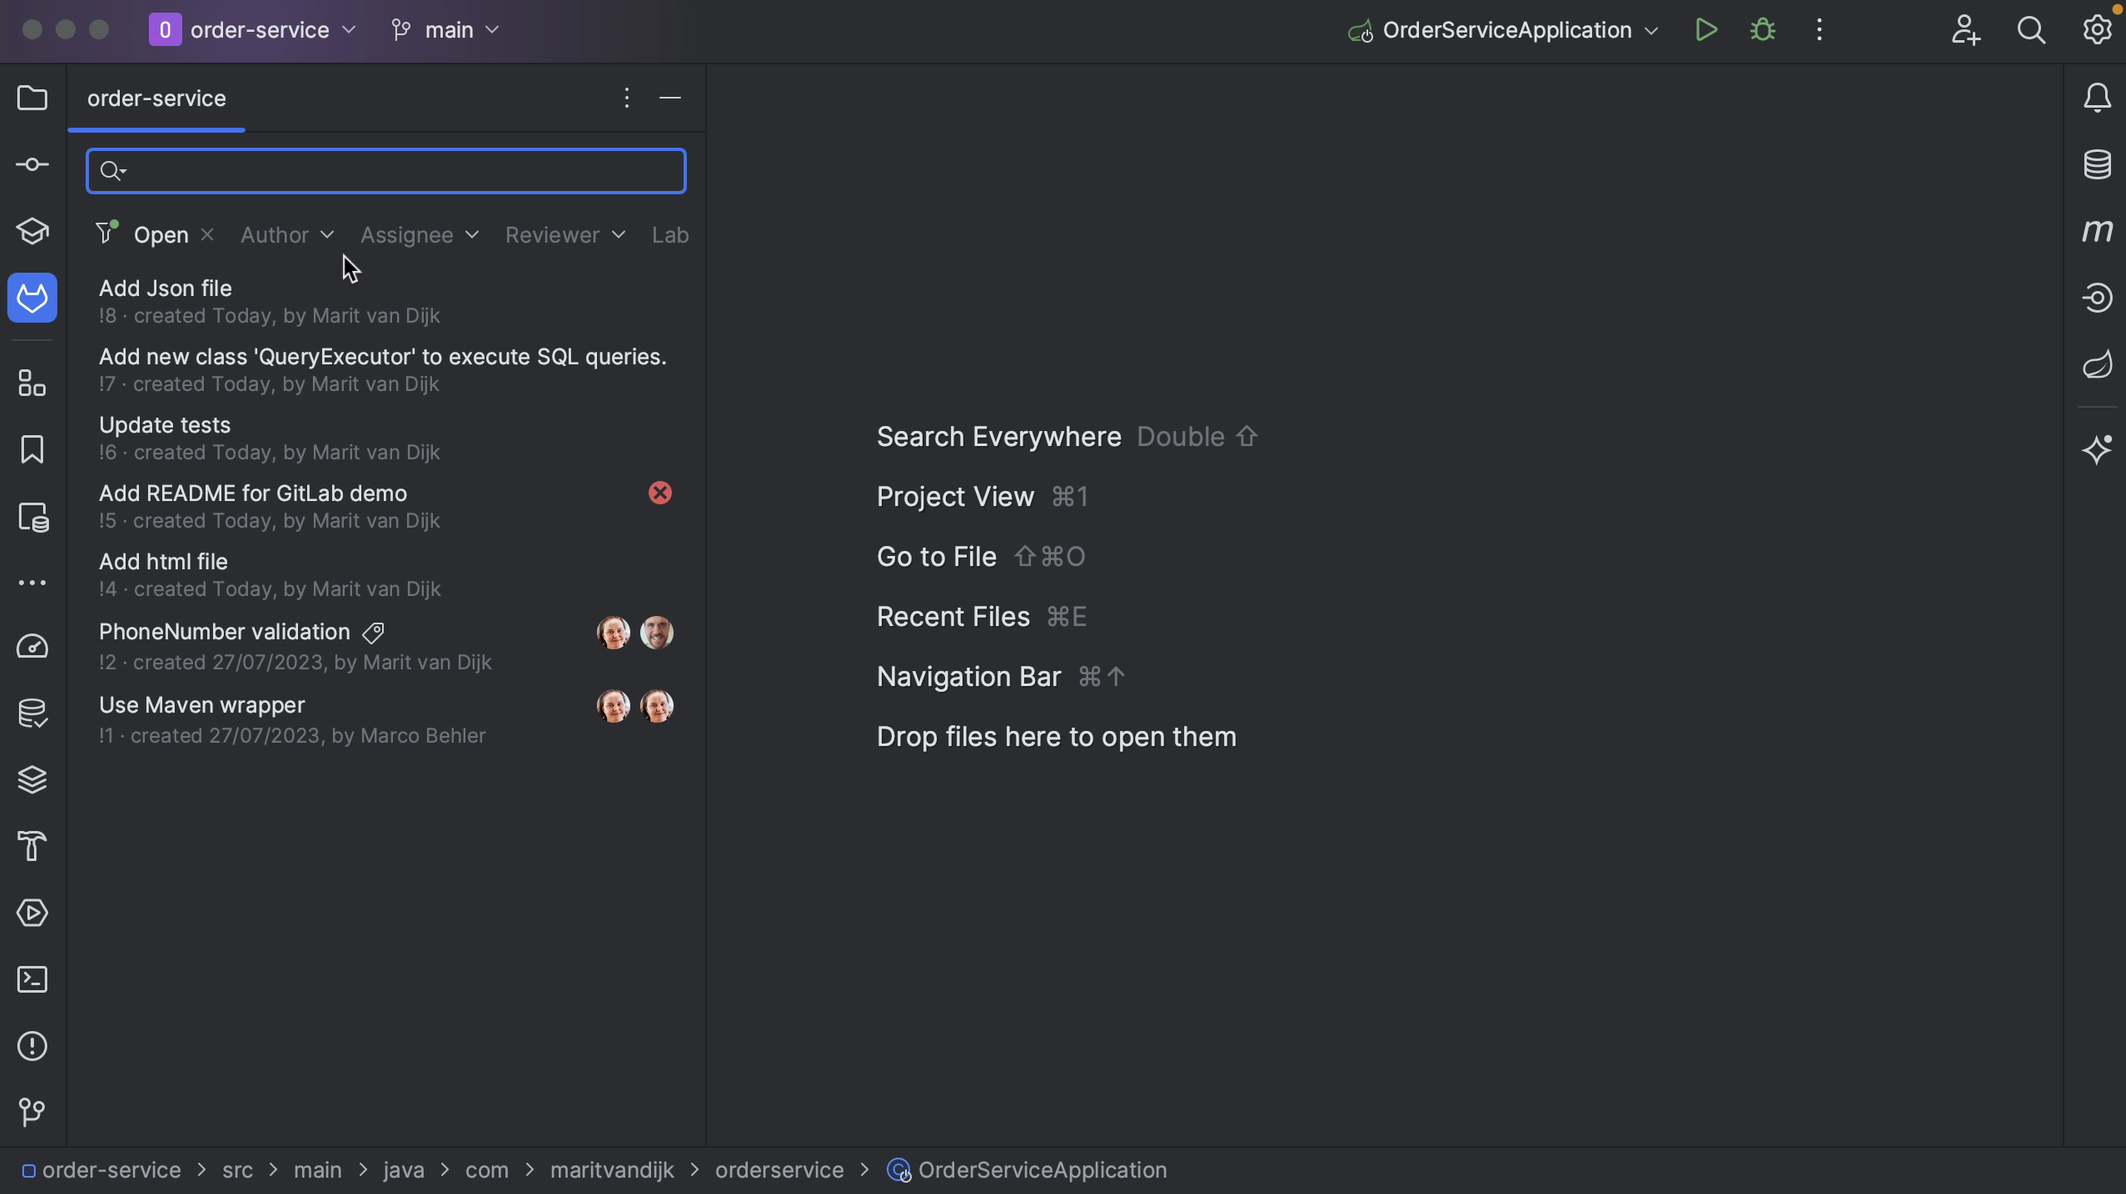
GitLab Merge Requests tool window

We can change the search criteria to look for specific Merge Requests. We can use predefined filters, or search for something more specific.
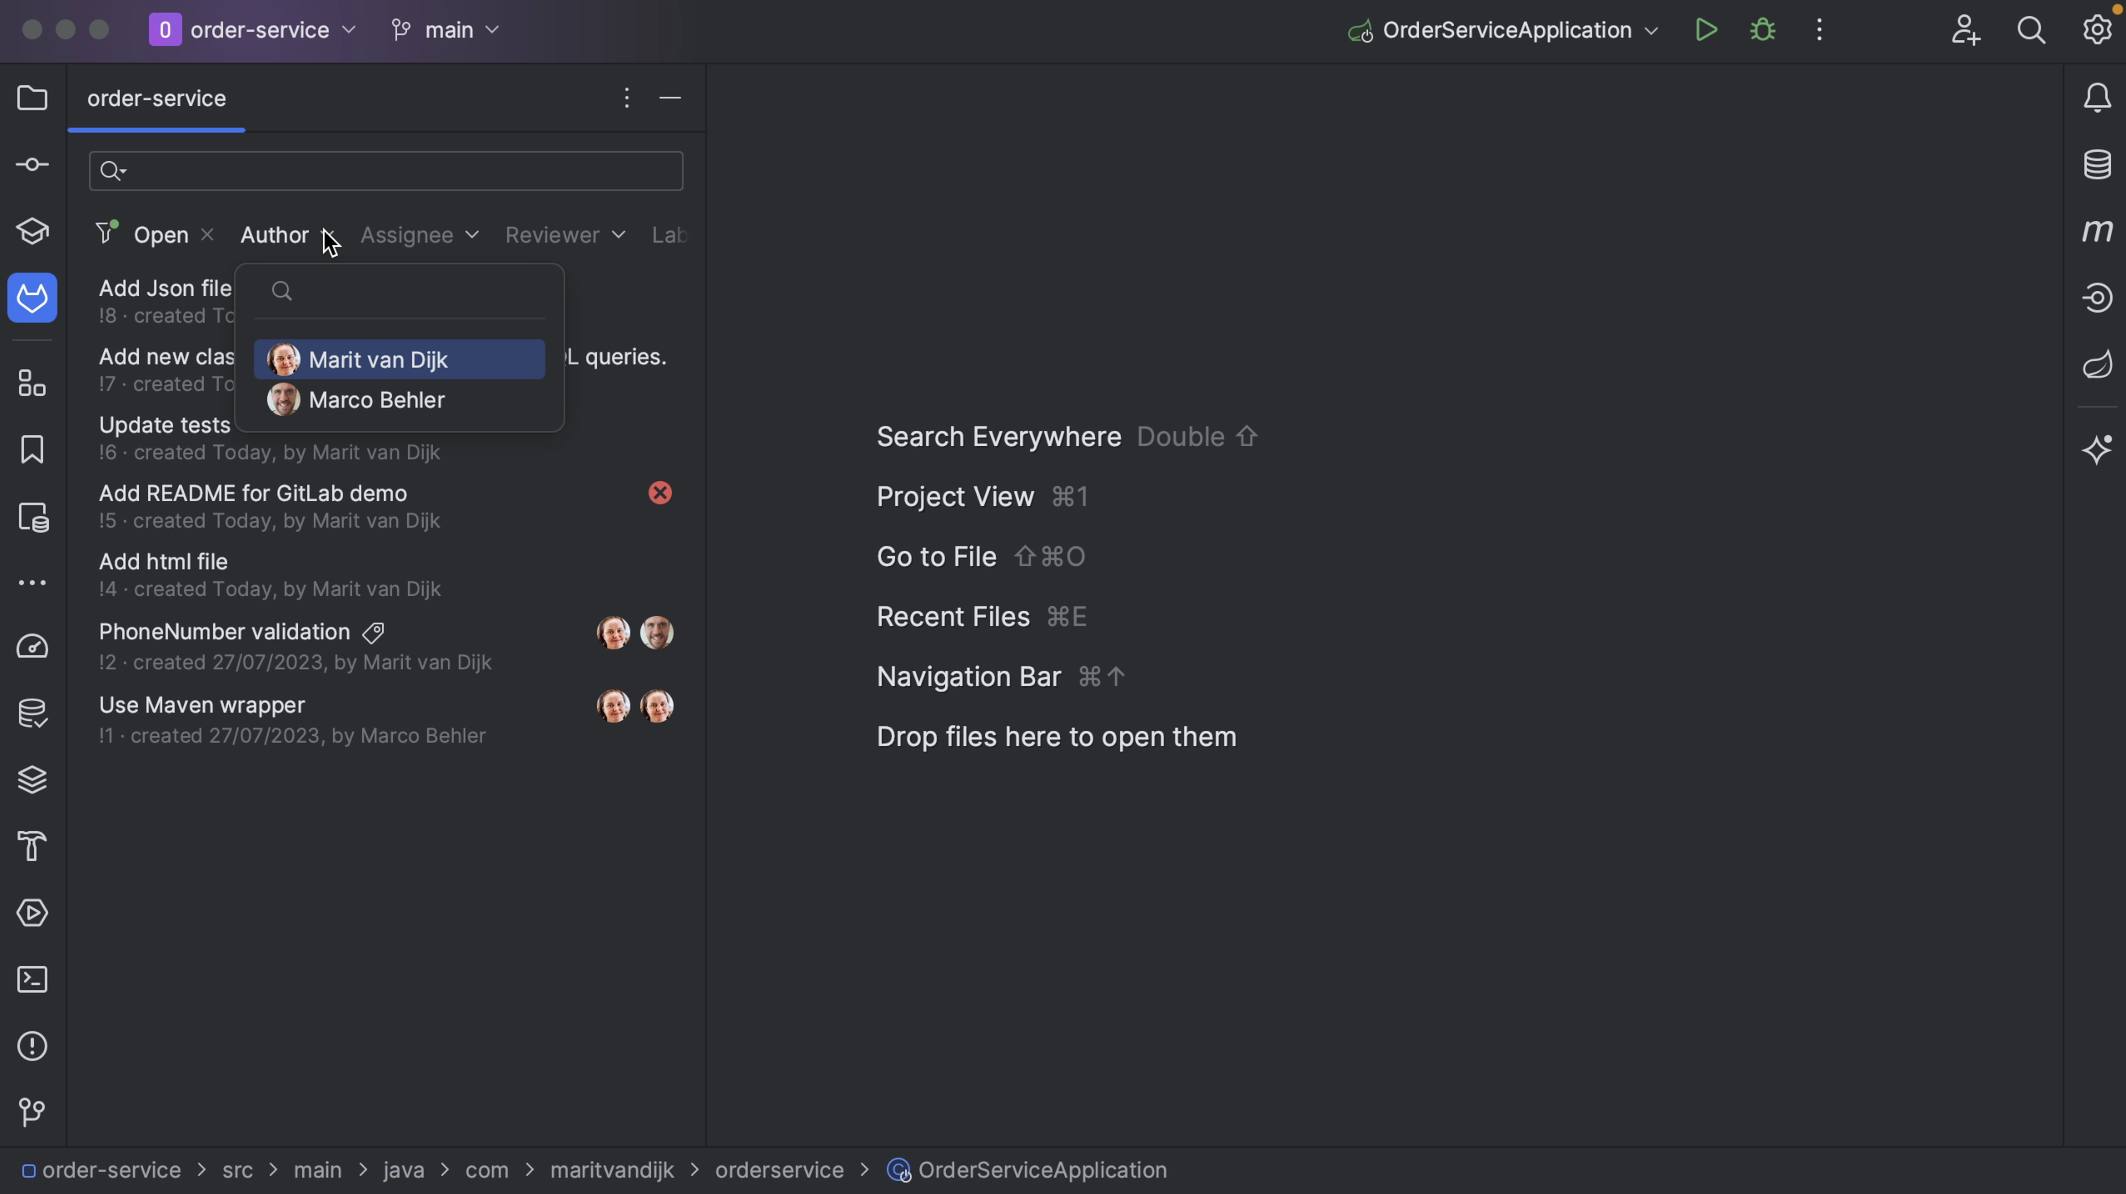
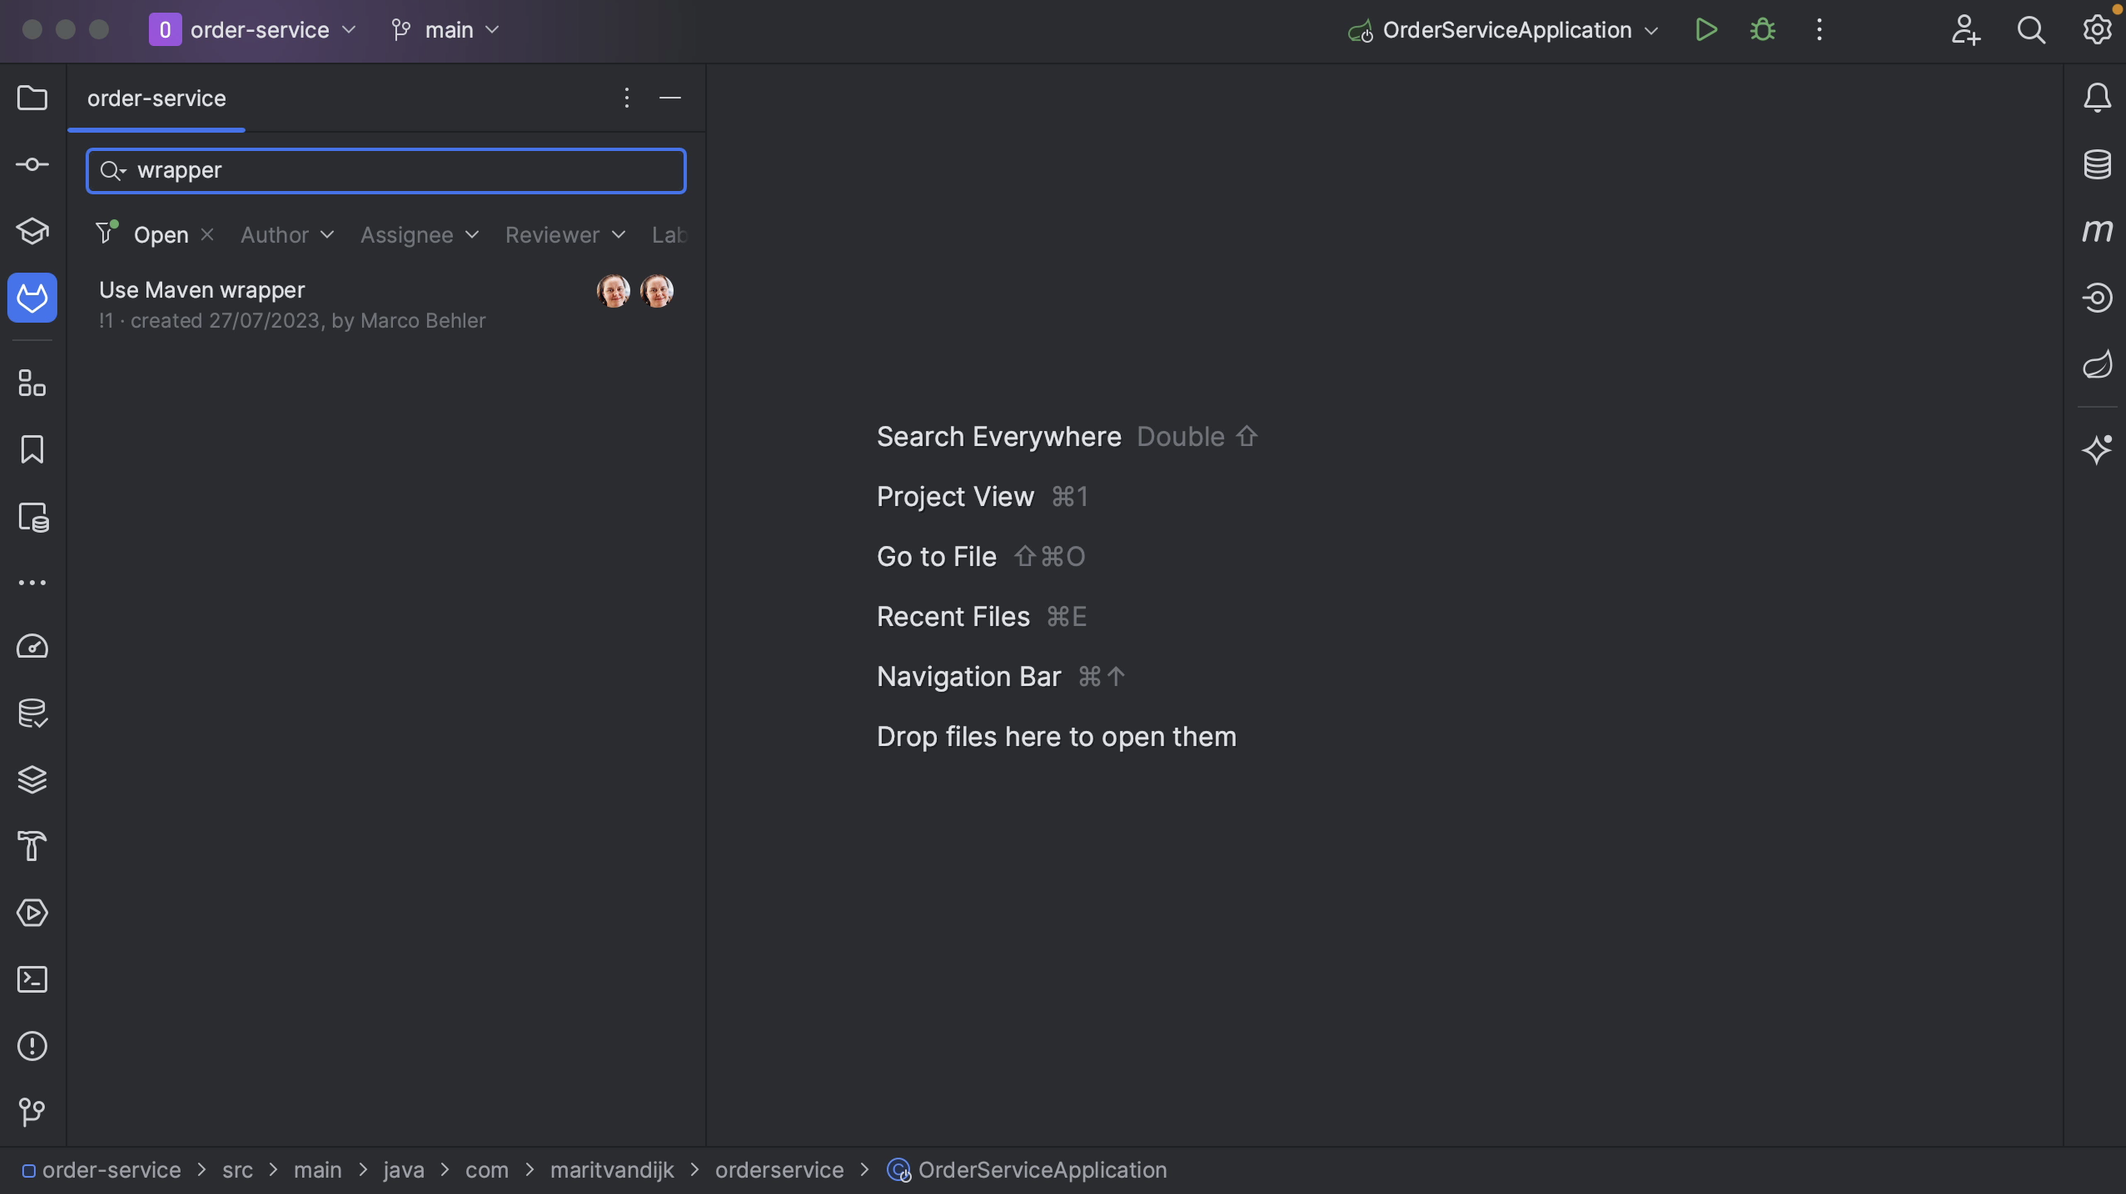
Filter
Search

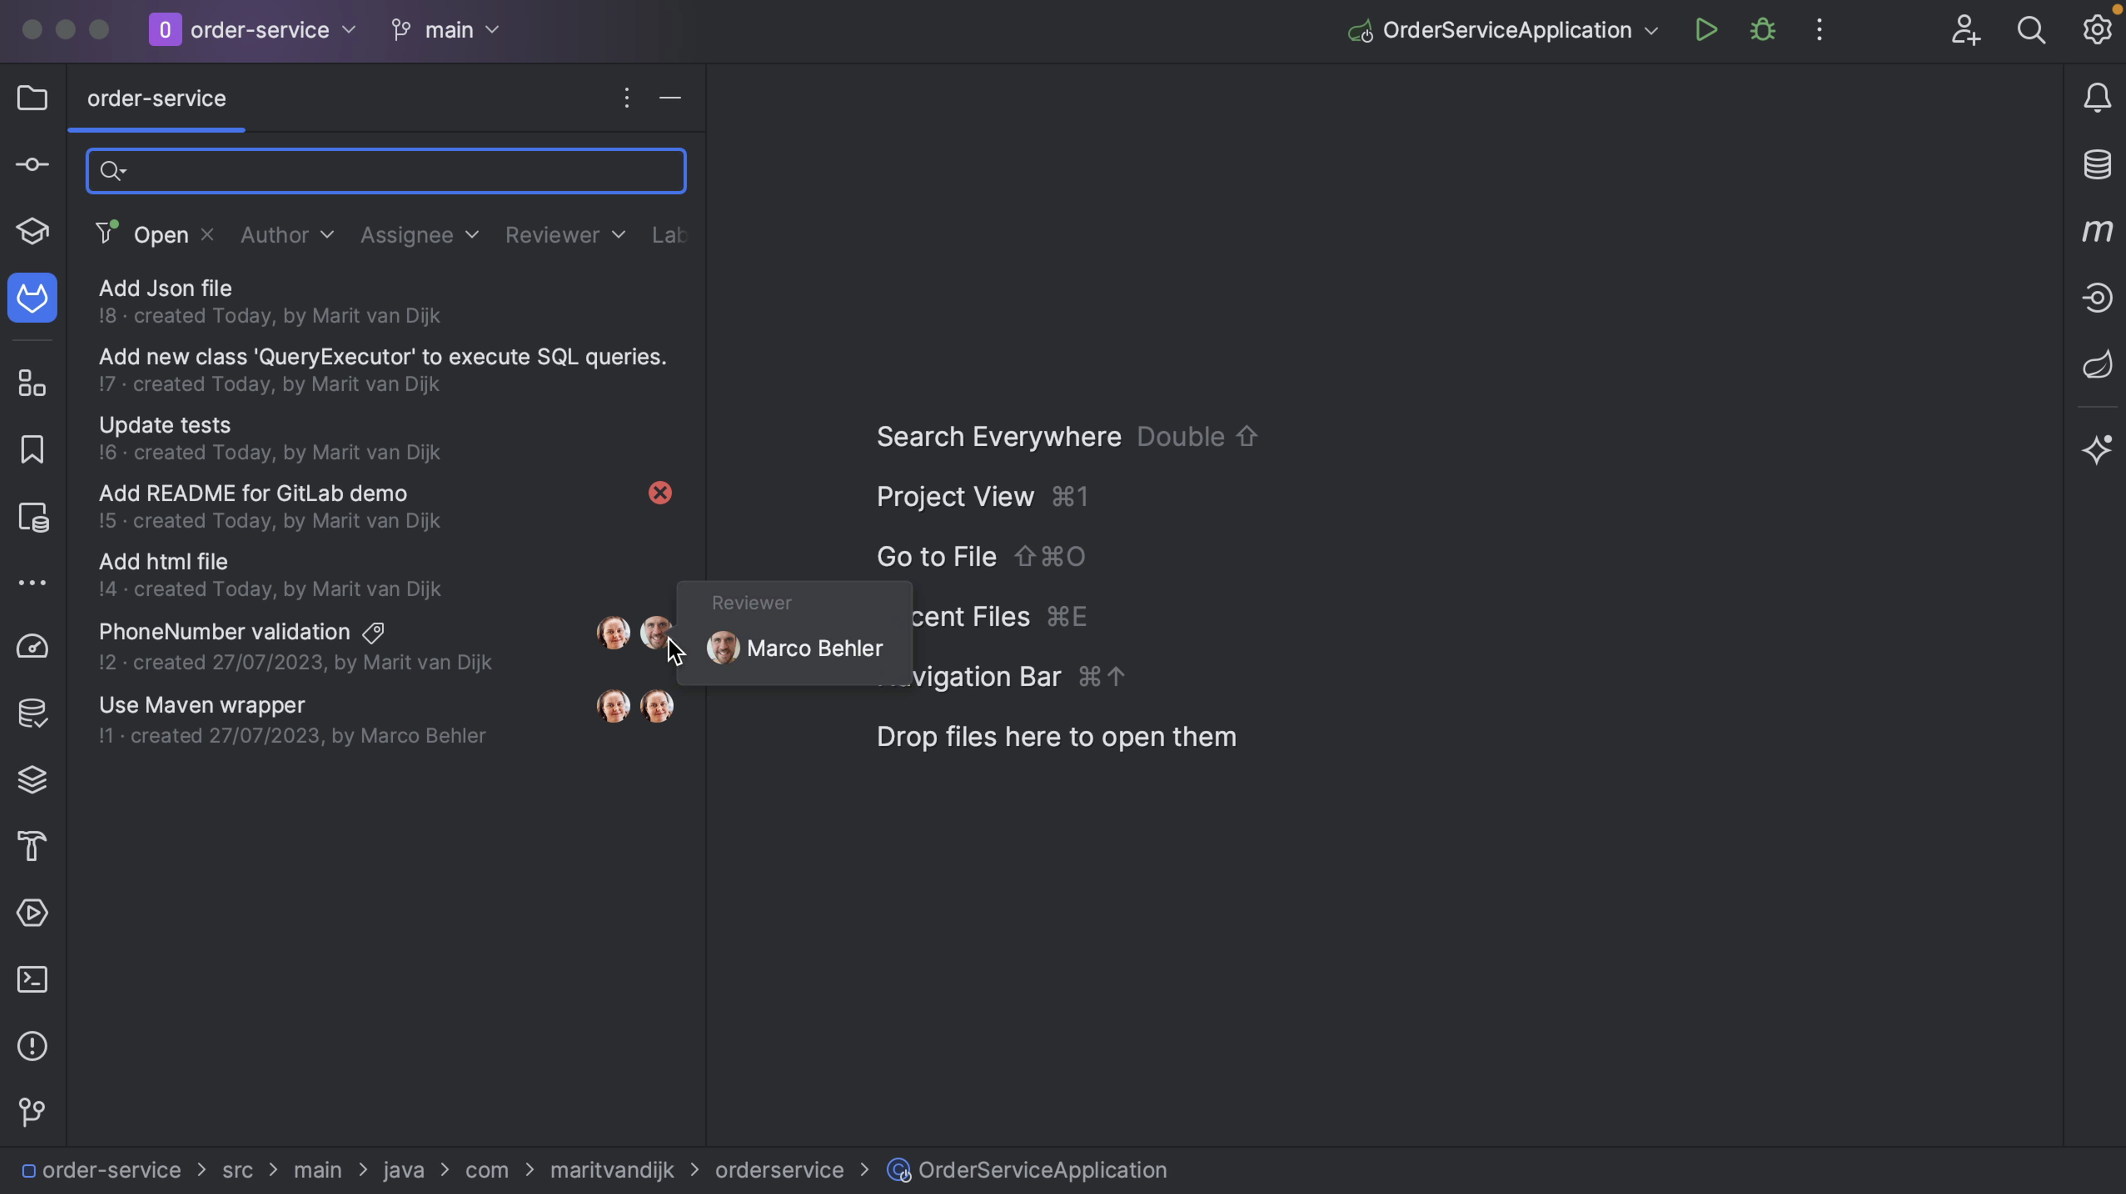
If the Merge Request has assignees and/or reviewers assigned, we can see them here.
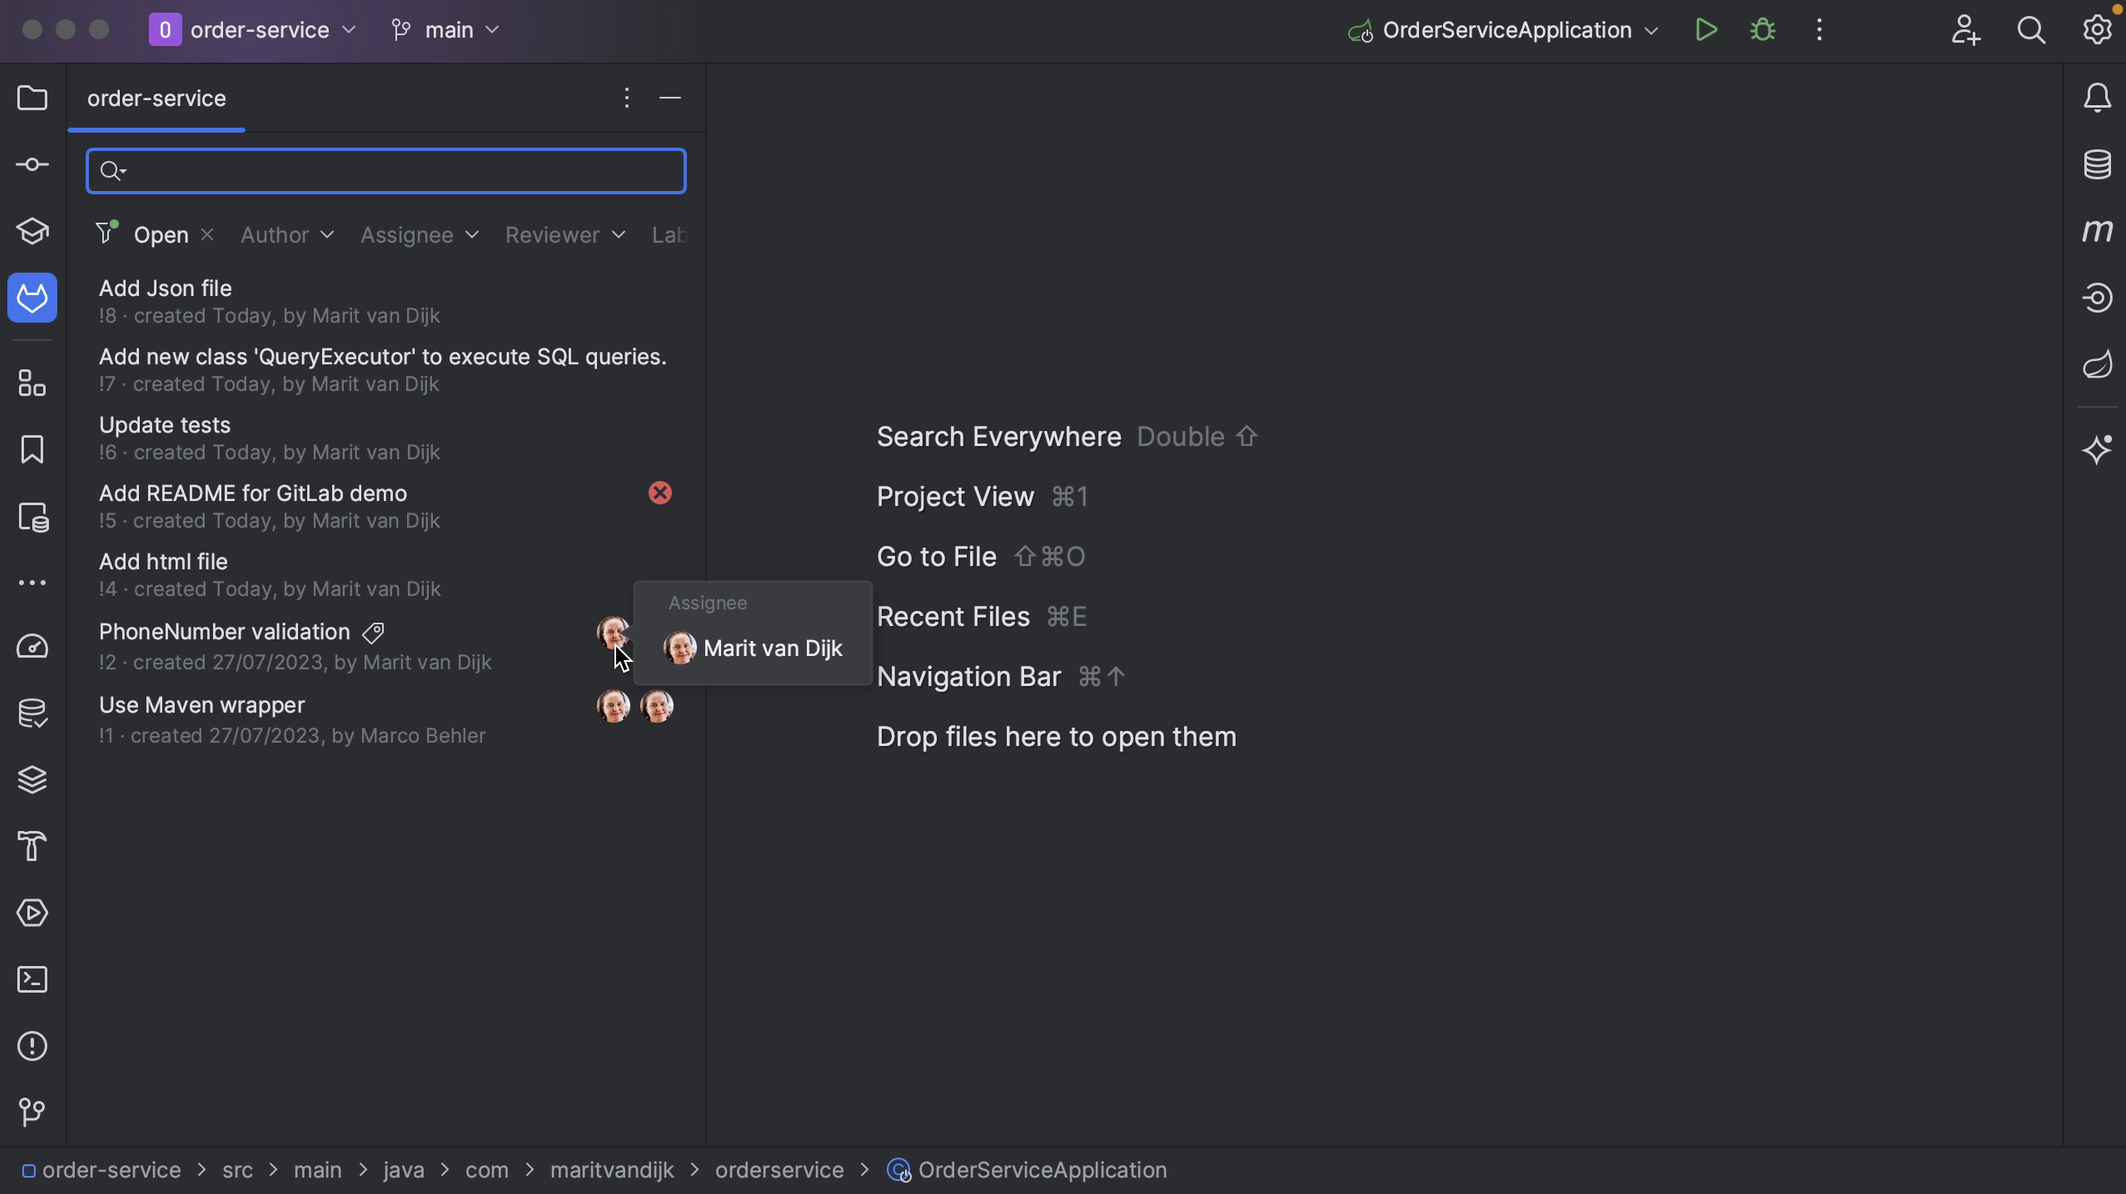
Assignee
Reviewer

We can see the details of a specific Merge Request by double-clicking on it.

Merge Request details

We can go back to the list of search results by clicking the project name in the top left of the Merge Requests tool window. We can see that the Merge Request we just looked at still has a tab open here, in case we want to go back.
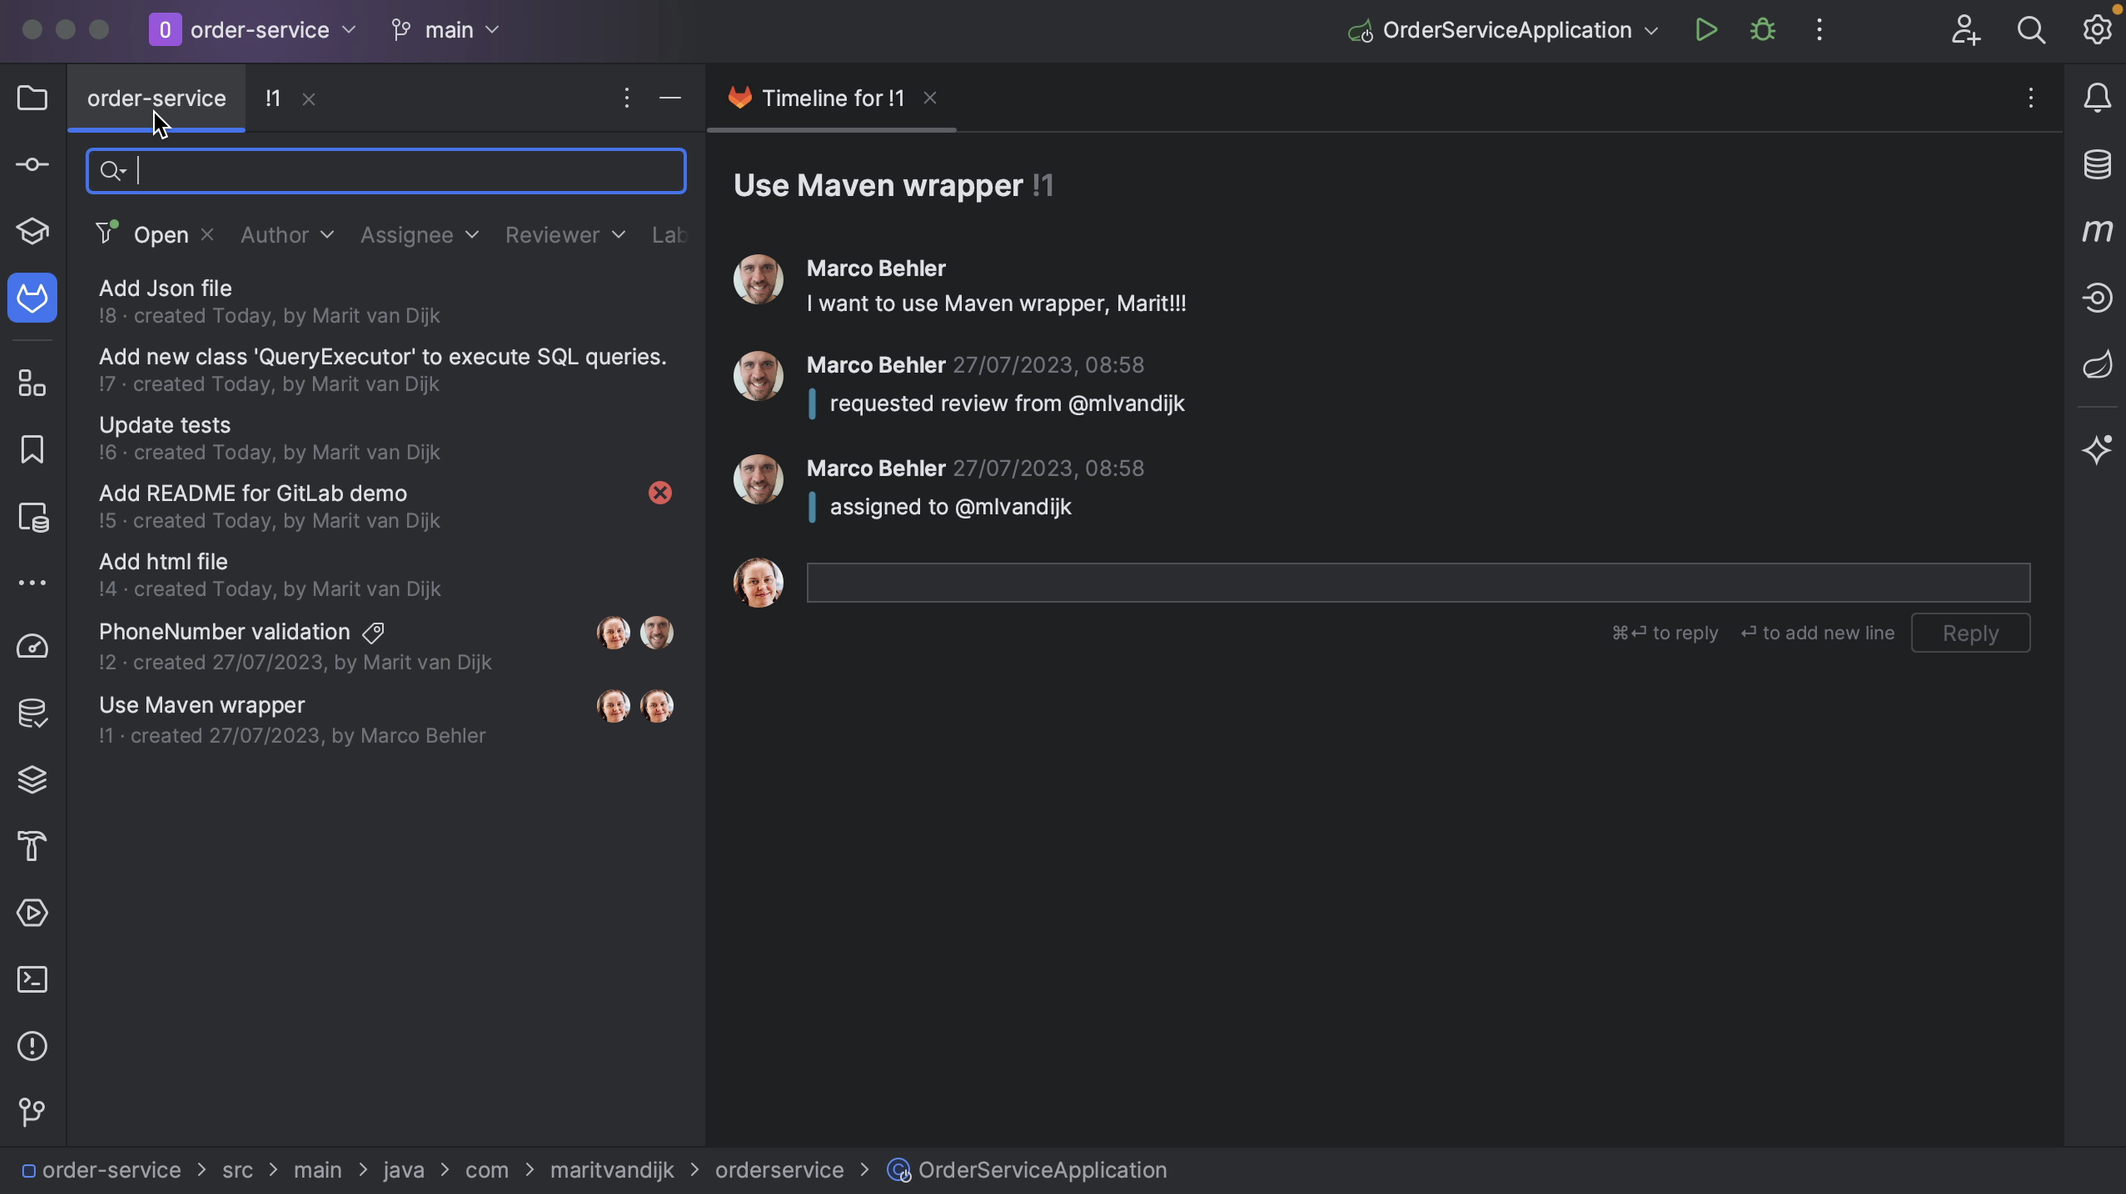
Click project name to go back to the list of Merge Requests

Usually, you’ll want to look for open Merge Requests, since these are the ones that need attention. Let’s double-click, or press Enter, on one of these Merge Requests.
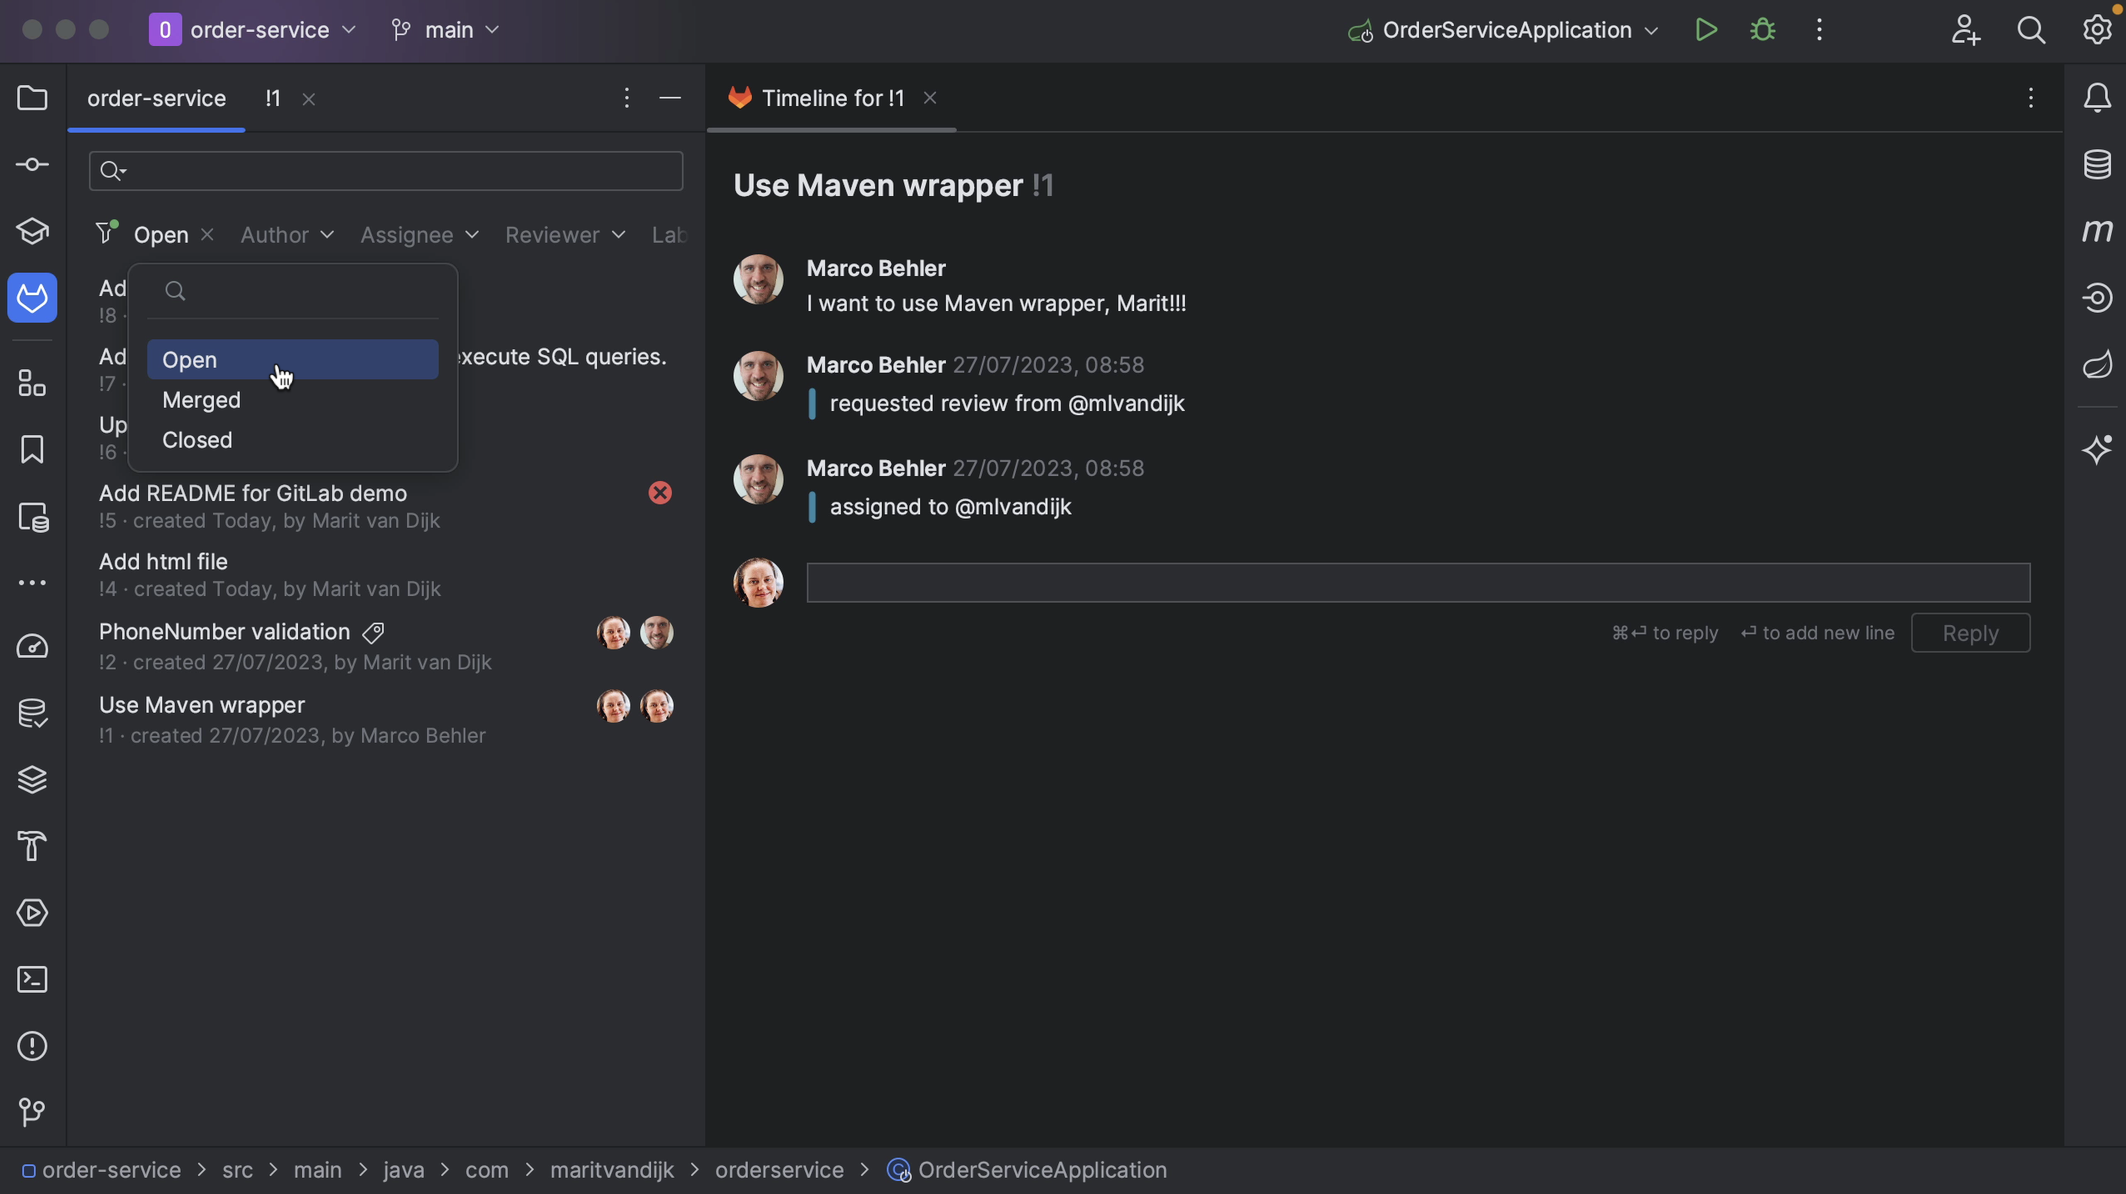
Open Merge Requests

View GitLab Merge Requests inside IntelliJ IDEA

If the Merge Request does not have a reviewer assigned, we can assign one from the Merge Request tool window in IntelliJ IDEA. Click the three dots at the bottom left of the Merge Request details and select the action Request Review. From the list that pops up, select the reviewer(s) to assign this Merge Request to.
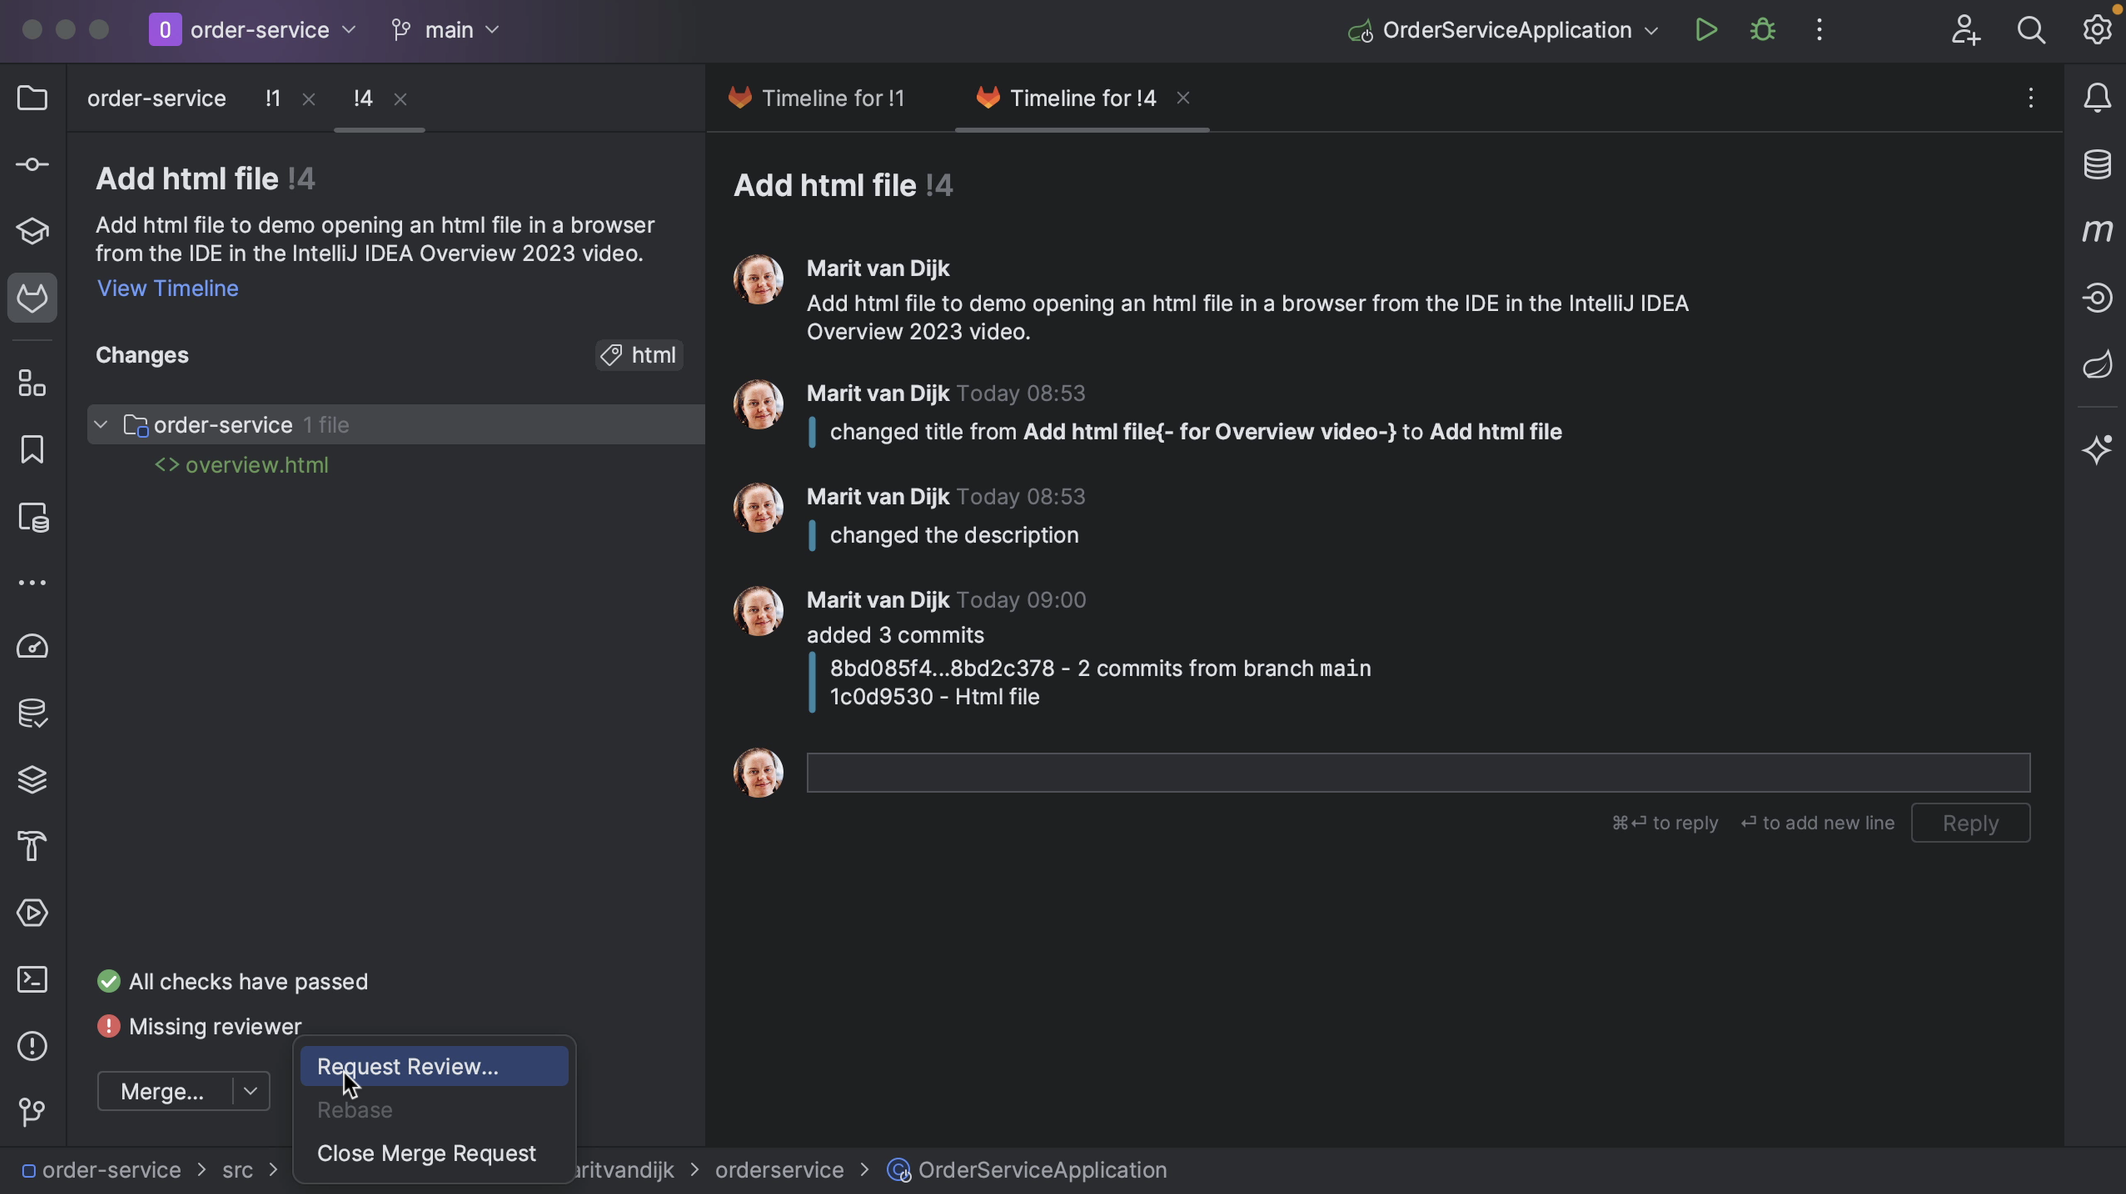
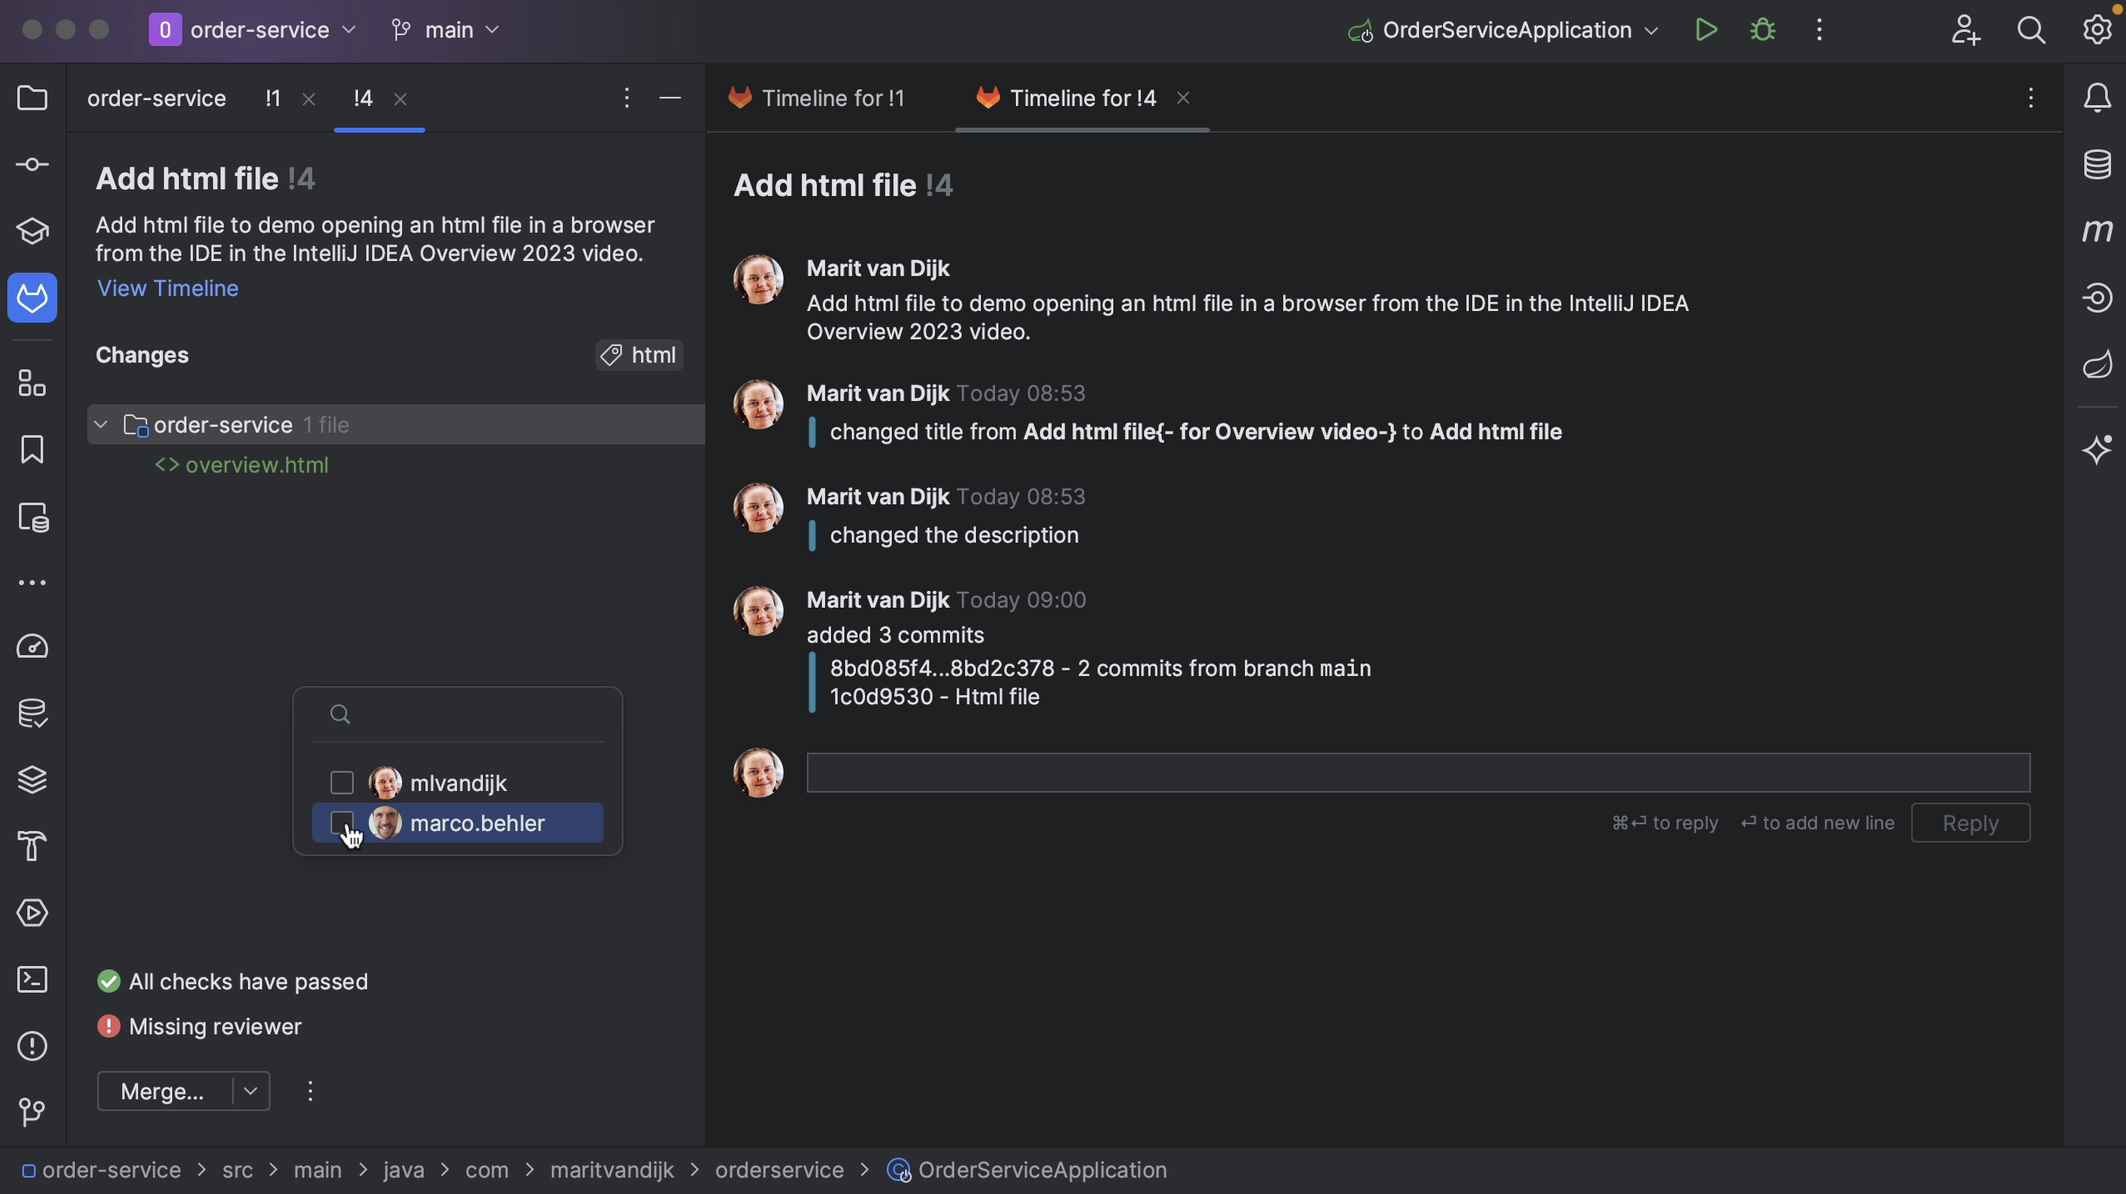
Request Review
Assign reviewer

We can see the files that have been changed in the Merge Request in the bottom left window, and the timeline in the main editor pane.
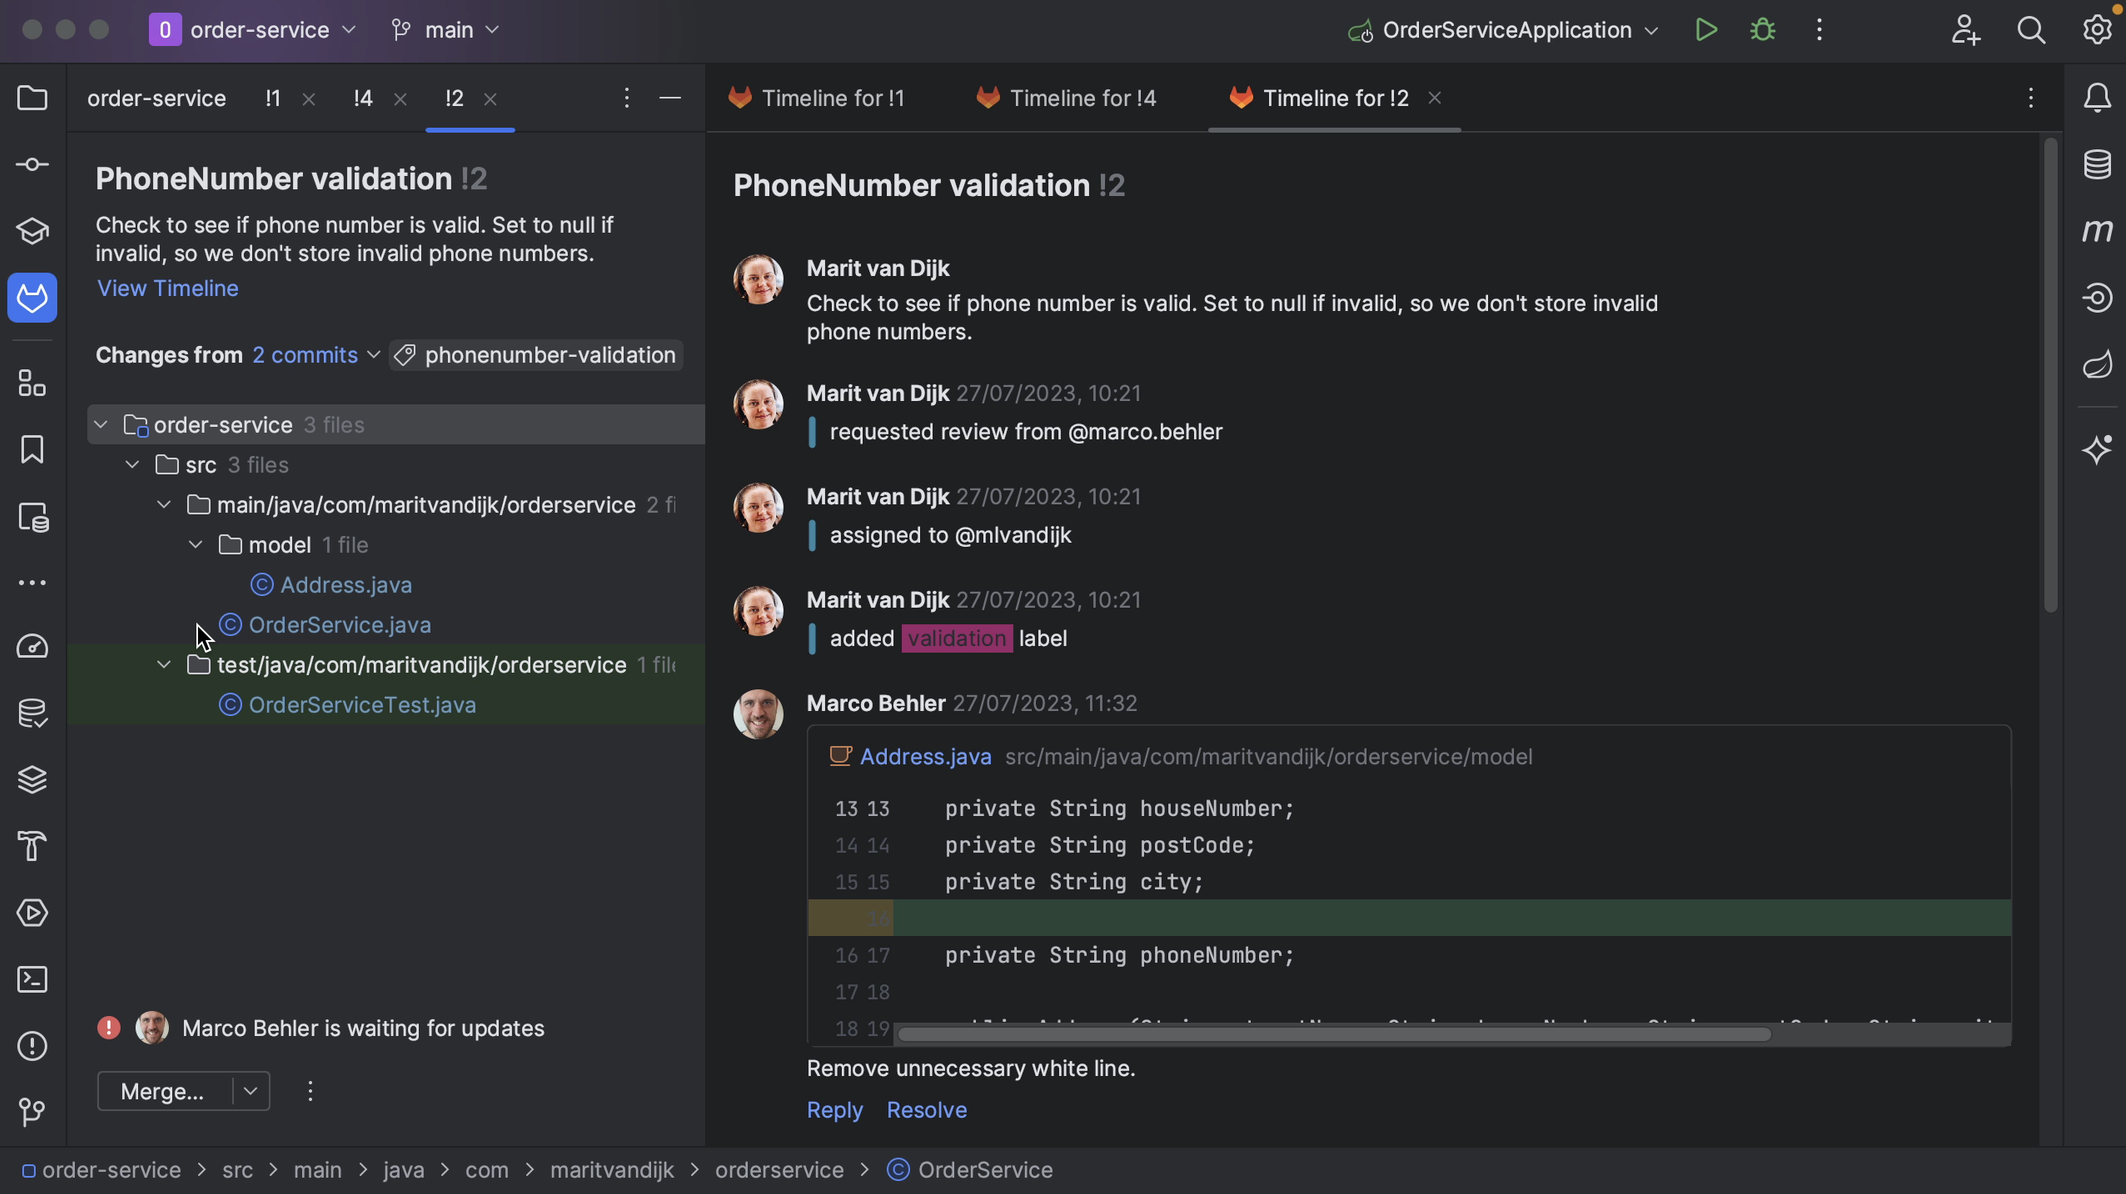
Changed files and timeline

We can also select a file to see the diff as well as the comments for that file. We can go back to the timeline by clicking View Timeline.

The timeline shows the same information as the GitLab Merge Request activity page. The timeline shows activity on the Merge Request, including comments and other status changes in the main editor pane. If there are inline comments on the code, we can see them here.

It also shows the result of any checks that were run. We can go to the details to see which checks failed, and even click them to go straight to the failing check on GitLab, so we can look at the details.
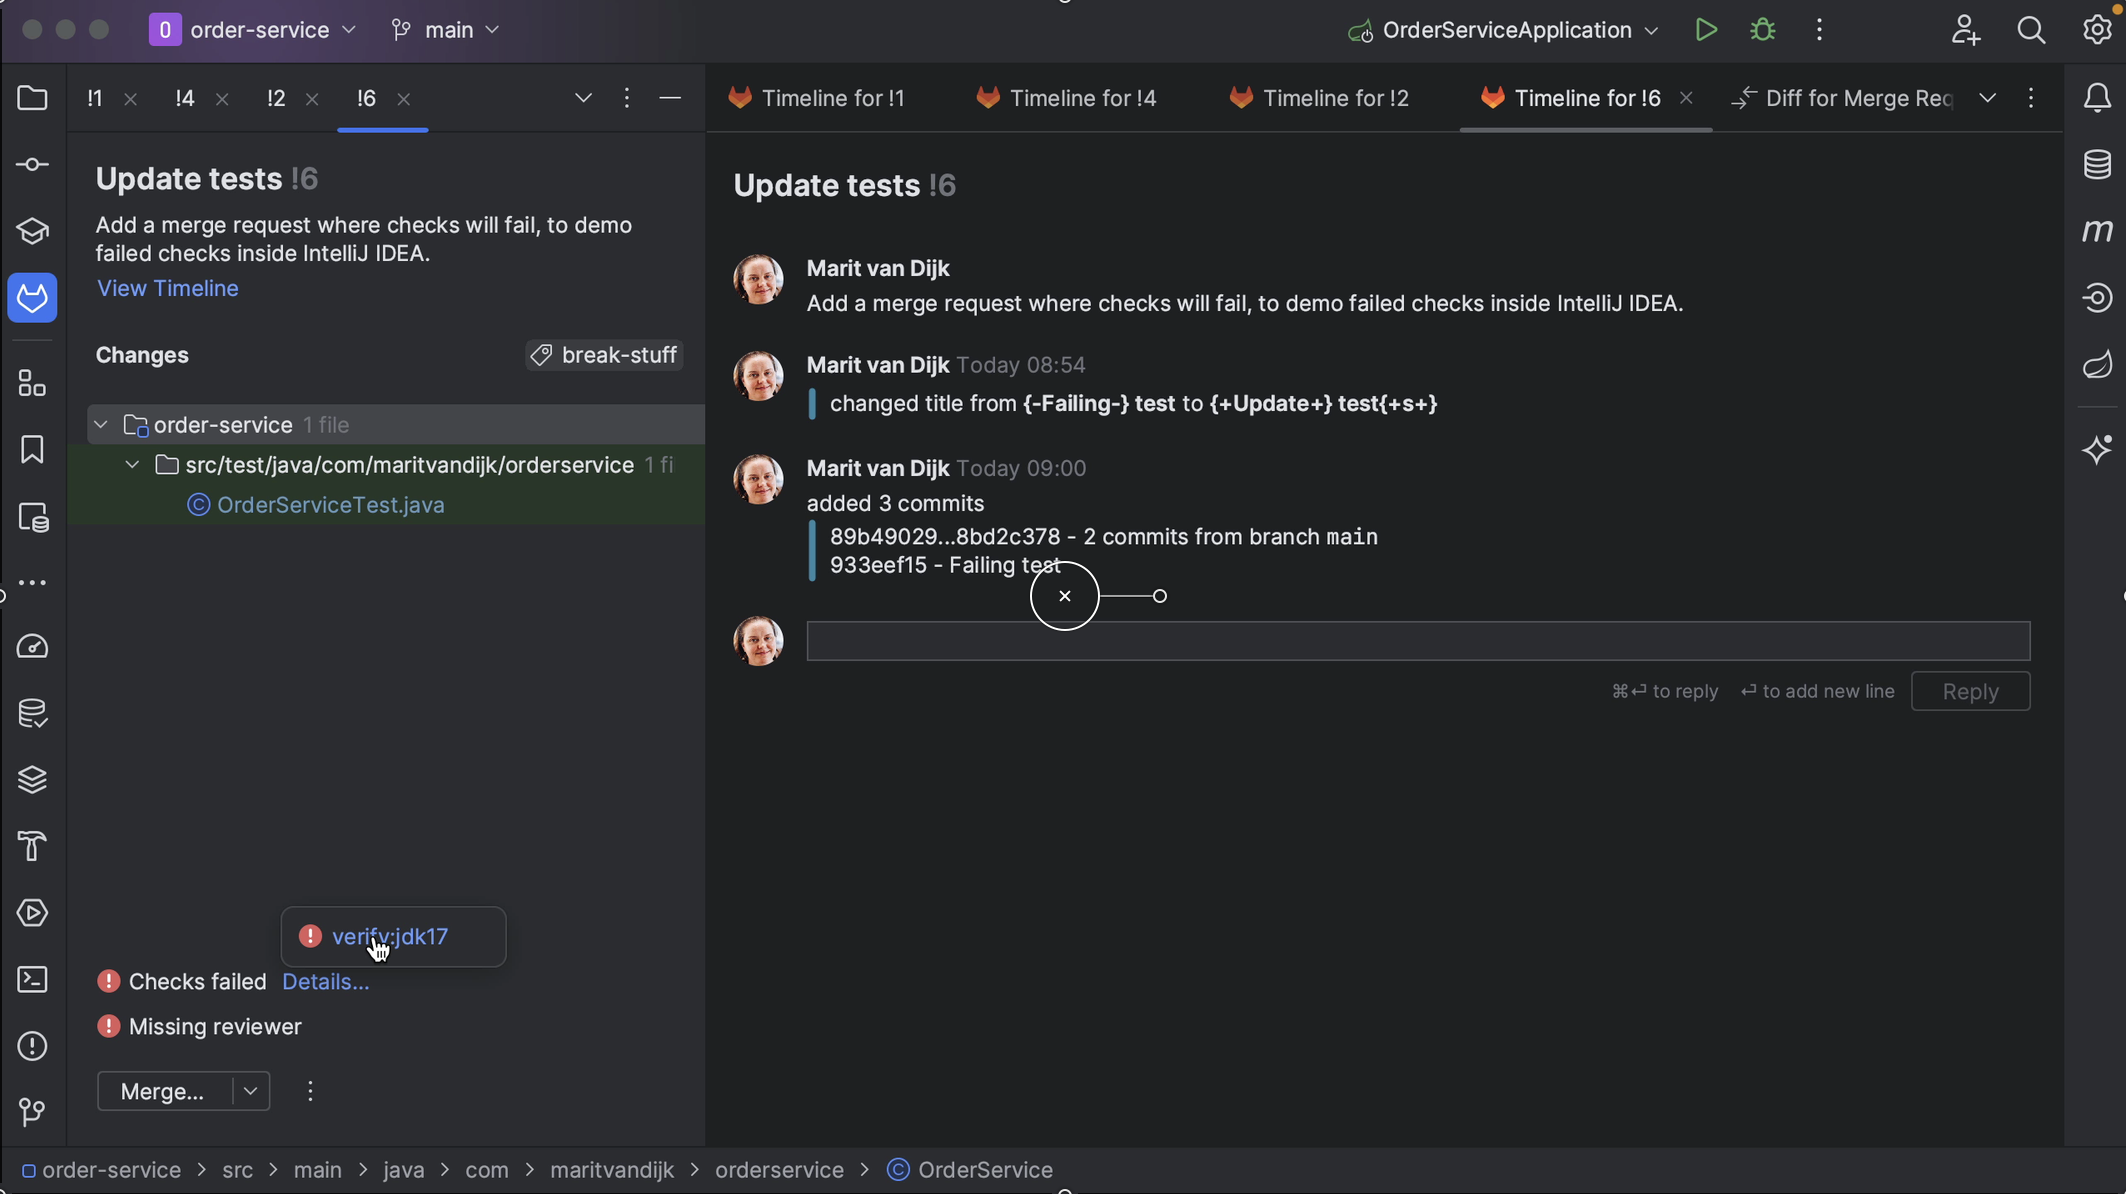
Checks failed

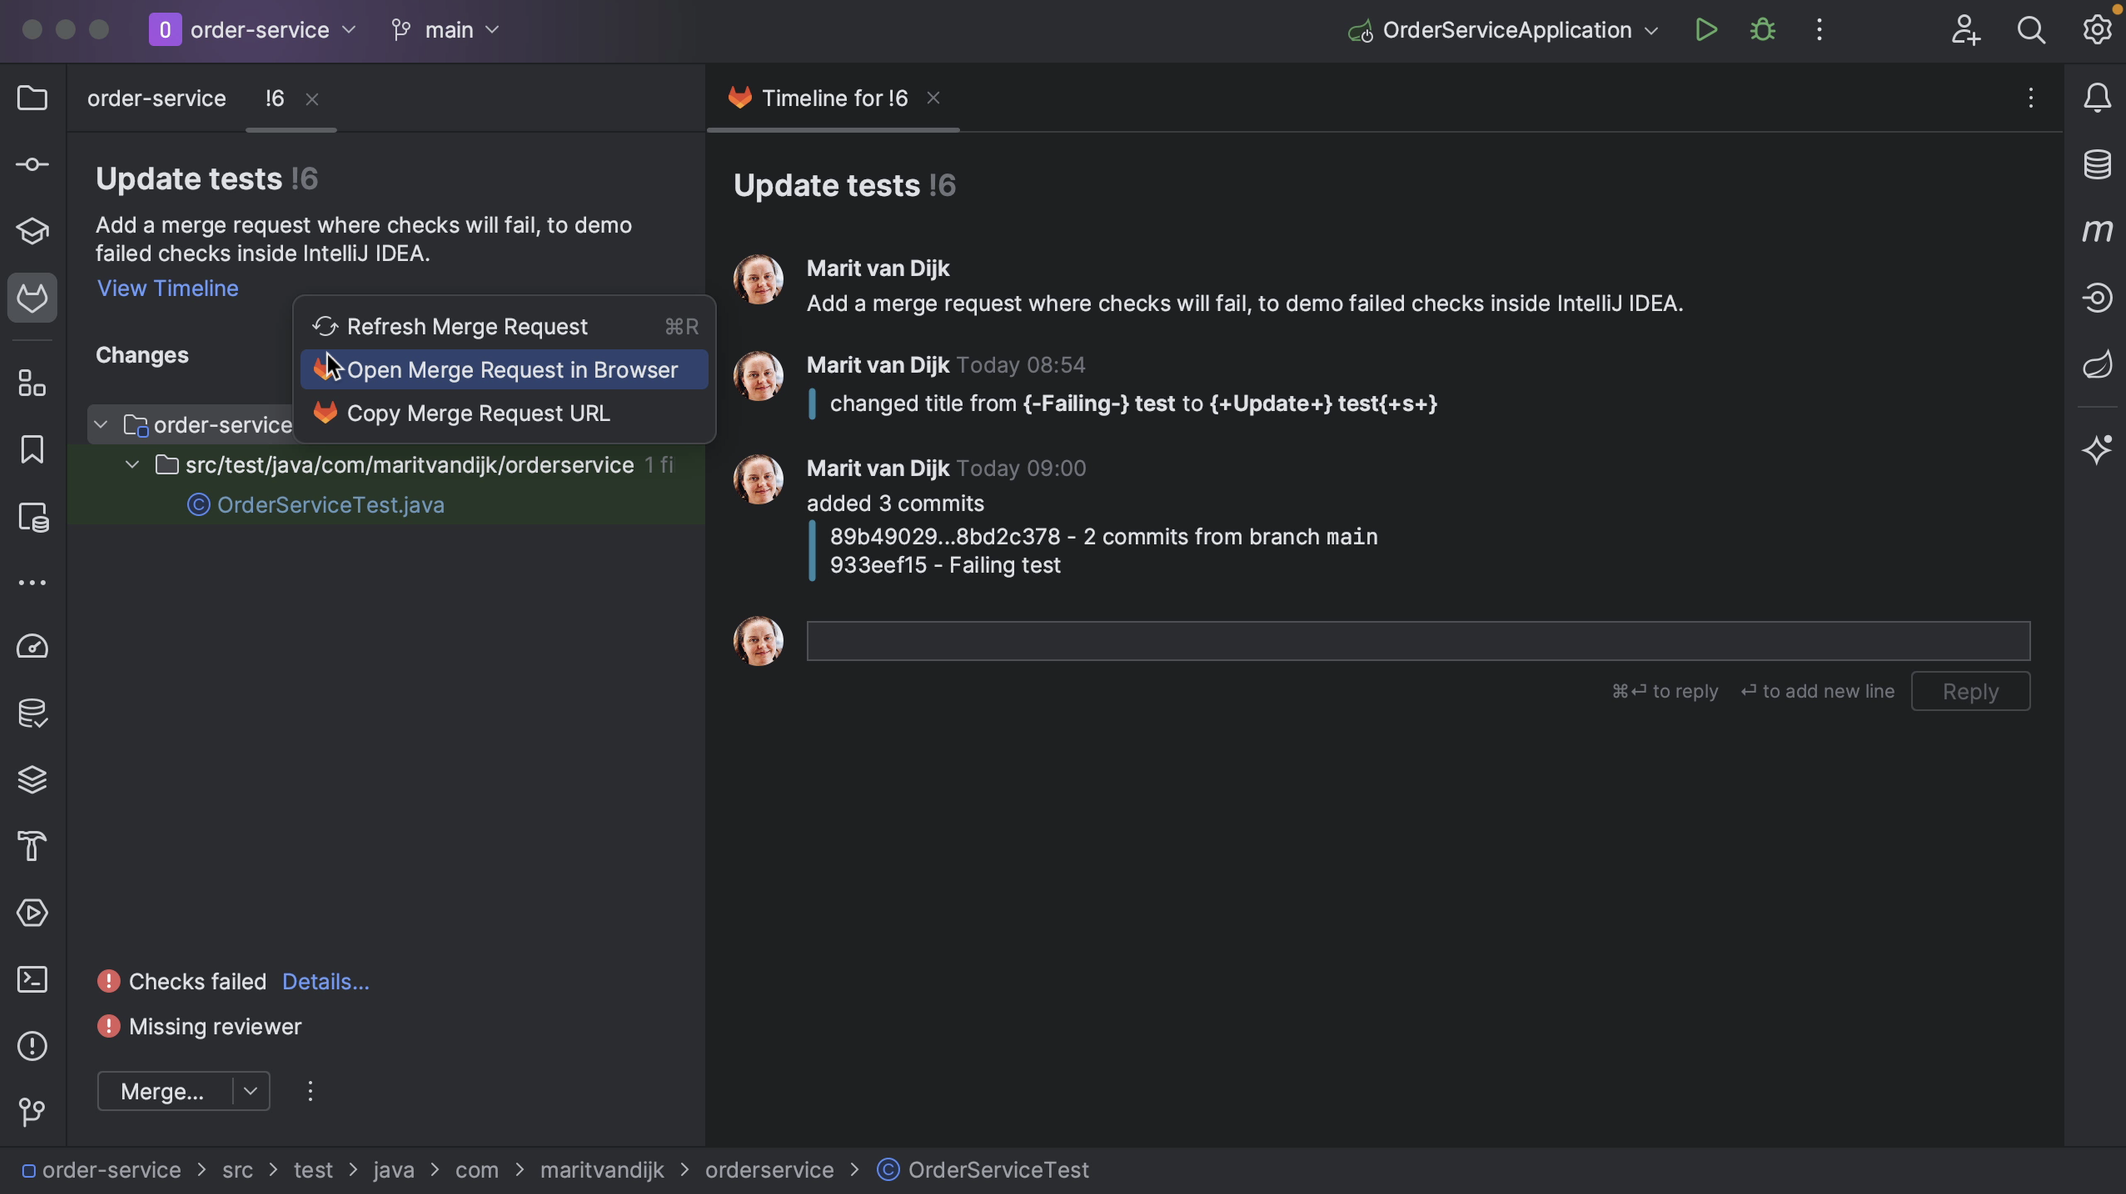
We can open the Merge Request in our browser in several ways. We can right-click the Merge Request number and select Open in Browser. Alternatively, we can open the Merge Request in our browser by right-clicking it, either when it’s already open, or in the list of Merge Requests and selecting Open Merge Request in Browser.
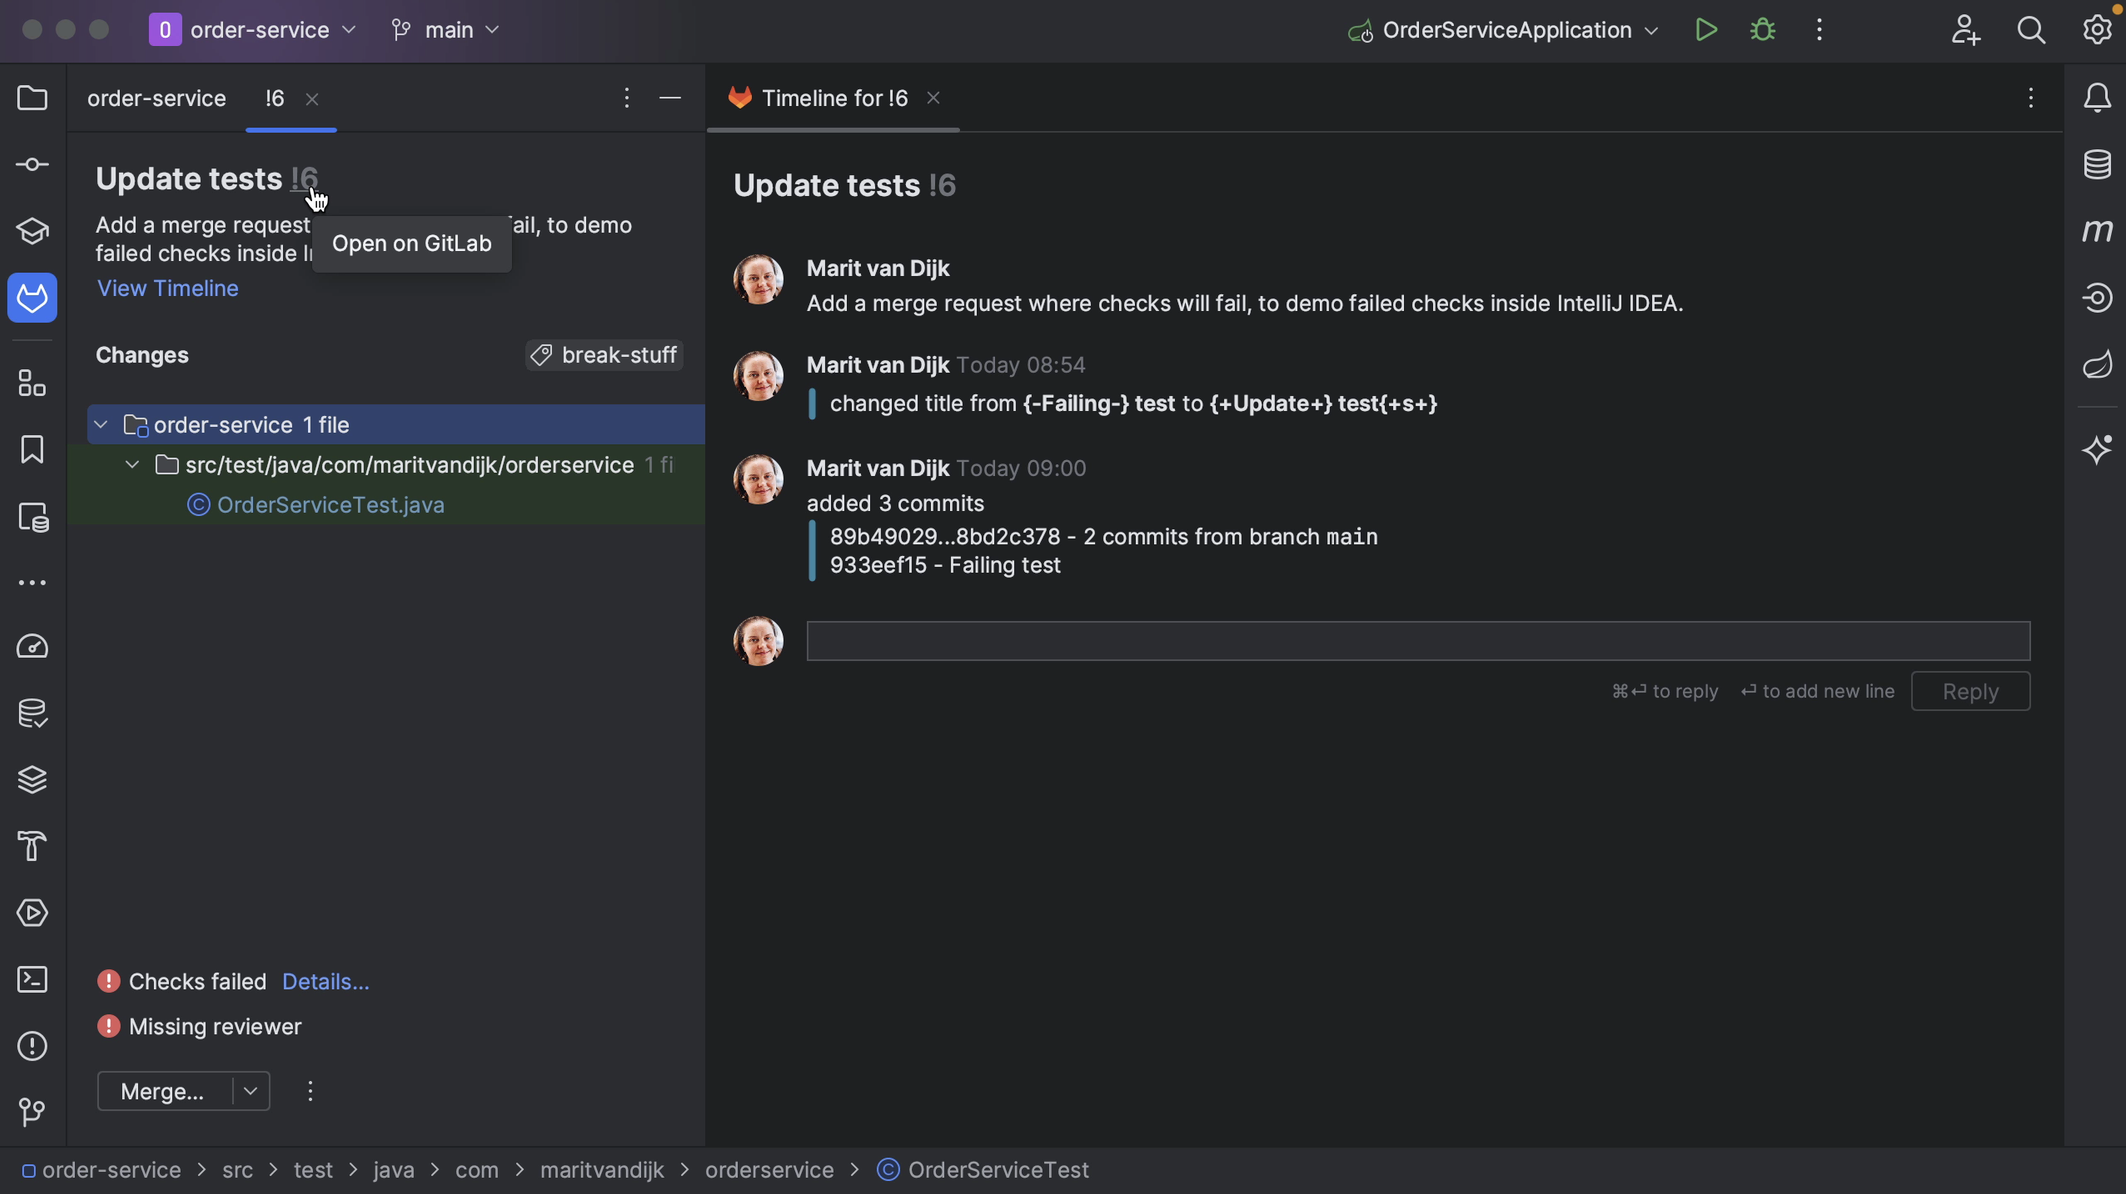
Open on GitLab
Open in browser

IntelliJ IDEA also shows if there are any conflicts, so we know if this request is safe to merge or not.
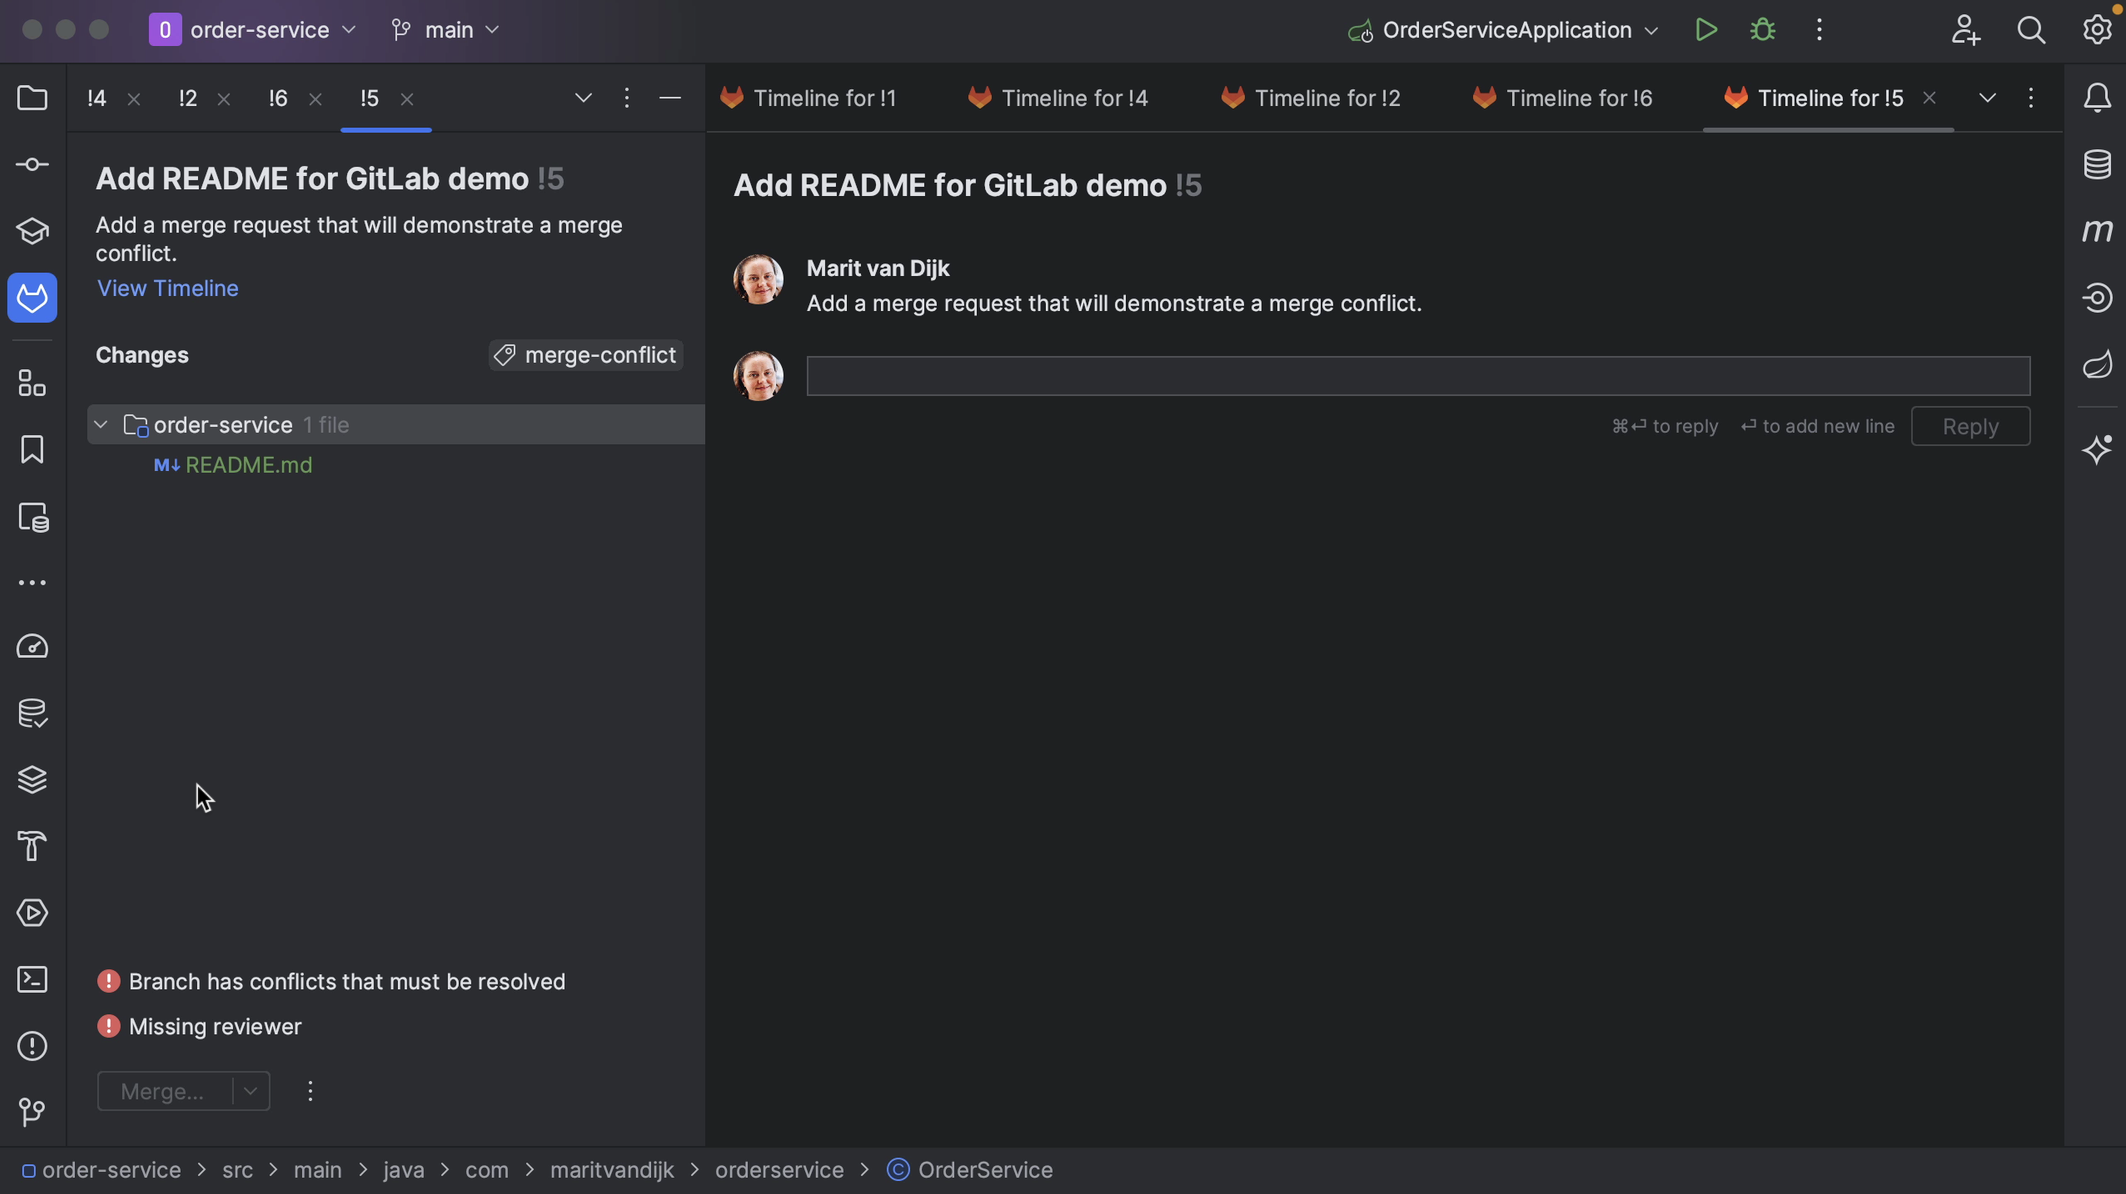
Conflicts

We can open any of the files that make up the Merge Request, and IntelliJ IDEA will show them in the diff viewer, so we can have a closer look at the changes that make up the Merge Request. Inline comments will be displayed in the diff view too. Alternatively, we can open the diff view by selecting the file and using the shortcut for Show Diff (⌘D on macOS | Ctrl+D on Windows/Linux).
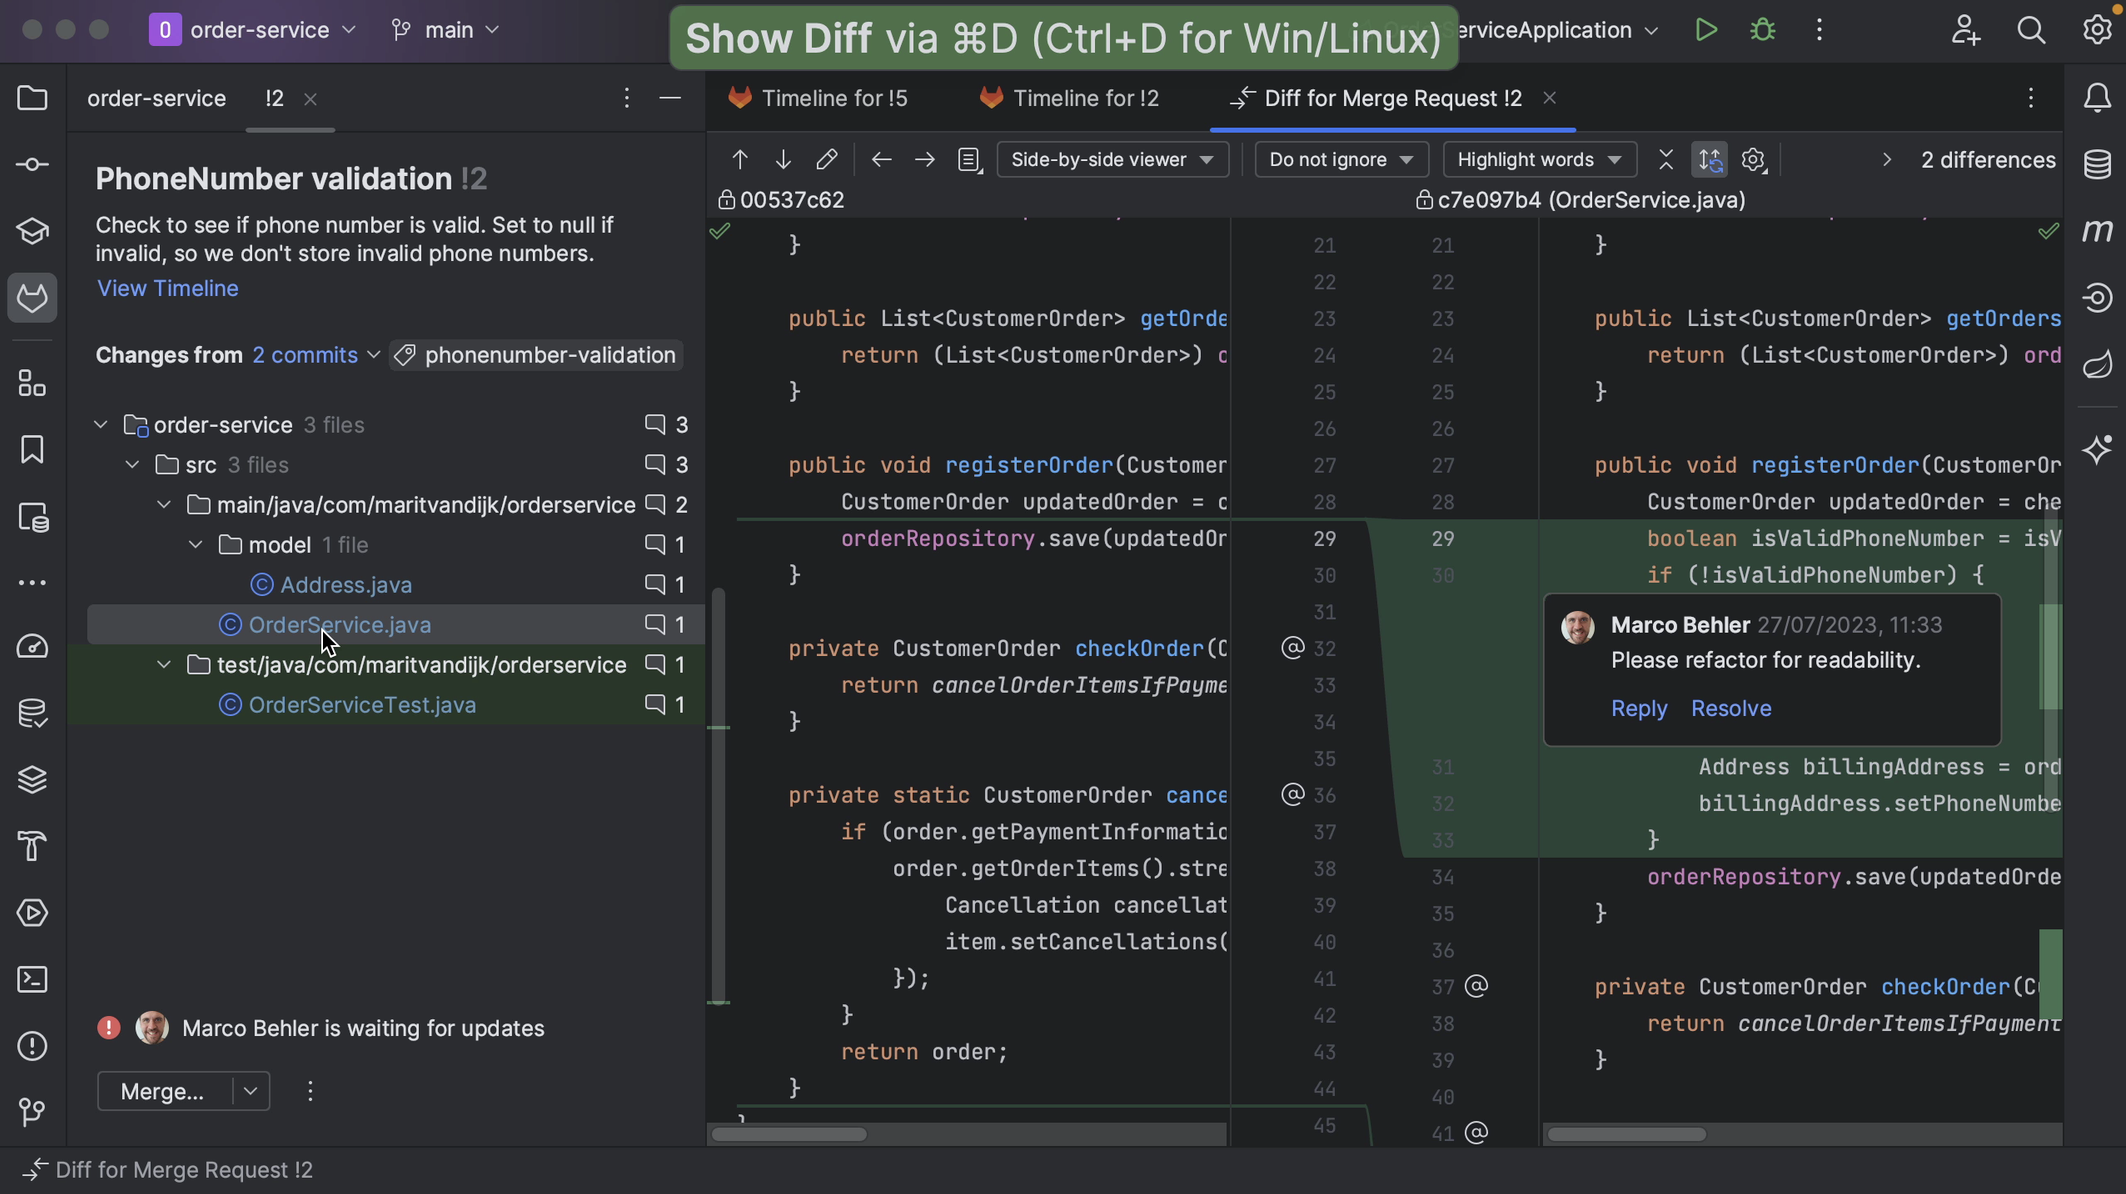
Show diff

If the Merge Request contains changes to multiple files, we can navigate between those files. We can do so using the arrows at the top of the diff viewer, or using the shortcuts to Compare Next File (⌃⇧→ on macOS | Alt+→ on Windows/Linux) or Compare Previous File (⌃⇧← on macOS |Alt+← on Windows/Linux).

Navigate between files

If the Merge Request consists of multiple commits, we can see the individual commits in the Changes from dropdown list. We can look at the changes for an individual commit if we want.
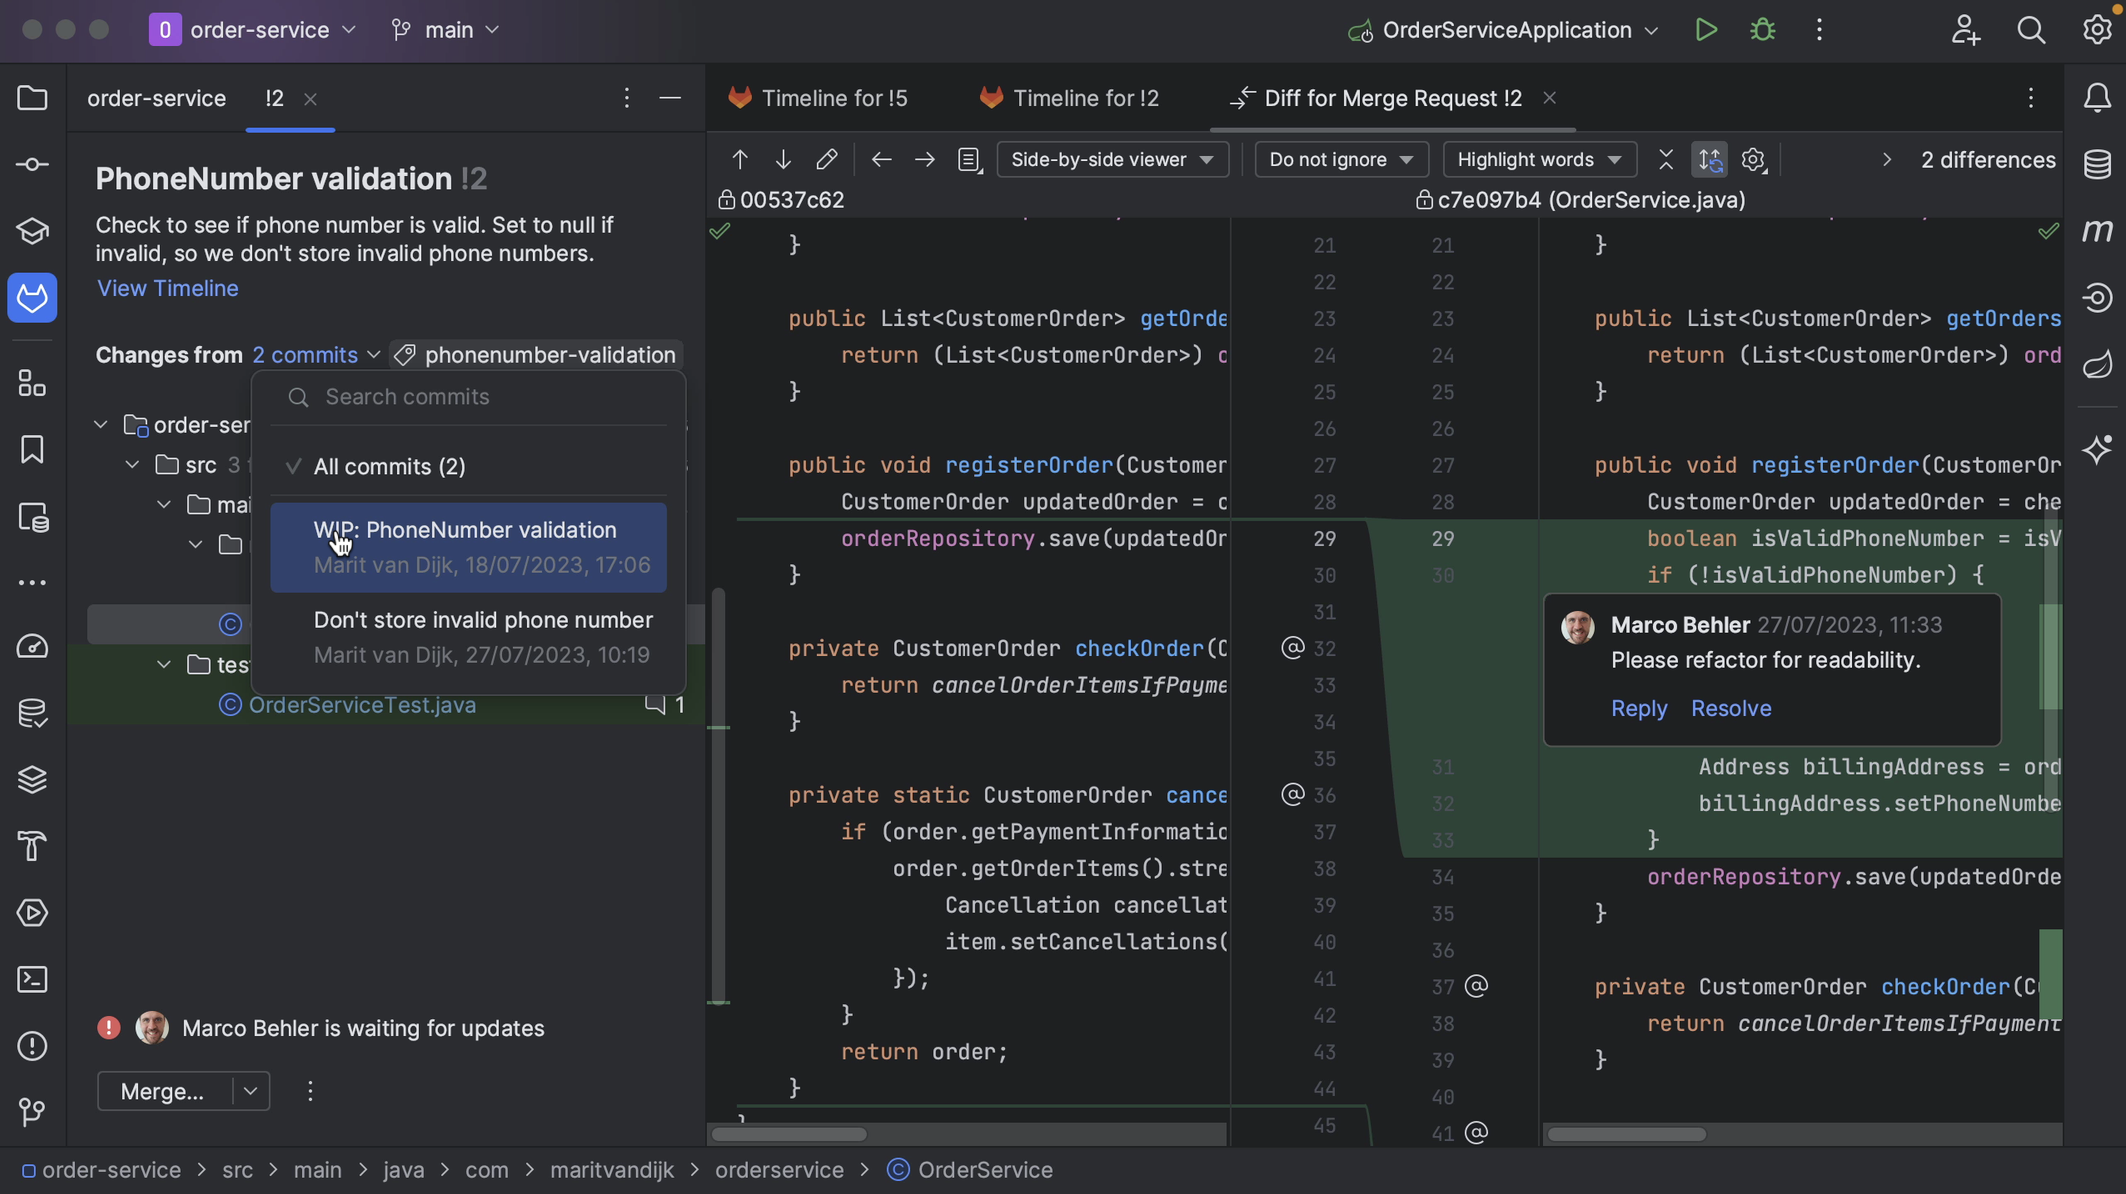
Multiple commits

We can also see the number of comments for the Merge Request, and for each file.

We can Hide All Windows (⇧⌘F12 on macOS | Ctrl+Shift+F12 on Windows/Linux) to focus on the diff. We can Restore Windows using the same shortcut.

Alternatively, we can reopen the Merge Requests window by opening the Recent Files dialog (⌘ E on macOS | Ctrl+E on Windows/Linux), which also lets us open up any of the Tool Windows. Here we can search for “merge” to find the Merge Request tool window.
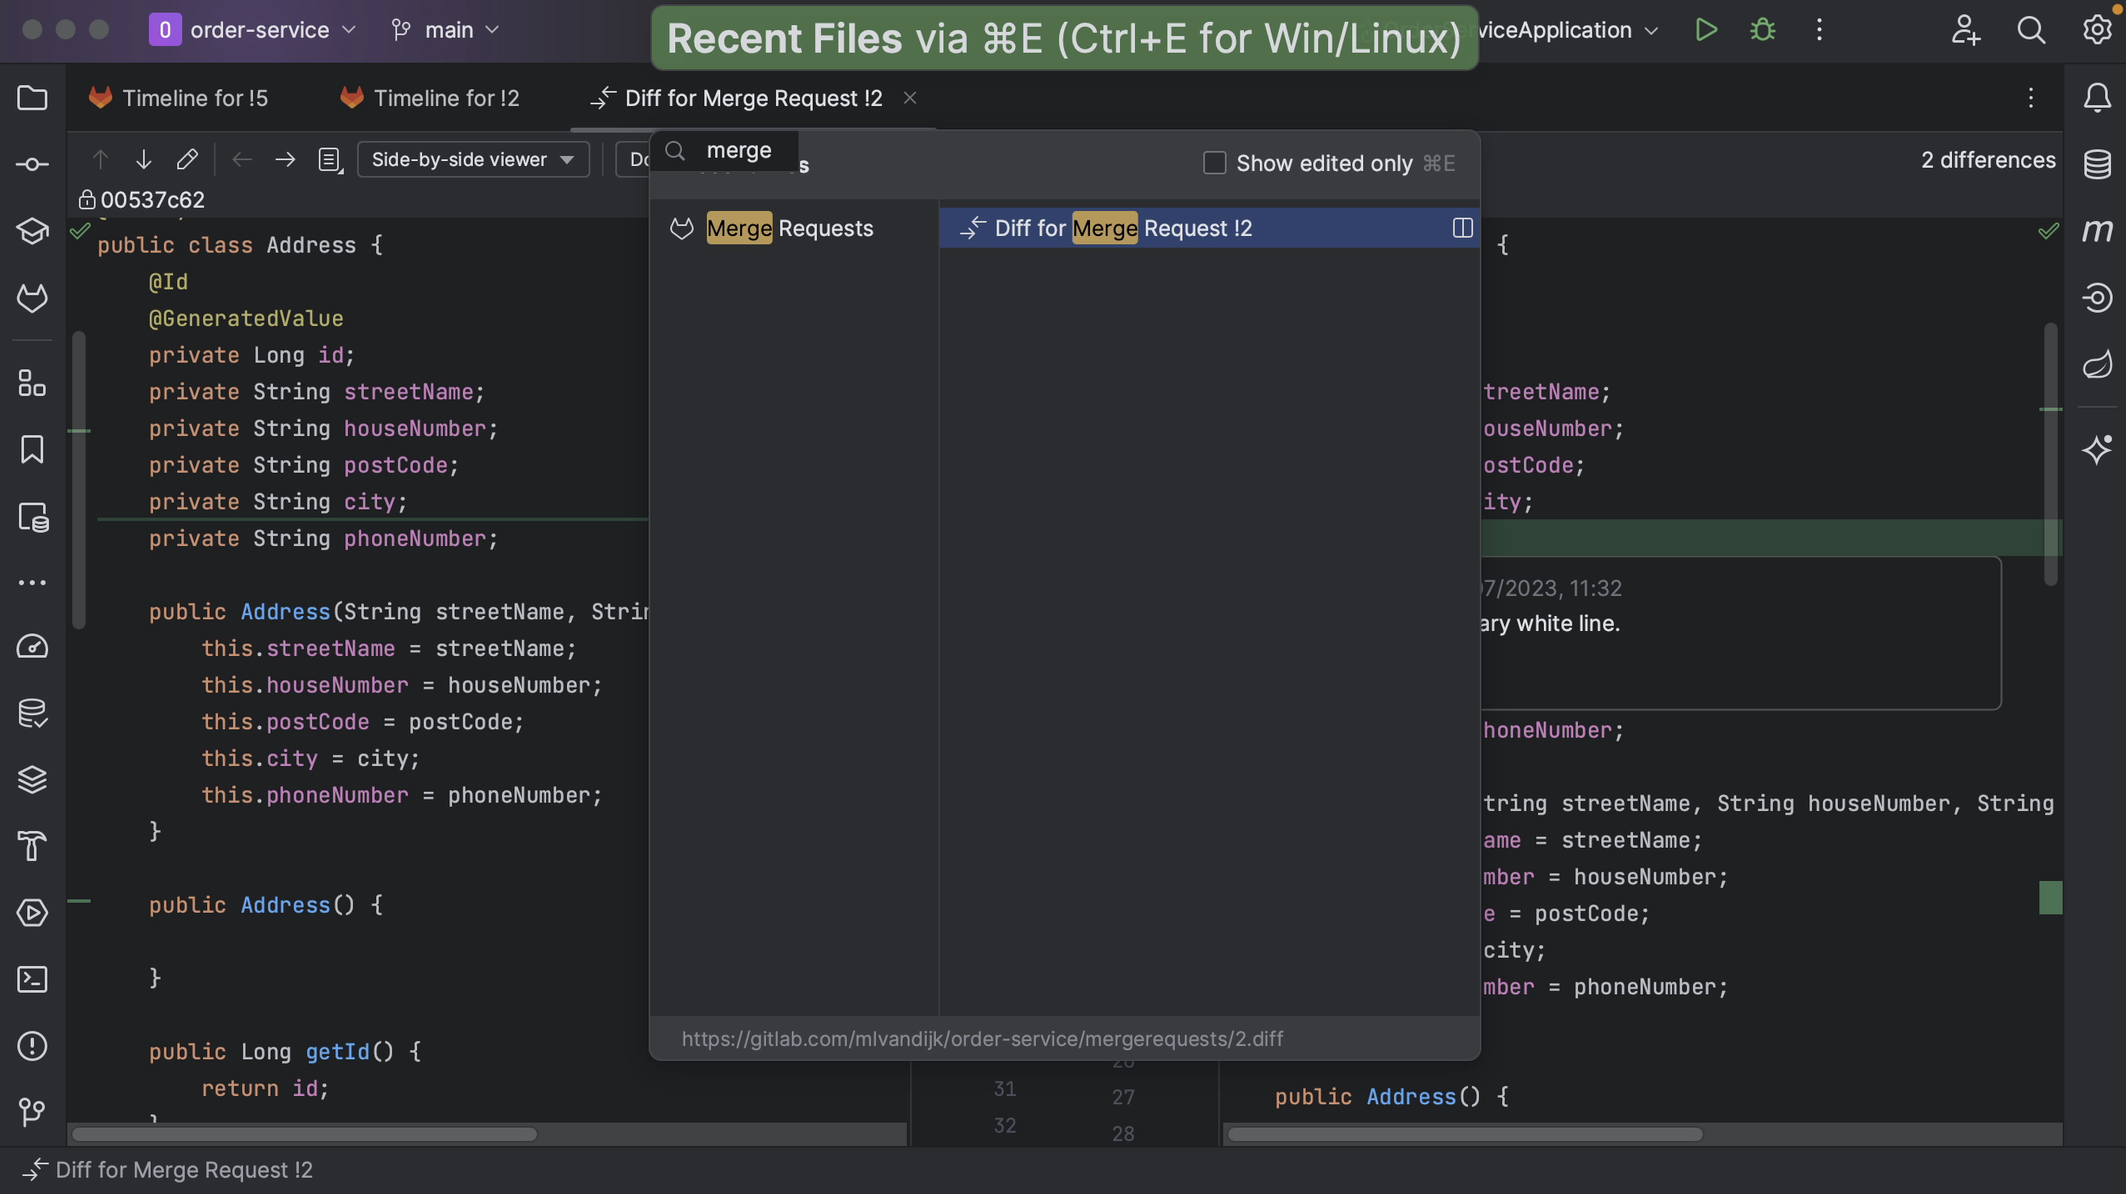
Recent files

Adding comments from GitLab and IntelliJ IDEA

Let’s look at comments on our Merge Request.

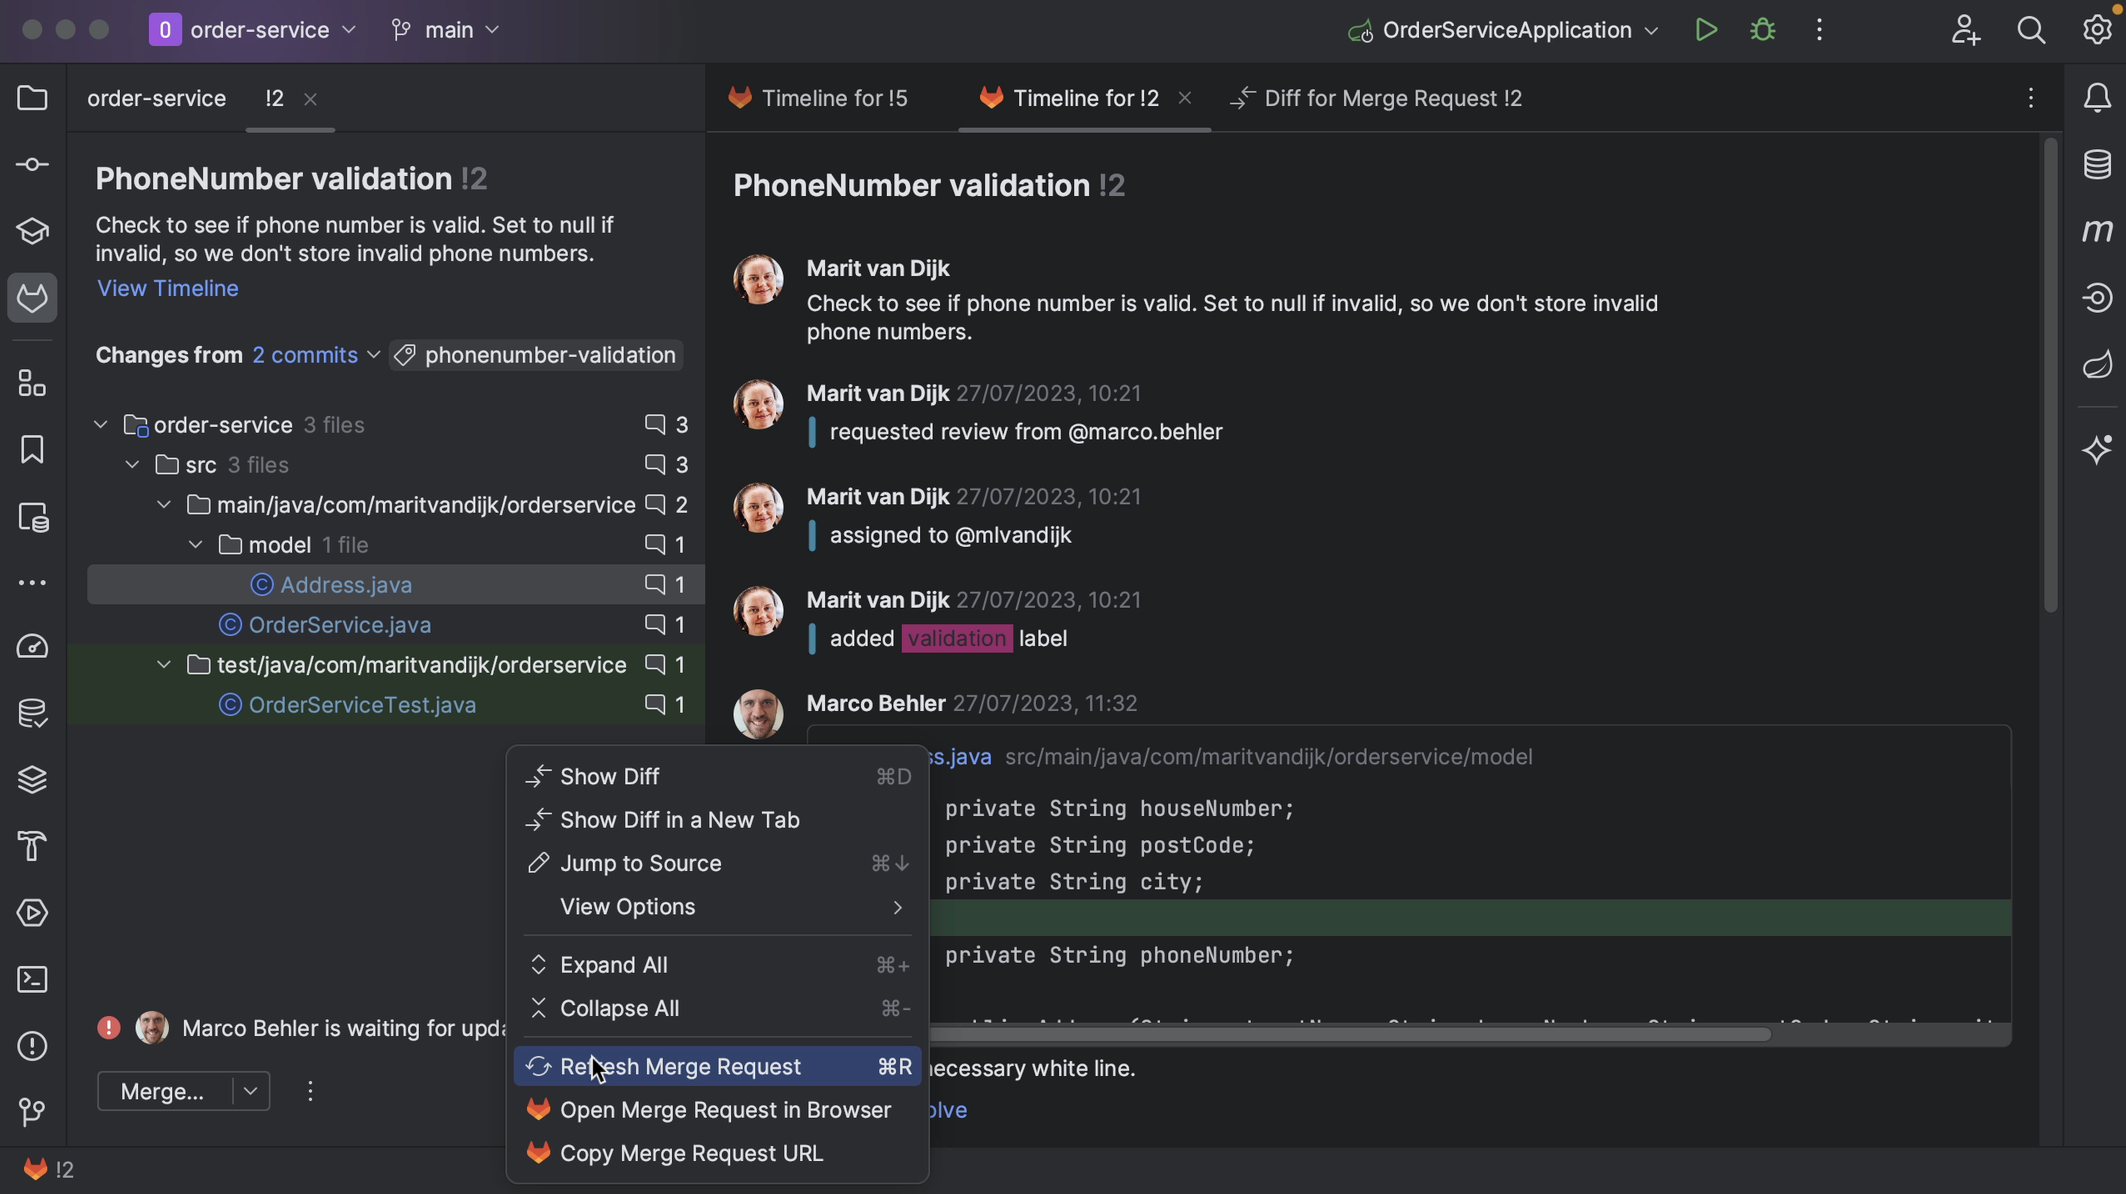
We can add comments to the GitLab conversation. Comments on this page are comments that apply to the Merge Request as a whole, and not a specific piece of code. We can see these comments inside IntelliJ IDEA too. We might need to refresh our Merge Request window, either using the shortcut to Refresh Reviews (⌘R on macOS | Ctrl+F5 on Windows/Linux) or by right-clicking the Merge Request window and selecting Refresh Merge Request.
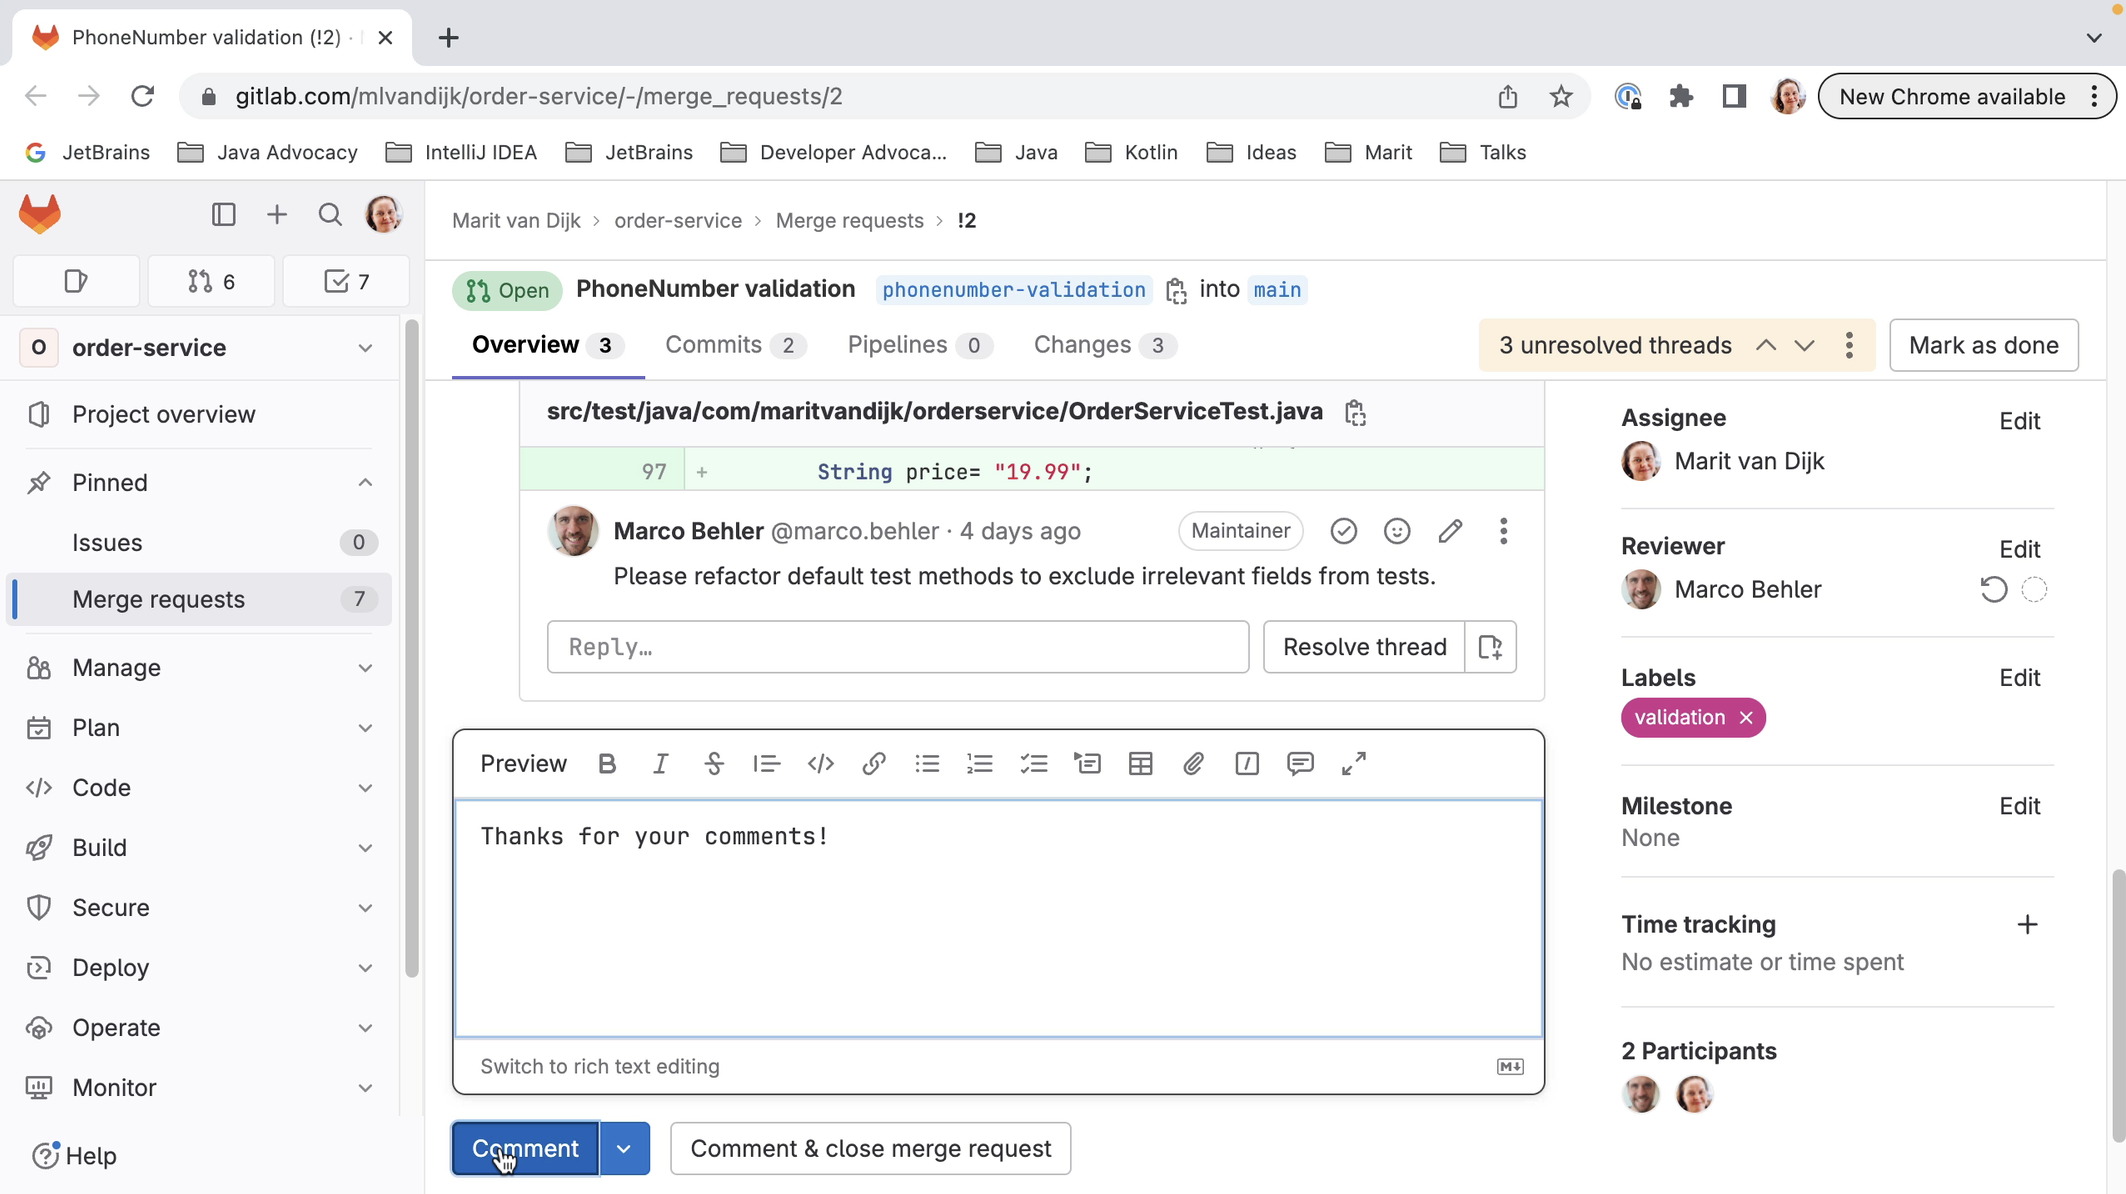
Comment from GitLab
Refresh reviews

We can also add comments from inside IntelliJ IDEA. We can place high-level comments, like the comment we just placed from GitLab.
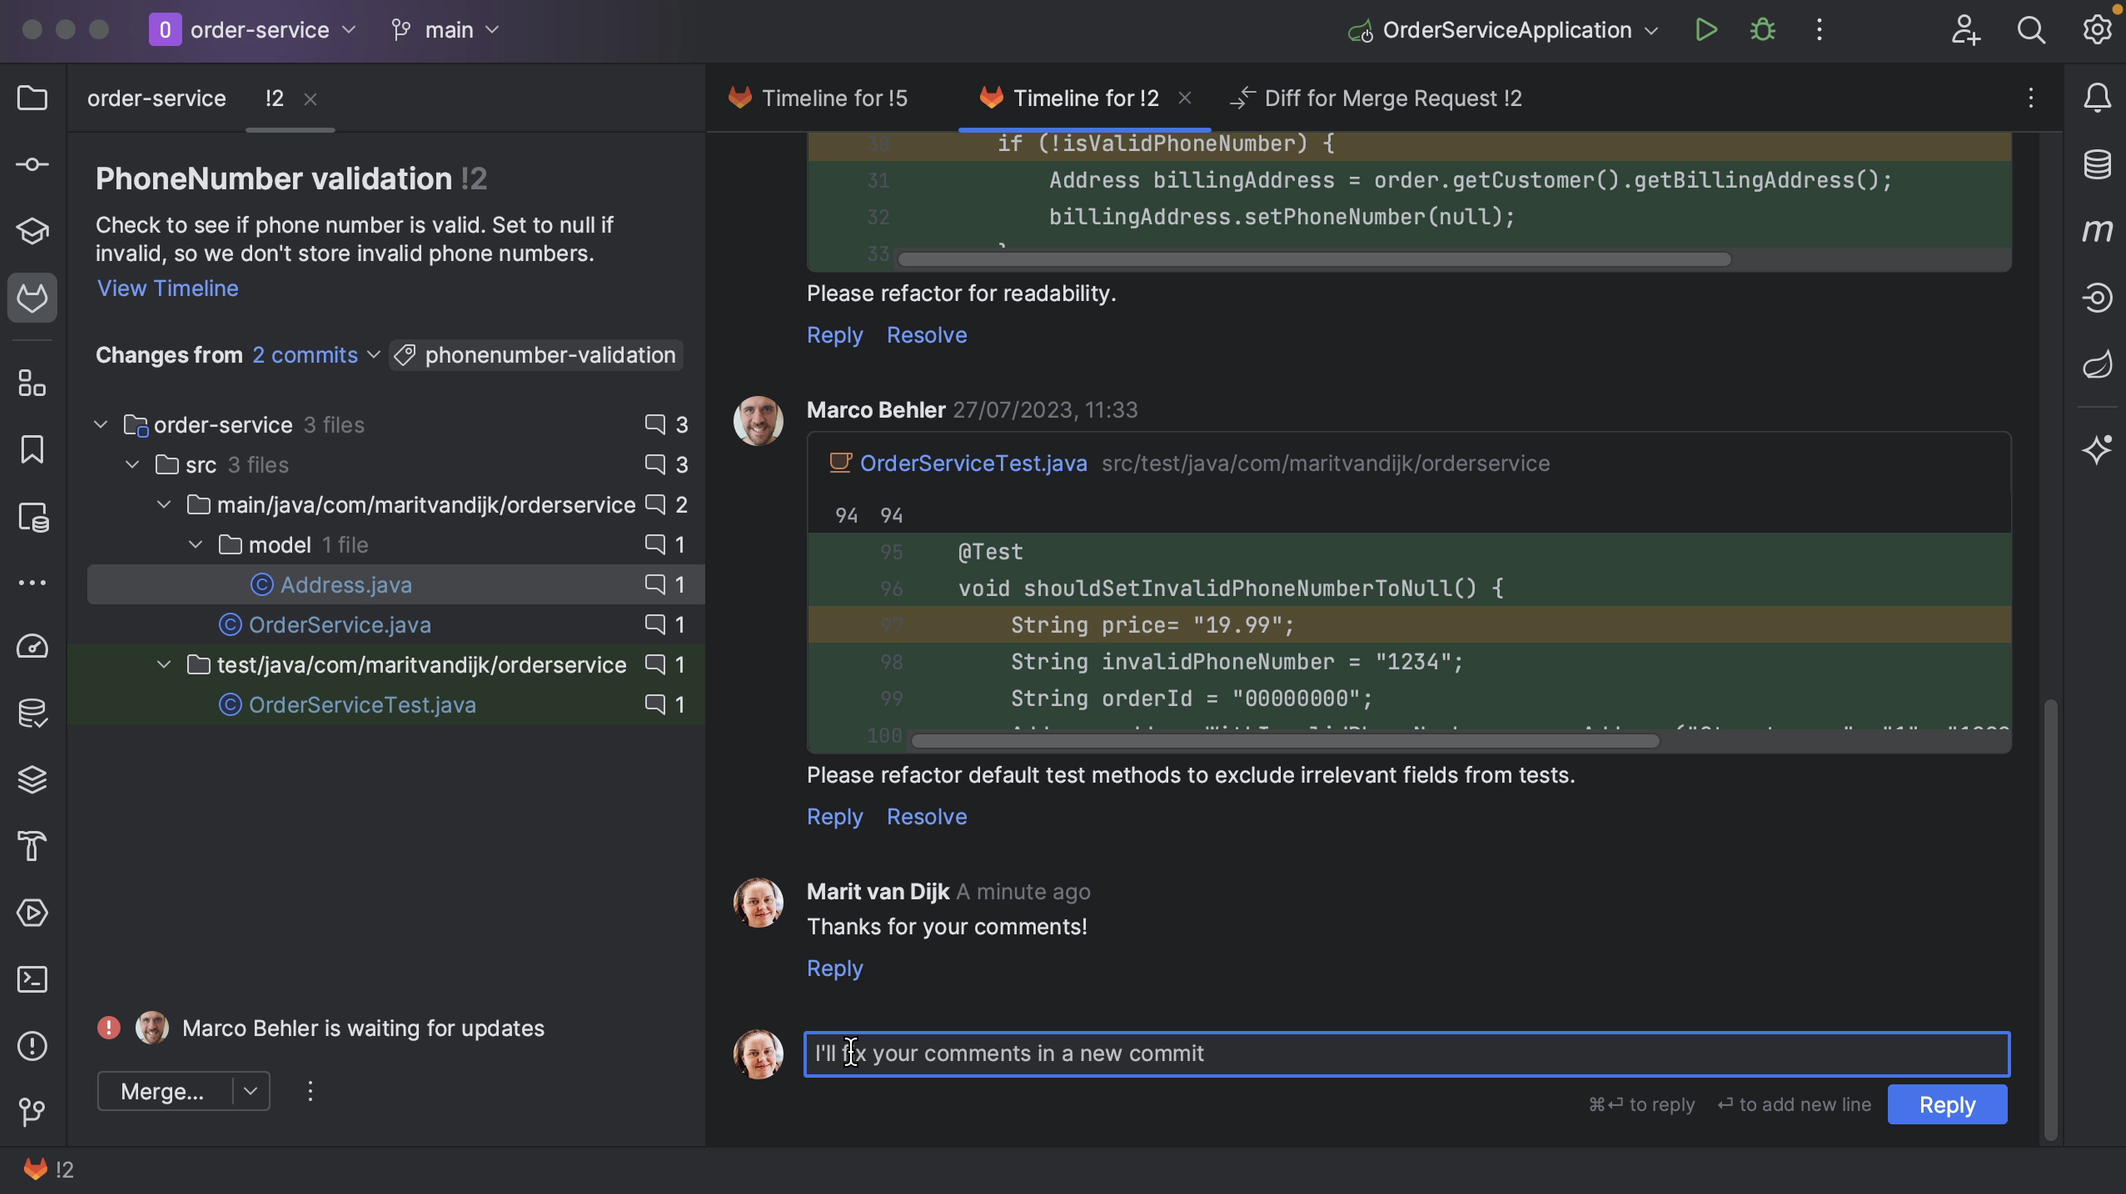
Comment from IntelliJ IDEA

We might also want to add comments on particular parts of the code. We can do so from inside IntelliJ IDEA by clicking on the plus in the gutter of the diff viewer. For example, let’s add a comment to the current Merge Request.
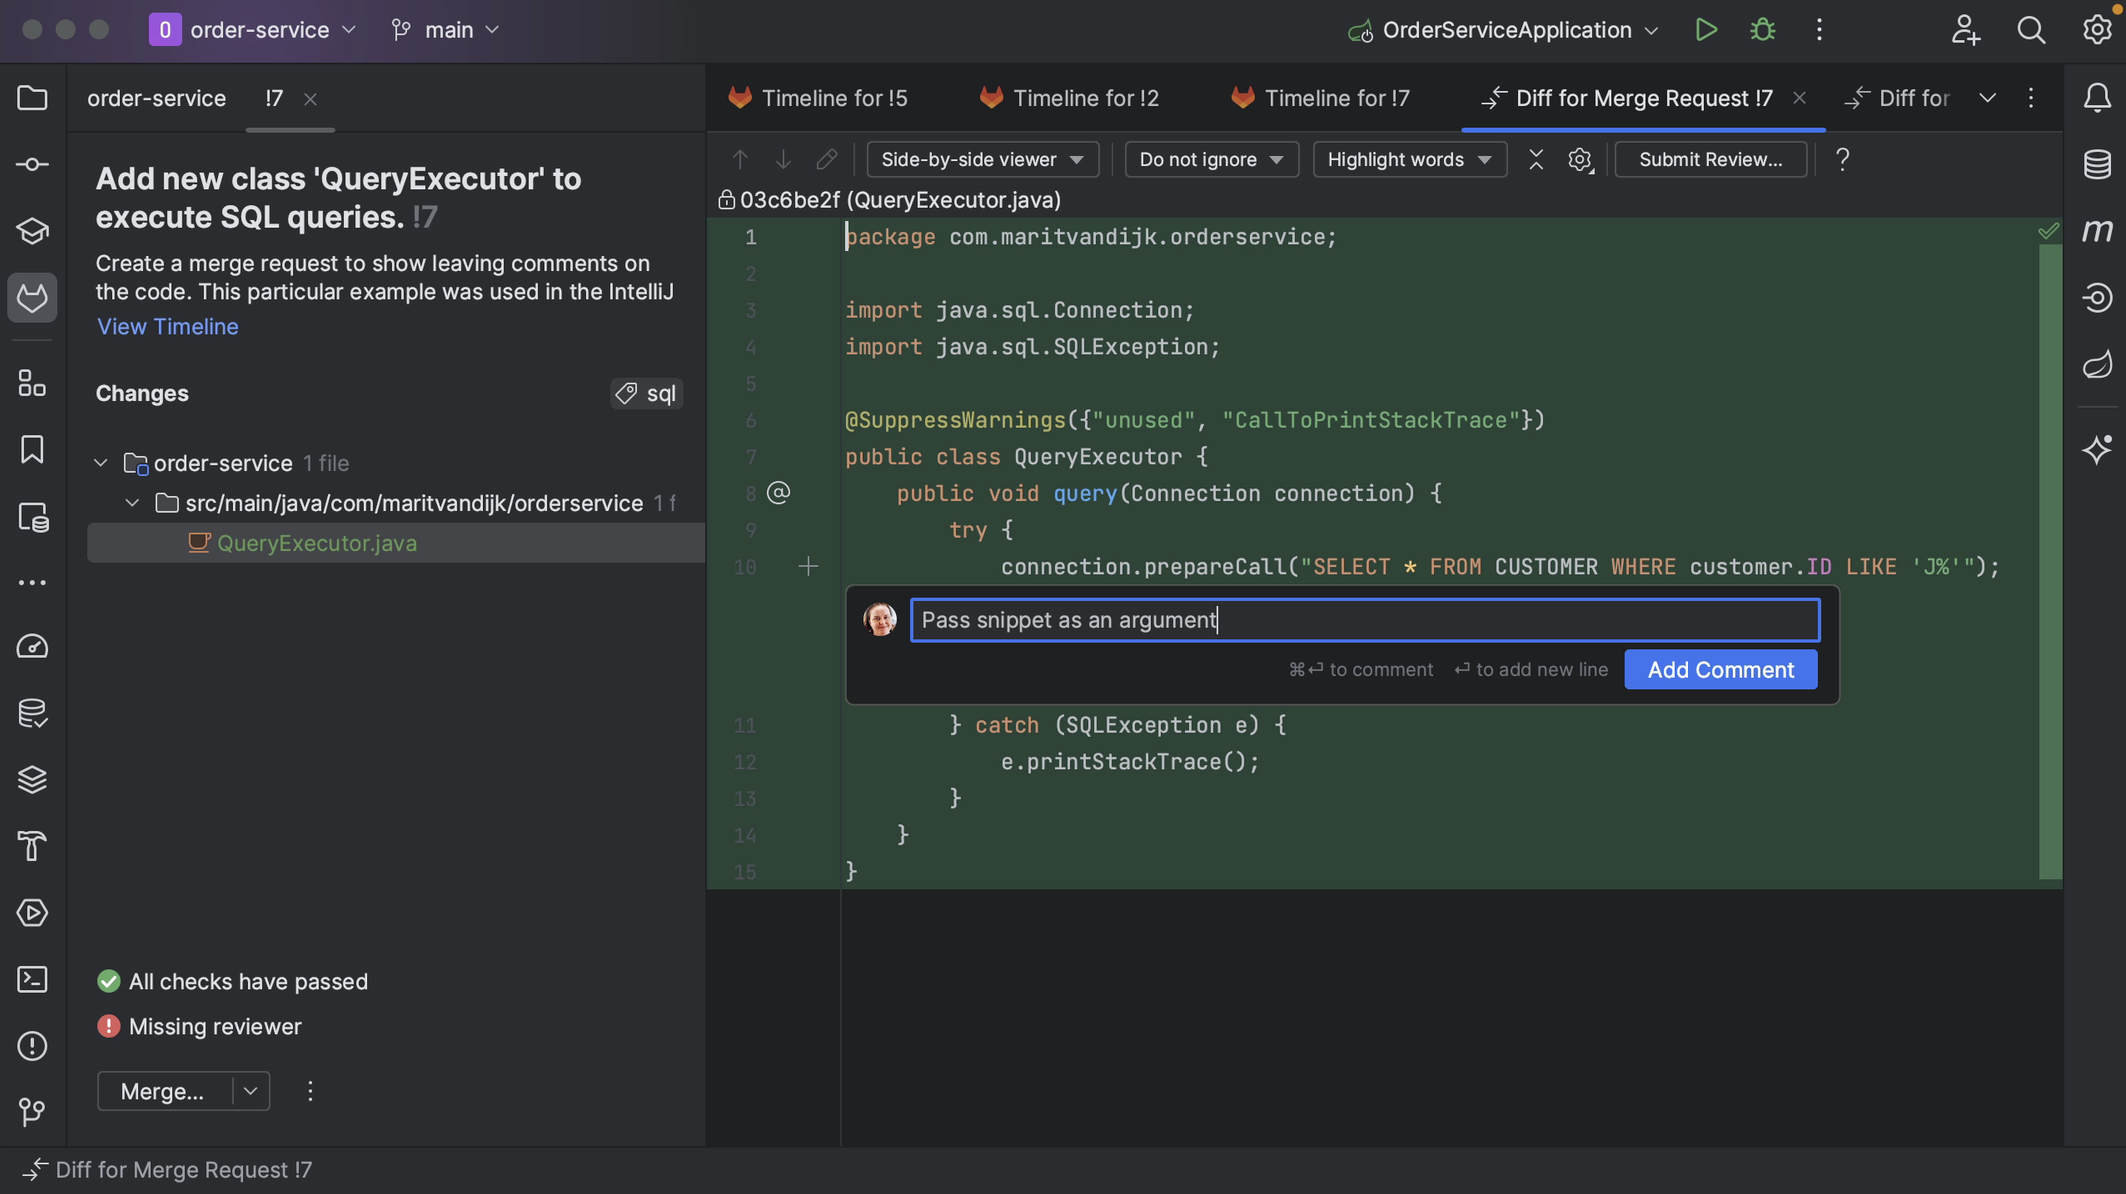
Inline comment

We can edit or delete comments. We can also reply to comments or resolve a comment that is no longer relevant, for example, if the code has been updated in line with the comment.
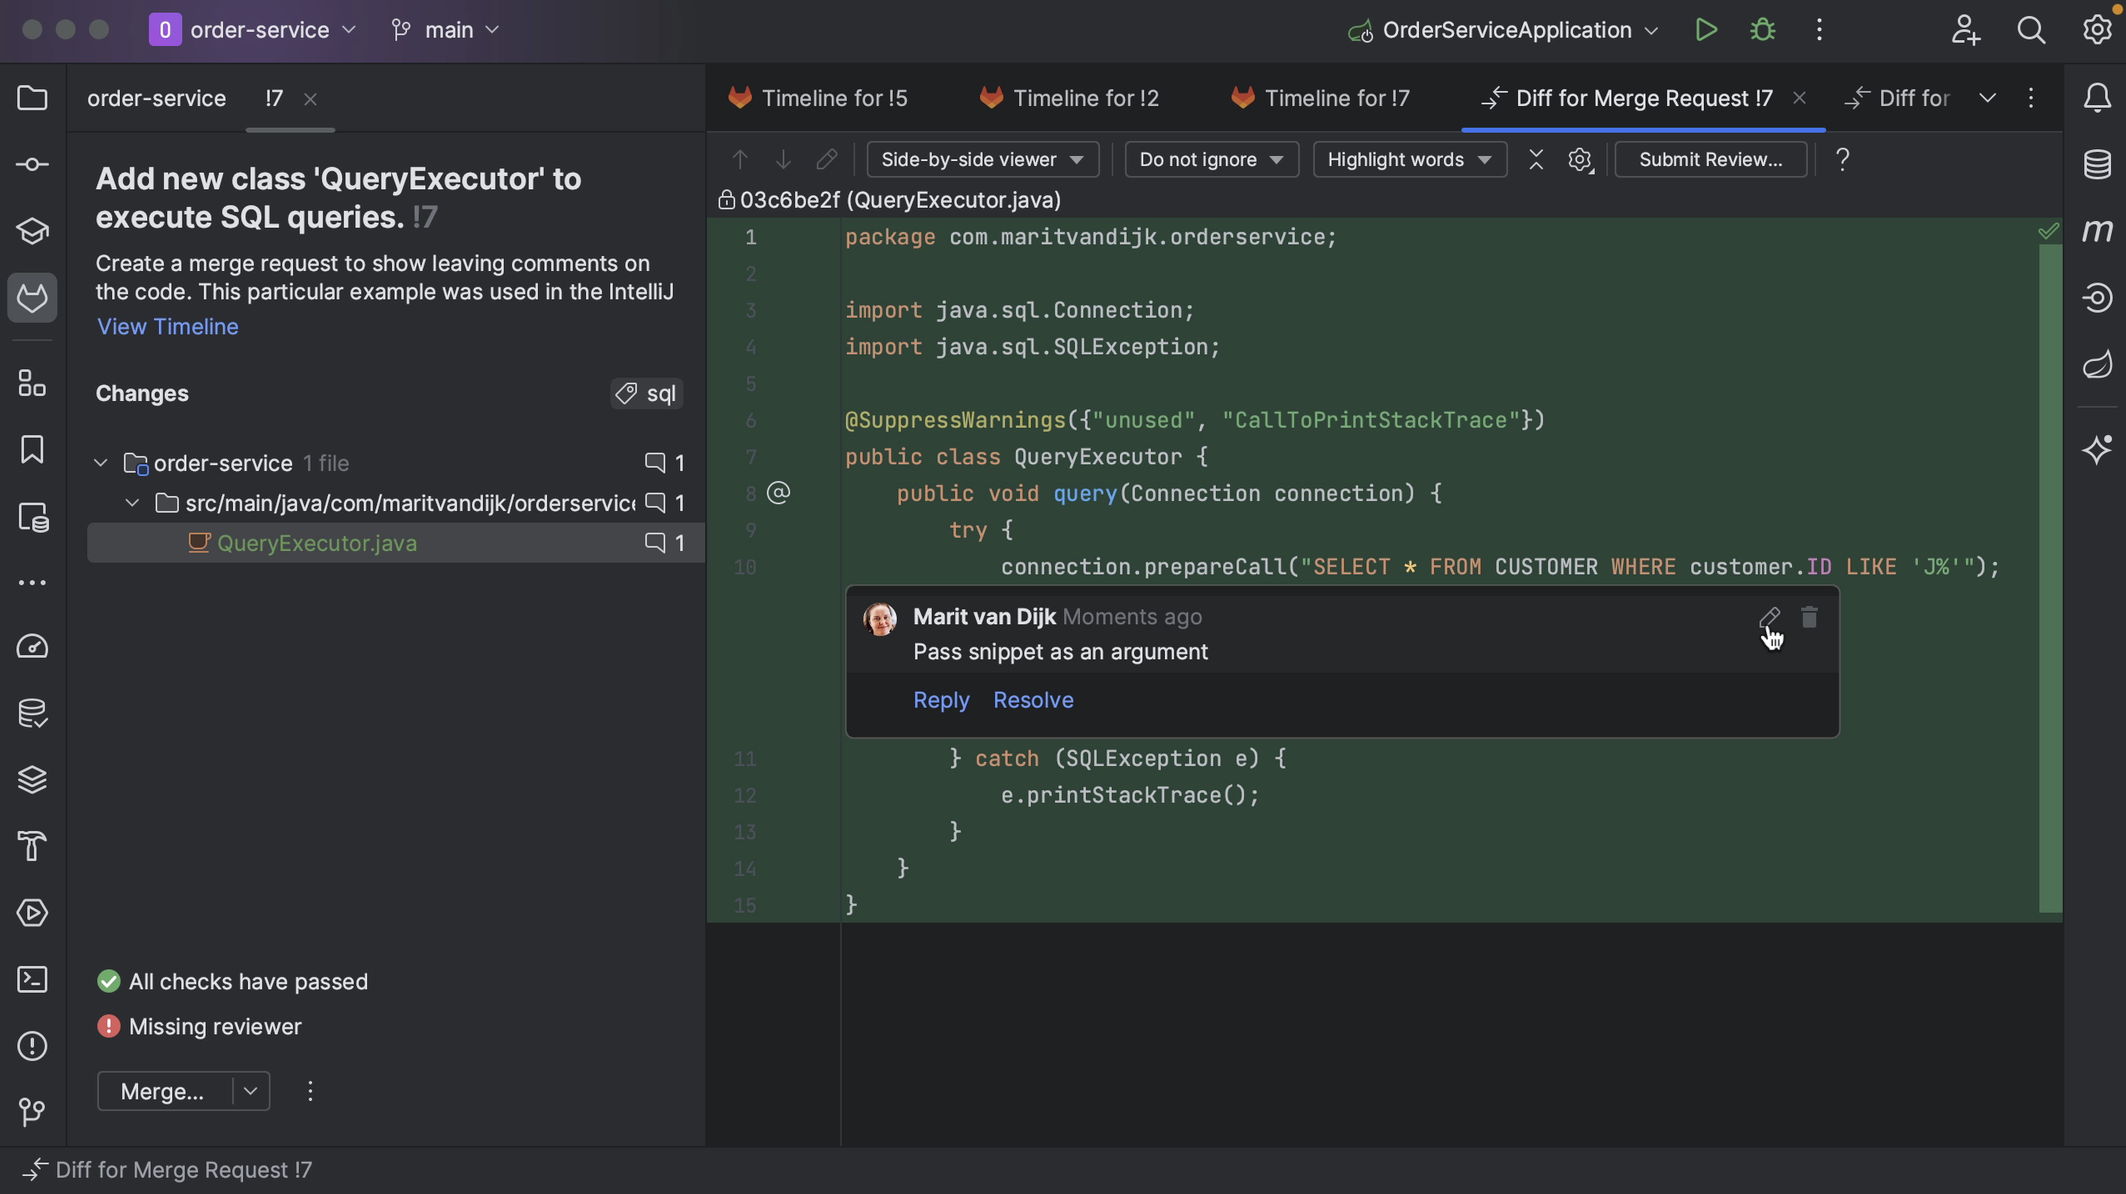
Working with comments

From the diff viewer, we can submit our review and approve the Merge Request if we think it’s ready to be merged.
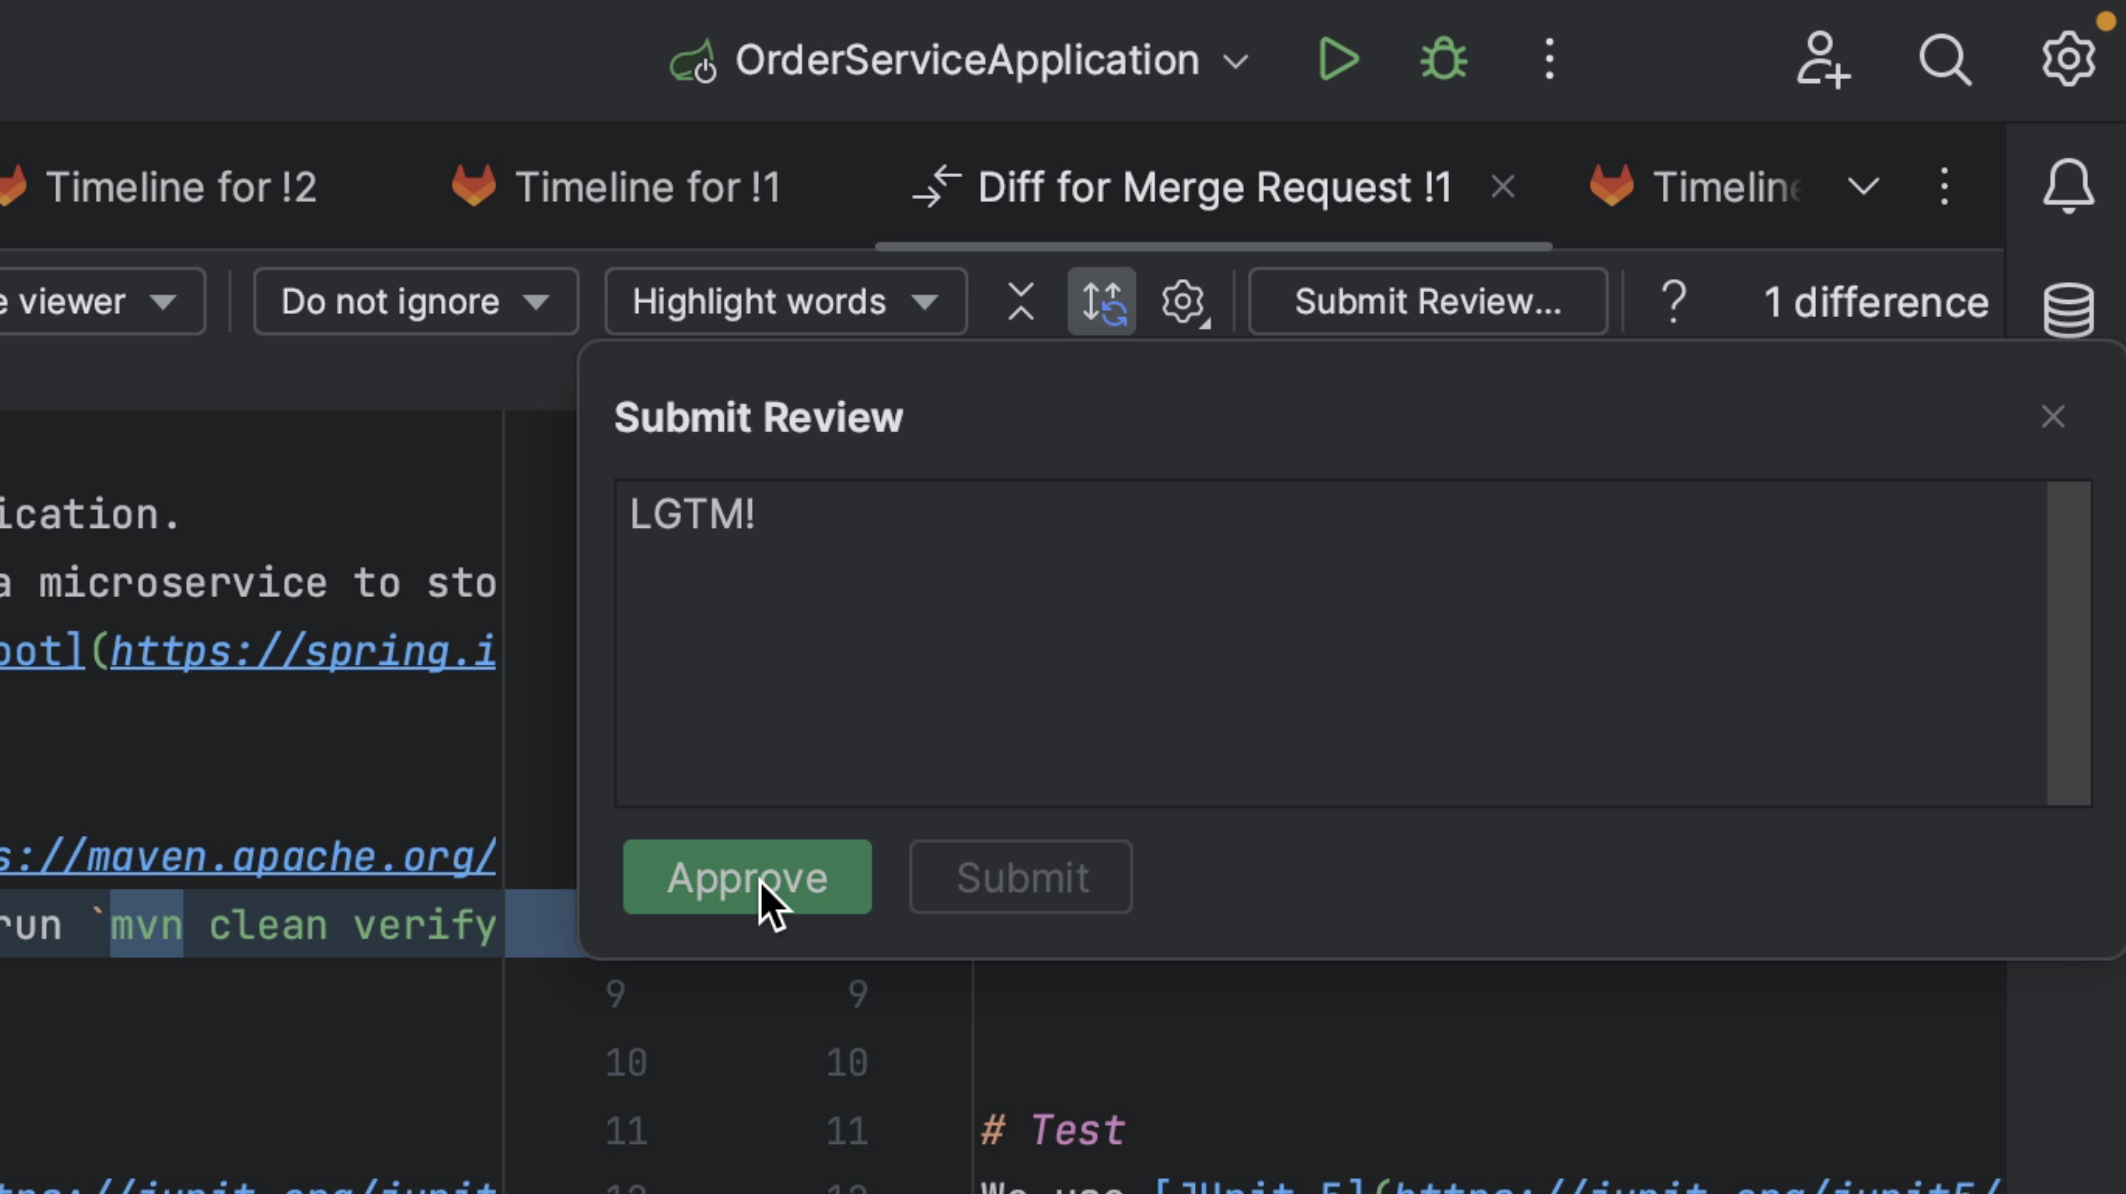
Submit Review and Approve

Reviewing GitLab Merge Requests inside IntelliJ IDEA

One feature that’s really helpful when we’re reviewing a Merge Request is that we can check out the code that is in the Merge Request. In this project, I’m currently on the main branch. Let’s check out the branch for this Merge Request.
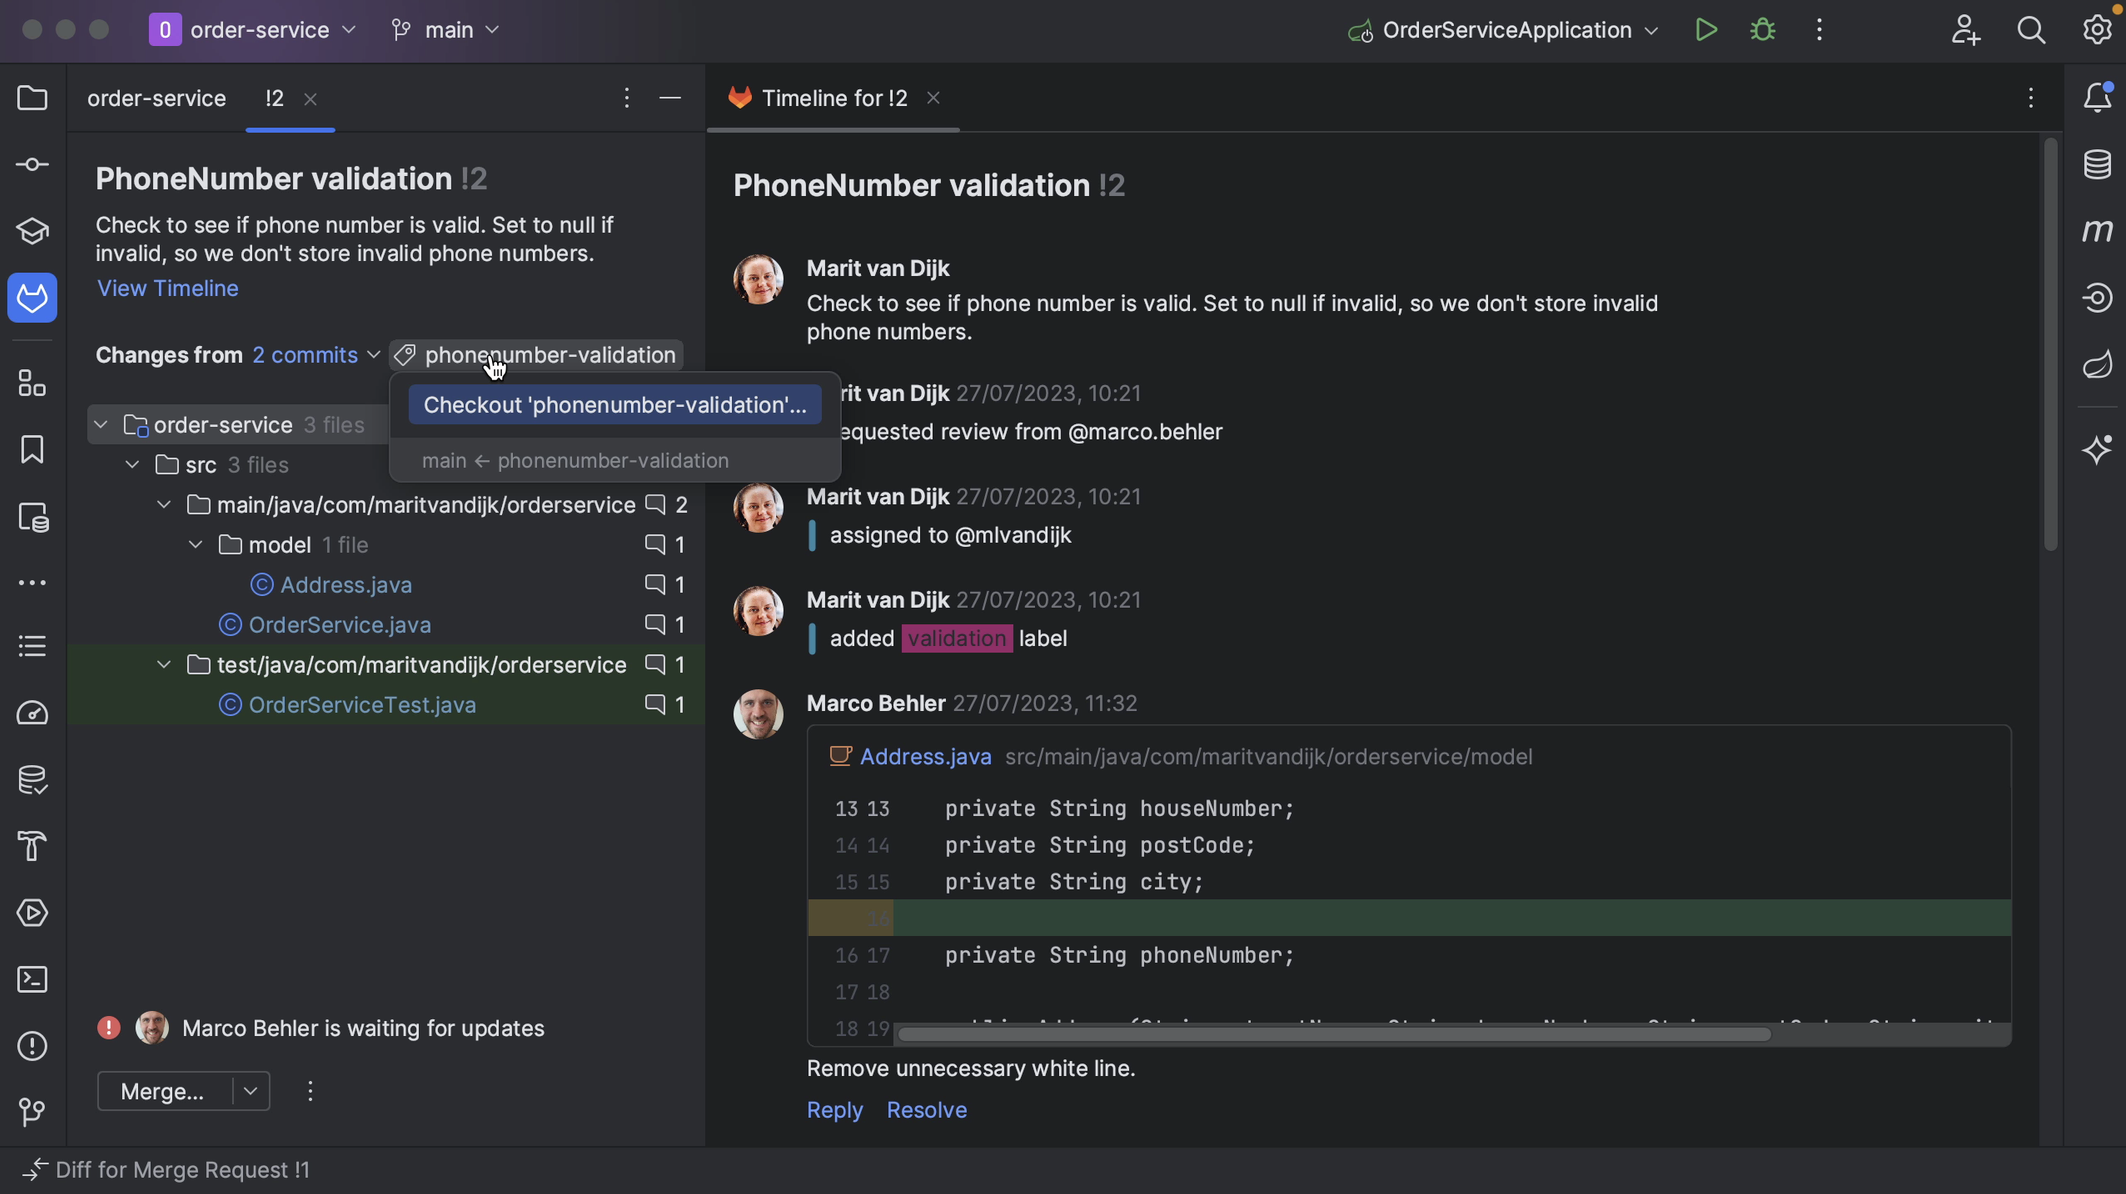
Check out branch locally

With the branch checked out locally, we can navigate the code related to this Merge Request. This lets us not only look at the code, but also make sure that the project still builds and tests pass. We can potentially make changes too.
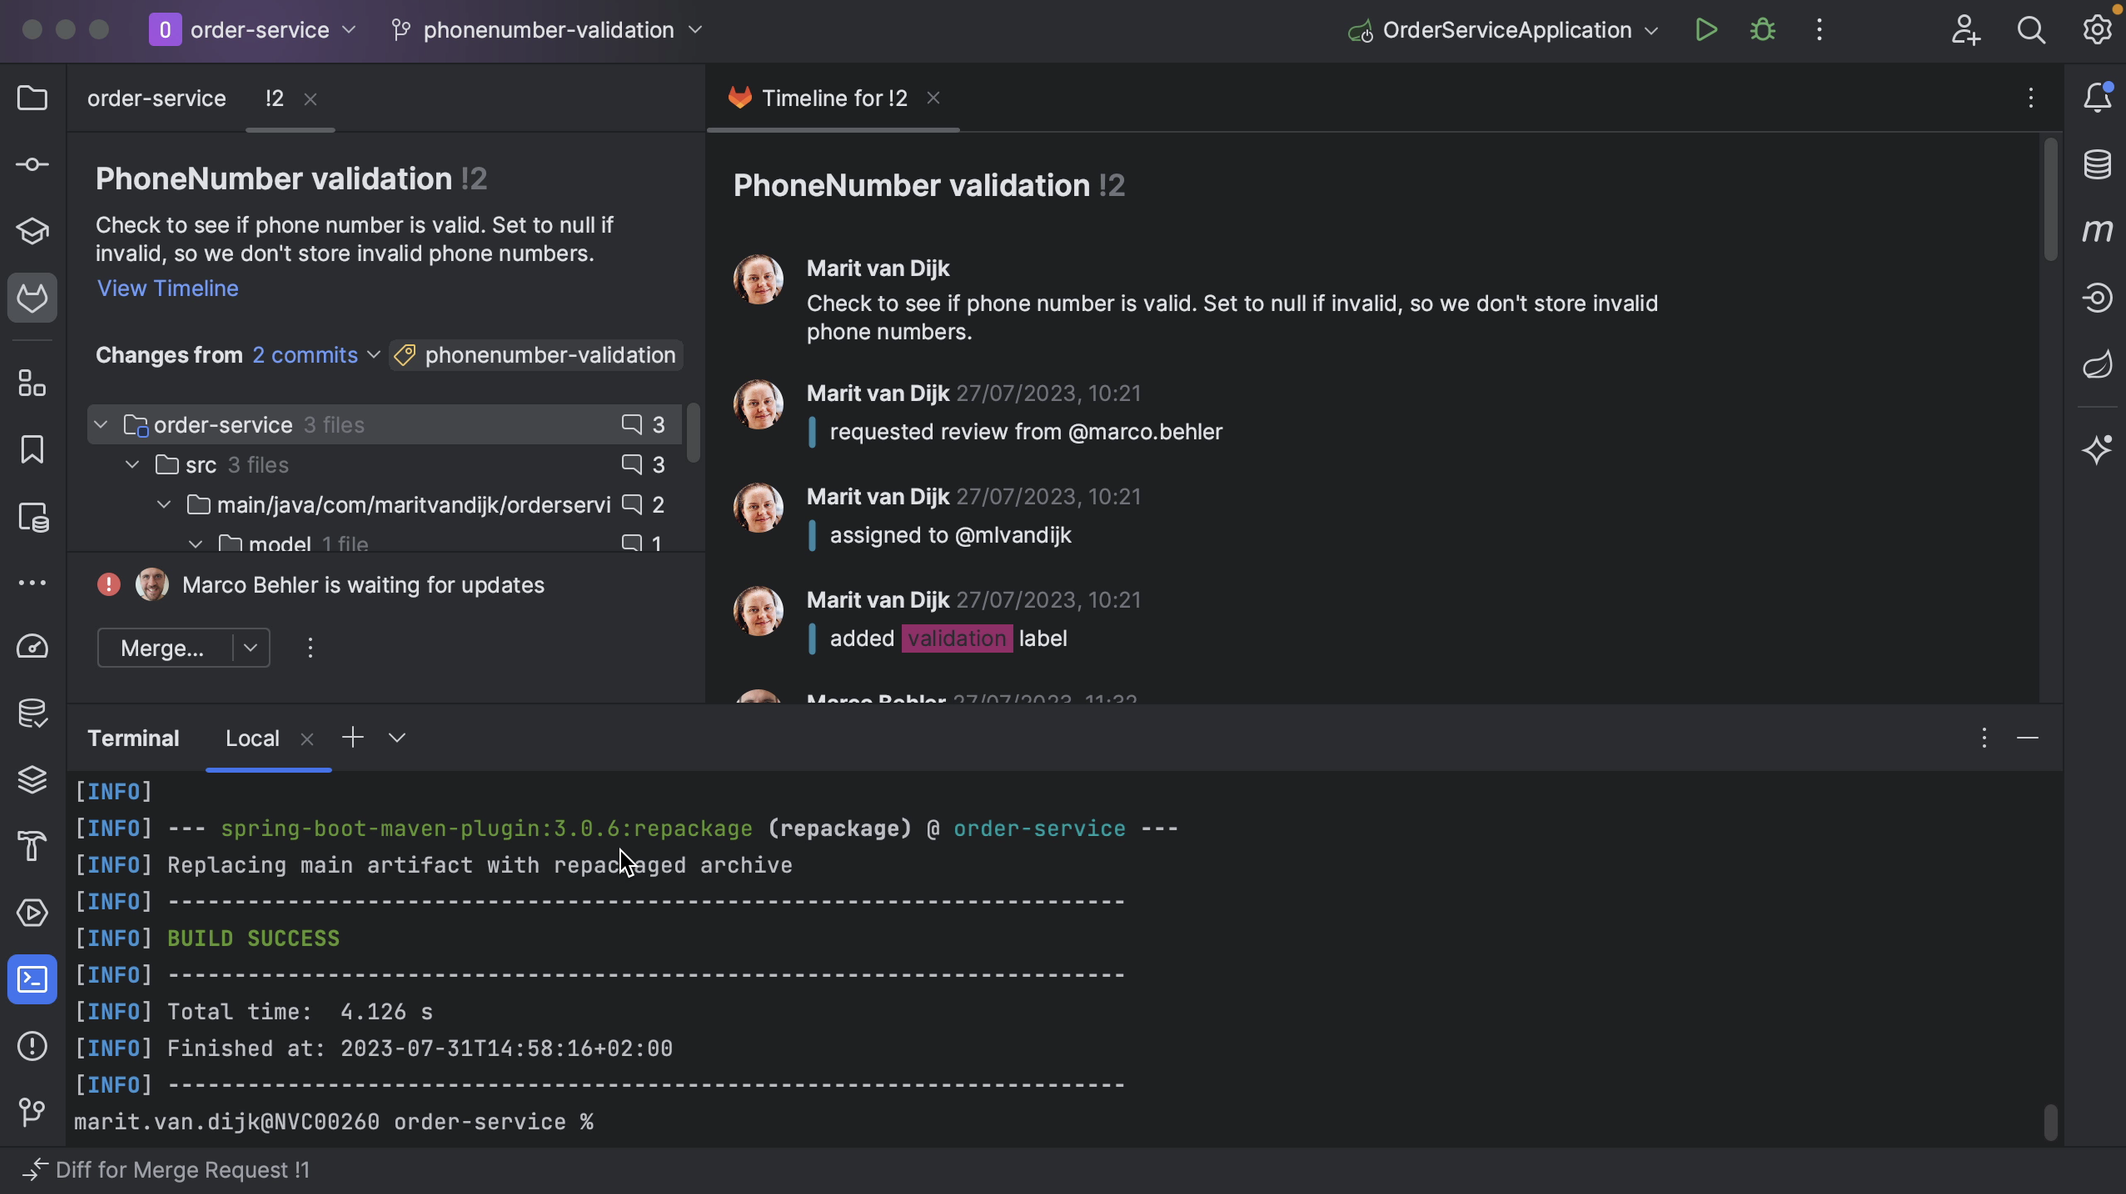
Build success

Finally, let’s look at how to finish off the Merge Request.

If a Merge Request is no longer relevant, and we’re not going to take the changes that went into the Merge Request, we can close it. We can do so by clicking the three dots at the bottom left of the Merge Request tool window and selecting Close Merge Request.
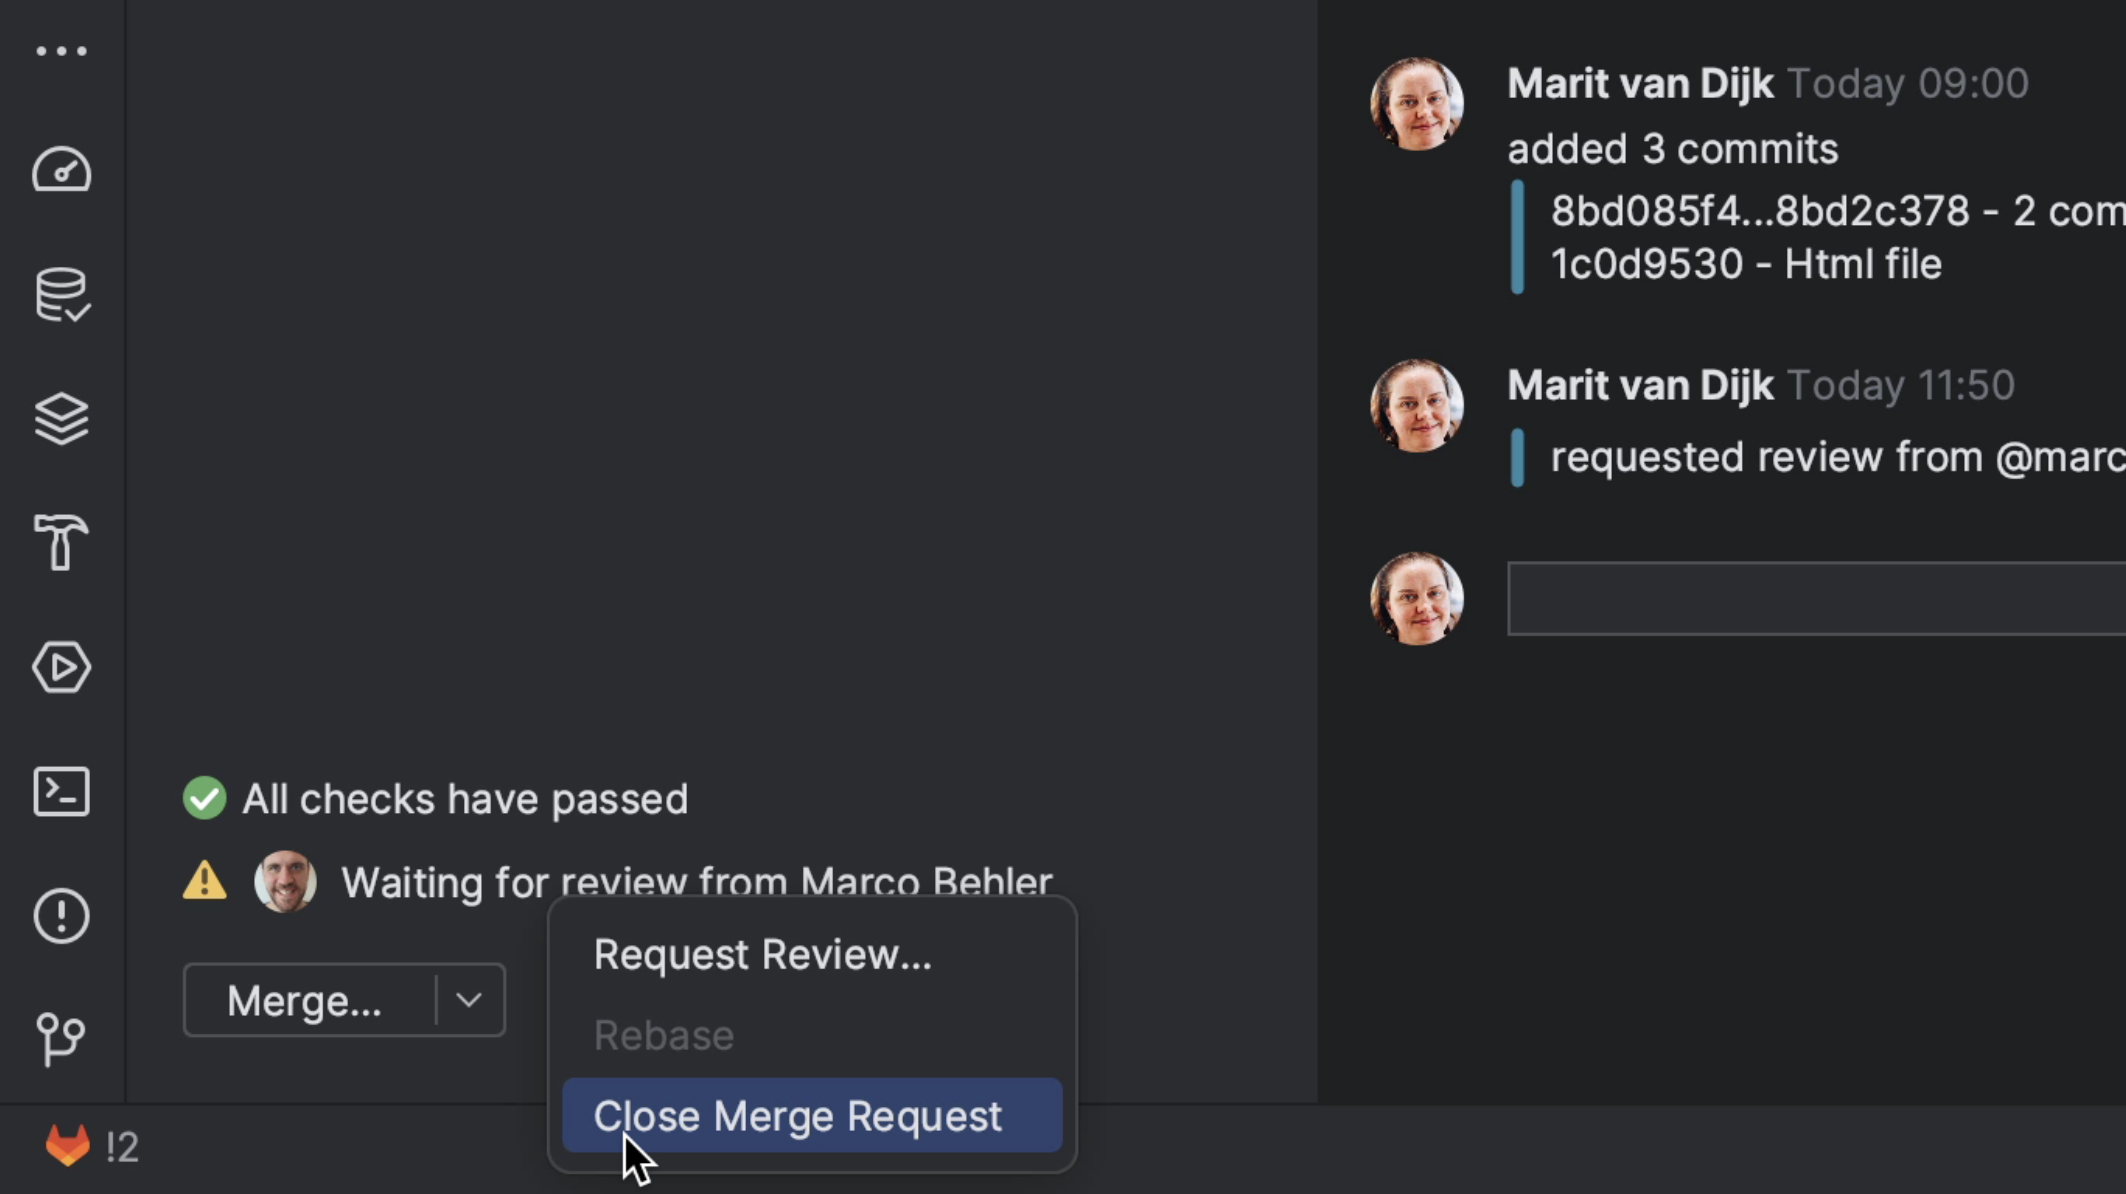
Close

If the Merge Request is ready, meaning all the checks have passed, questions have been answered and requested changes to the code have been made, we can merge it. We can do so by clicking the Merge button at the bottom left of the Merge Request window. We also have the option to Squash and Merge, meaning all commits will be combined into a single commit when merging. We can add our own commit message for the merge, or edit the default one if we want to.
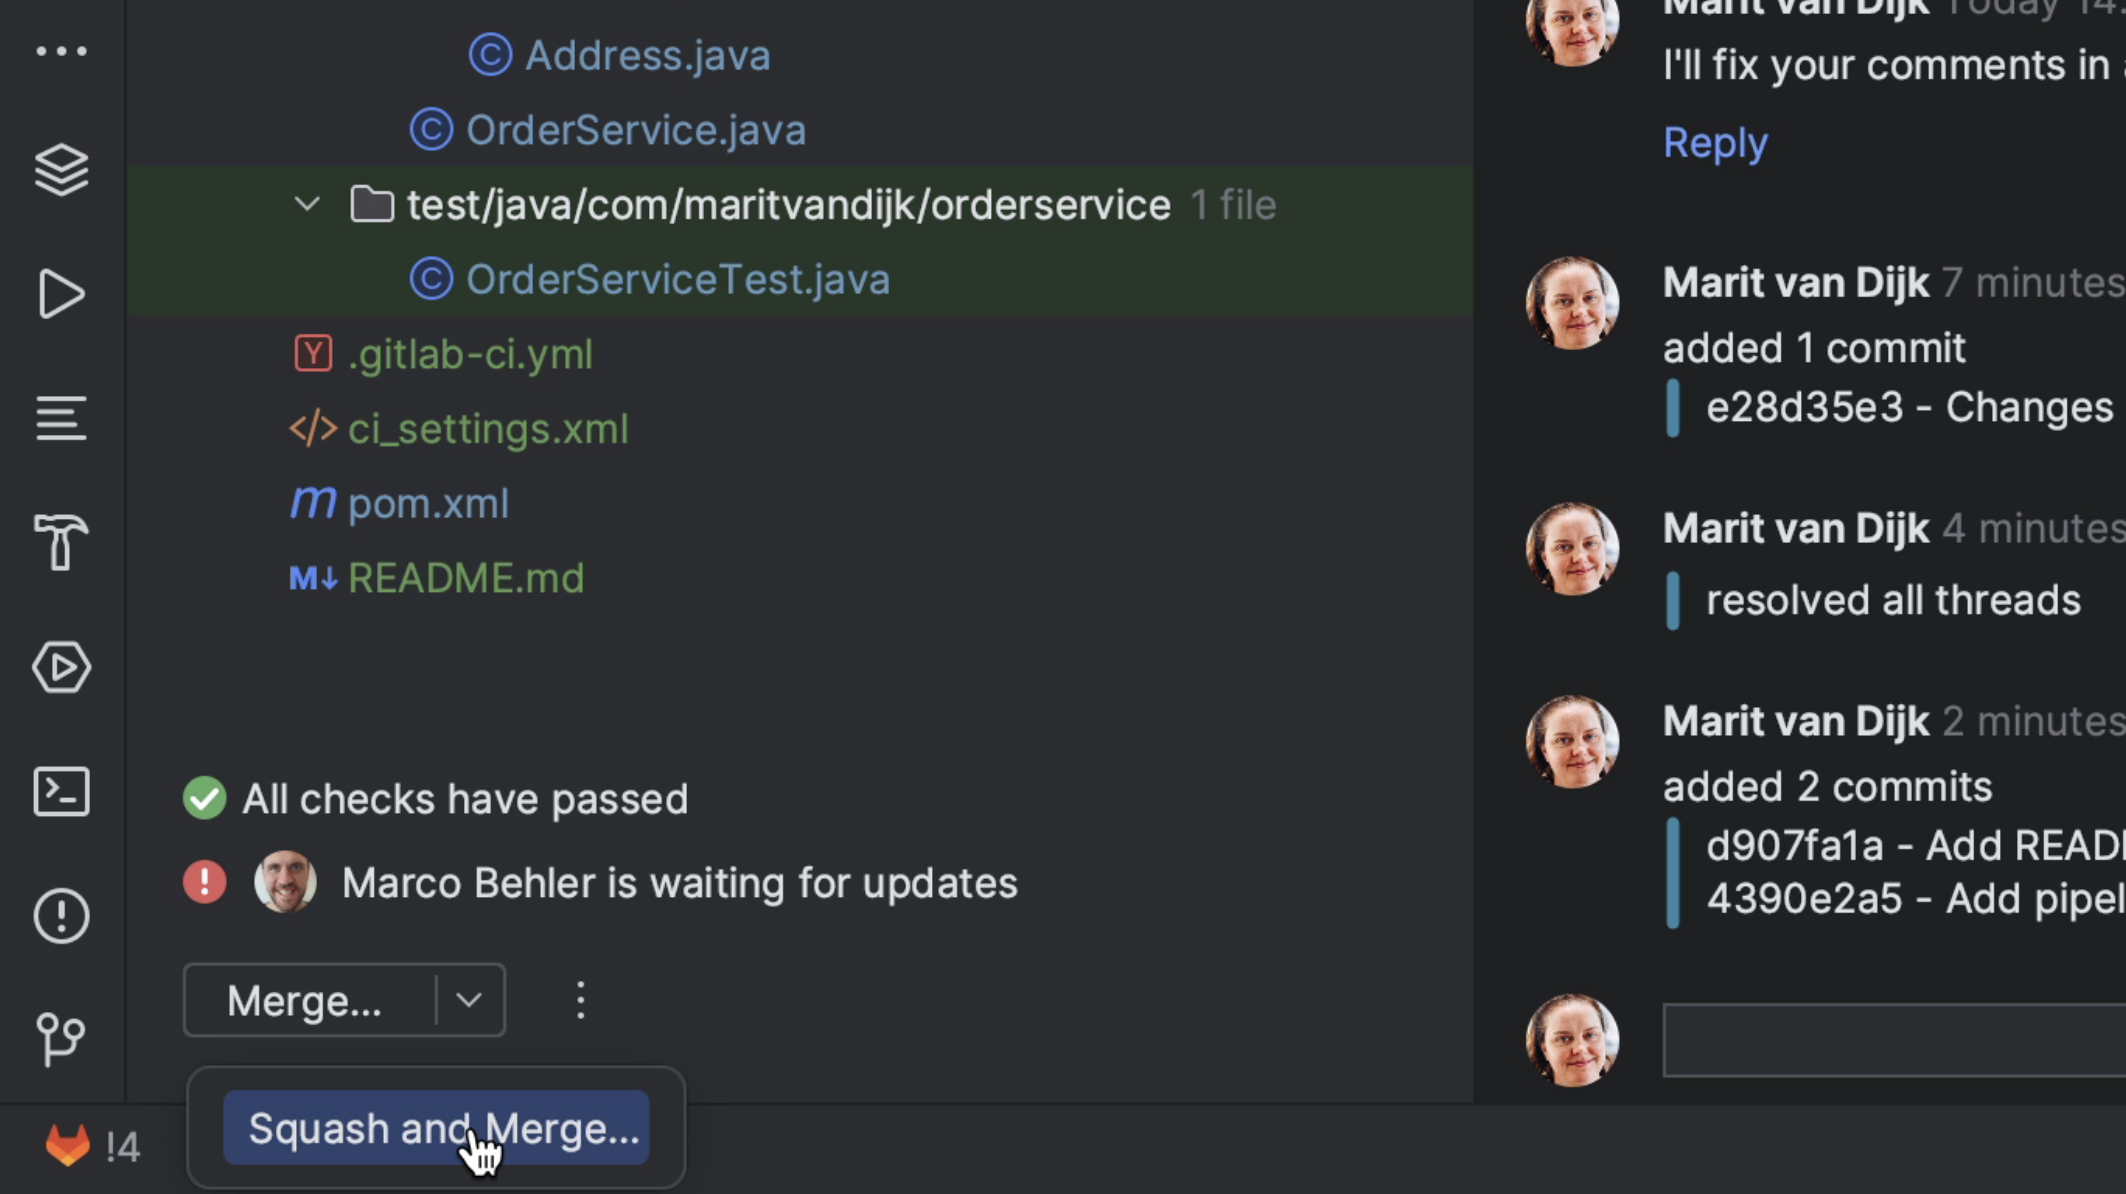
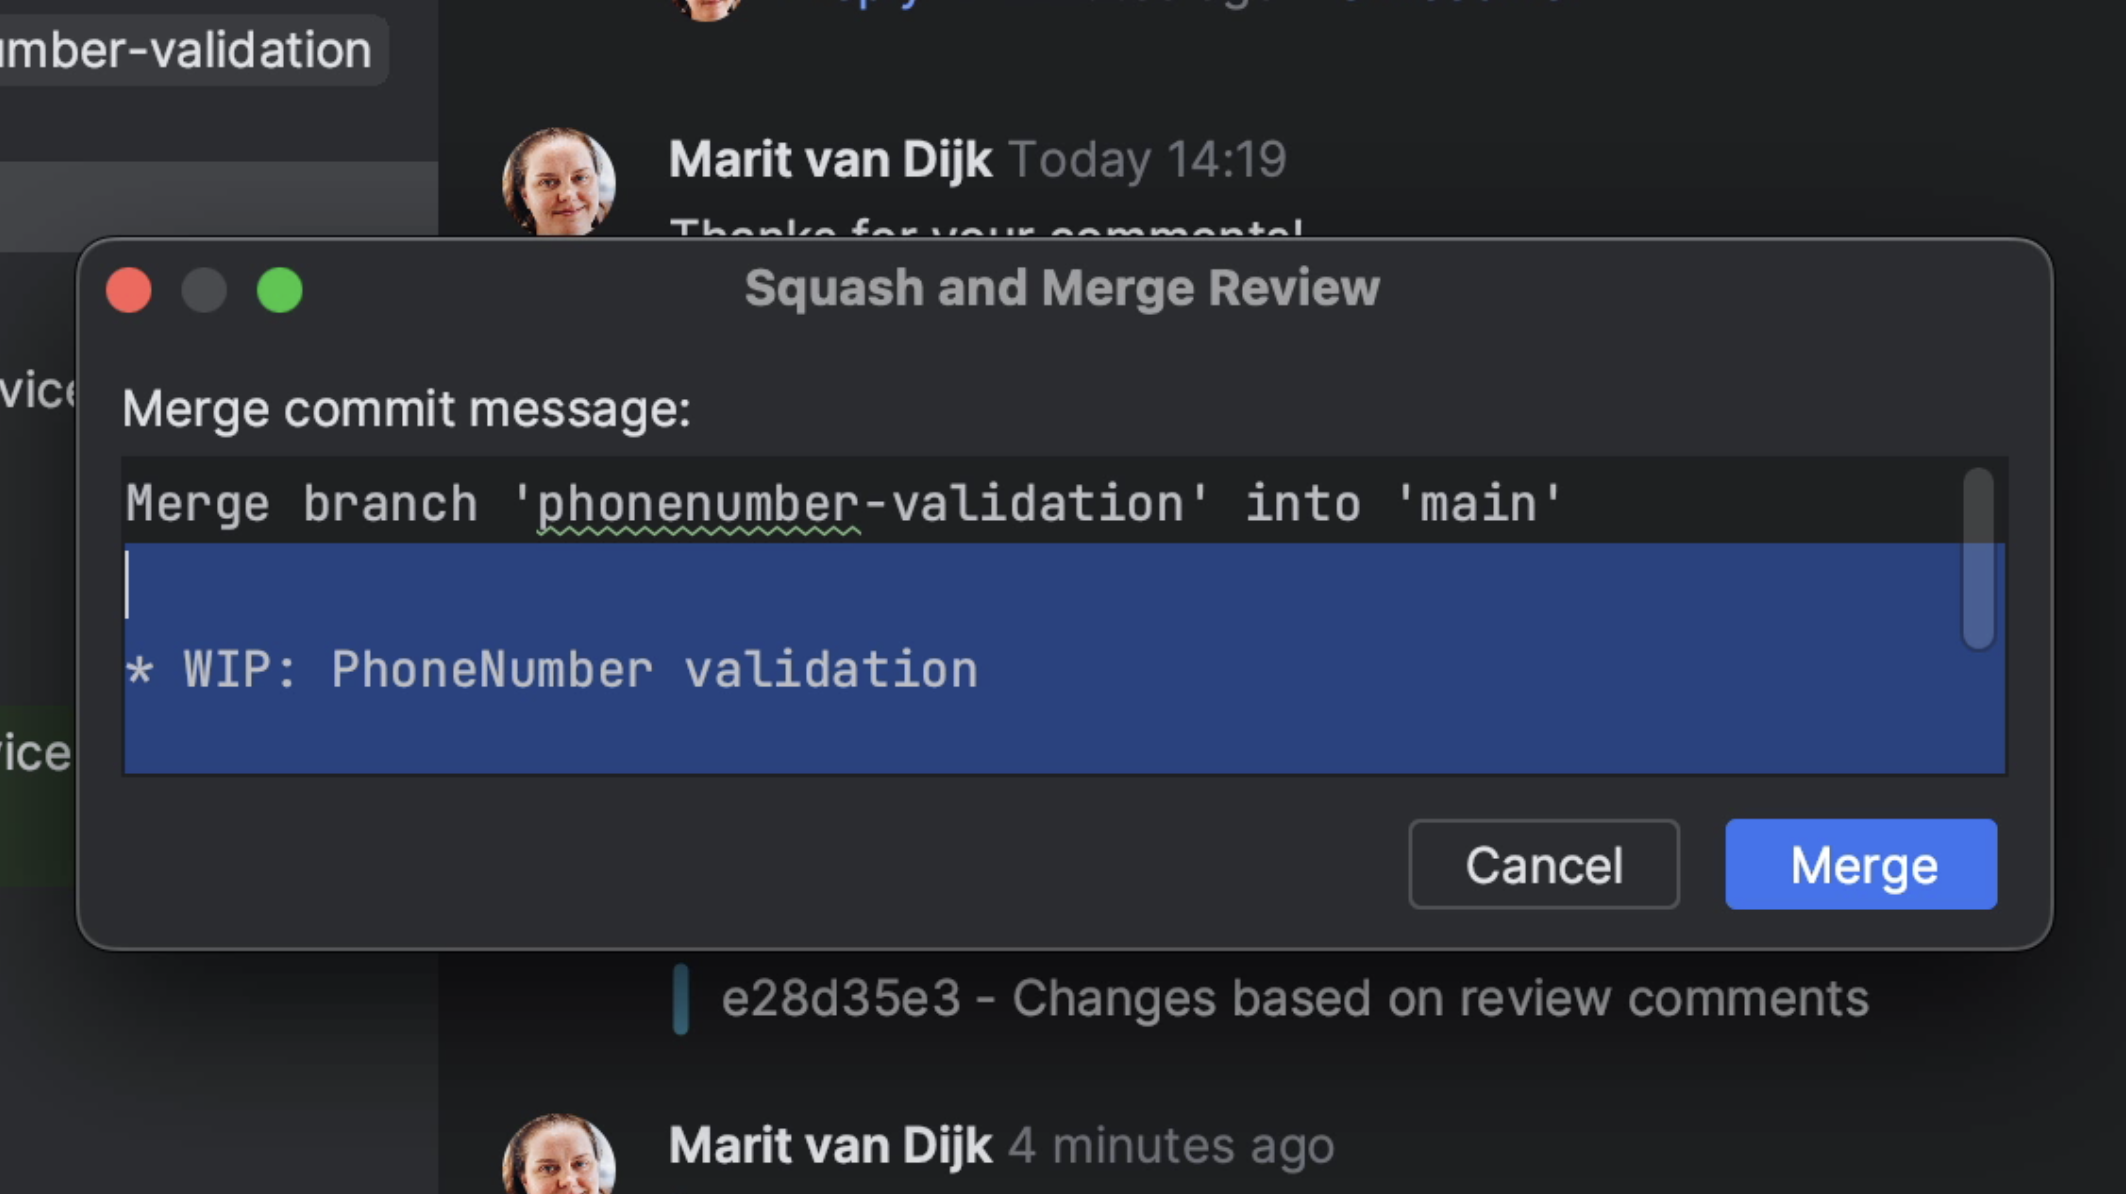
Merge
Edit commit message

The Merge Request will be merged, and if we do a Fetch we can see the updated branches for this repository.
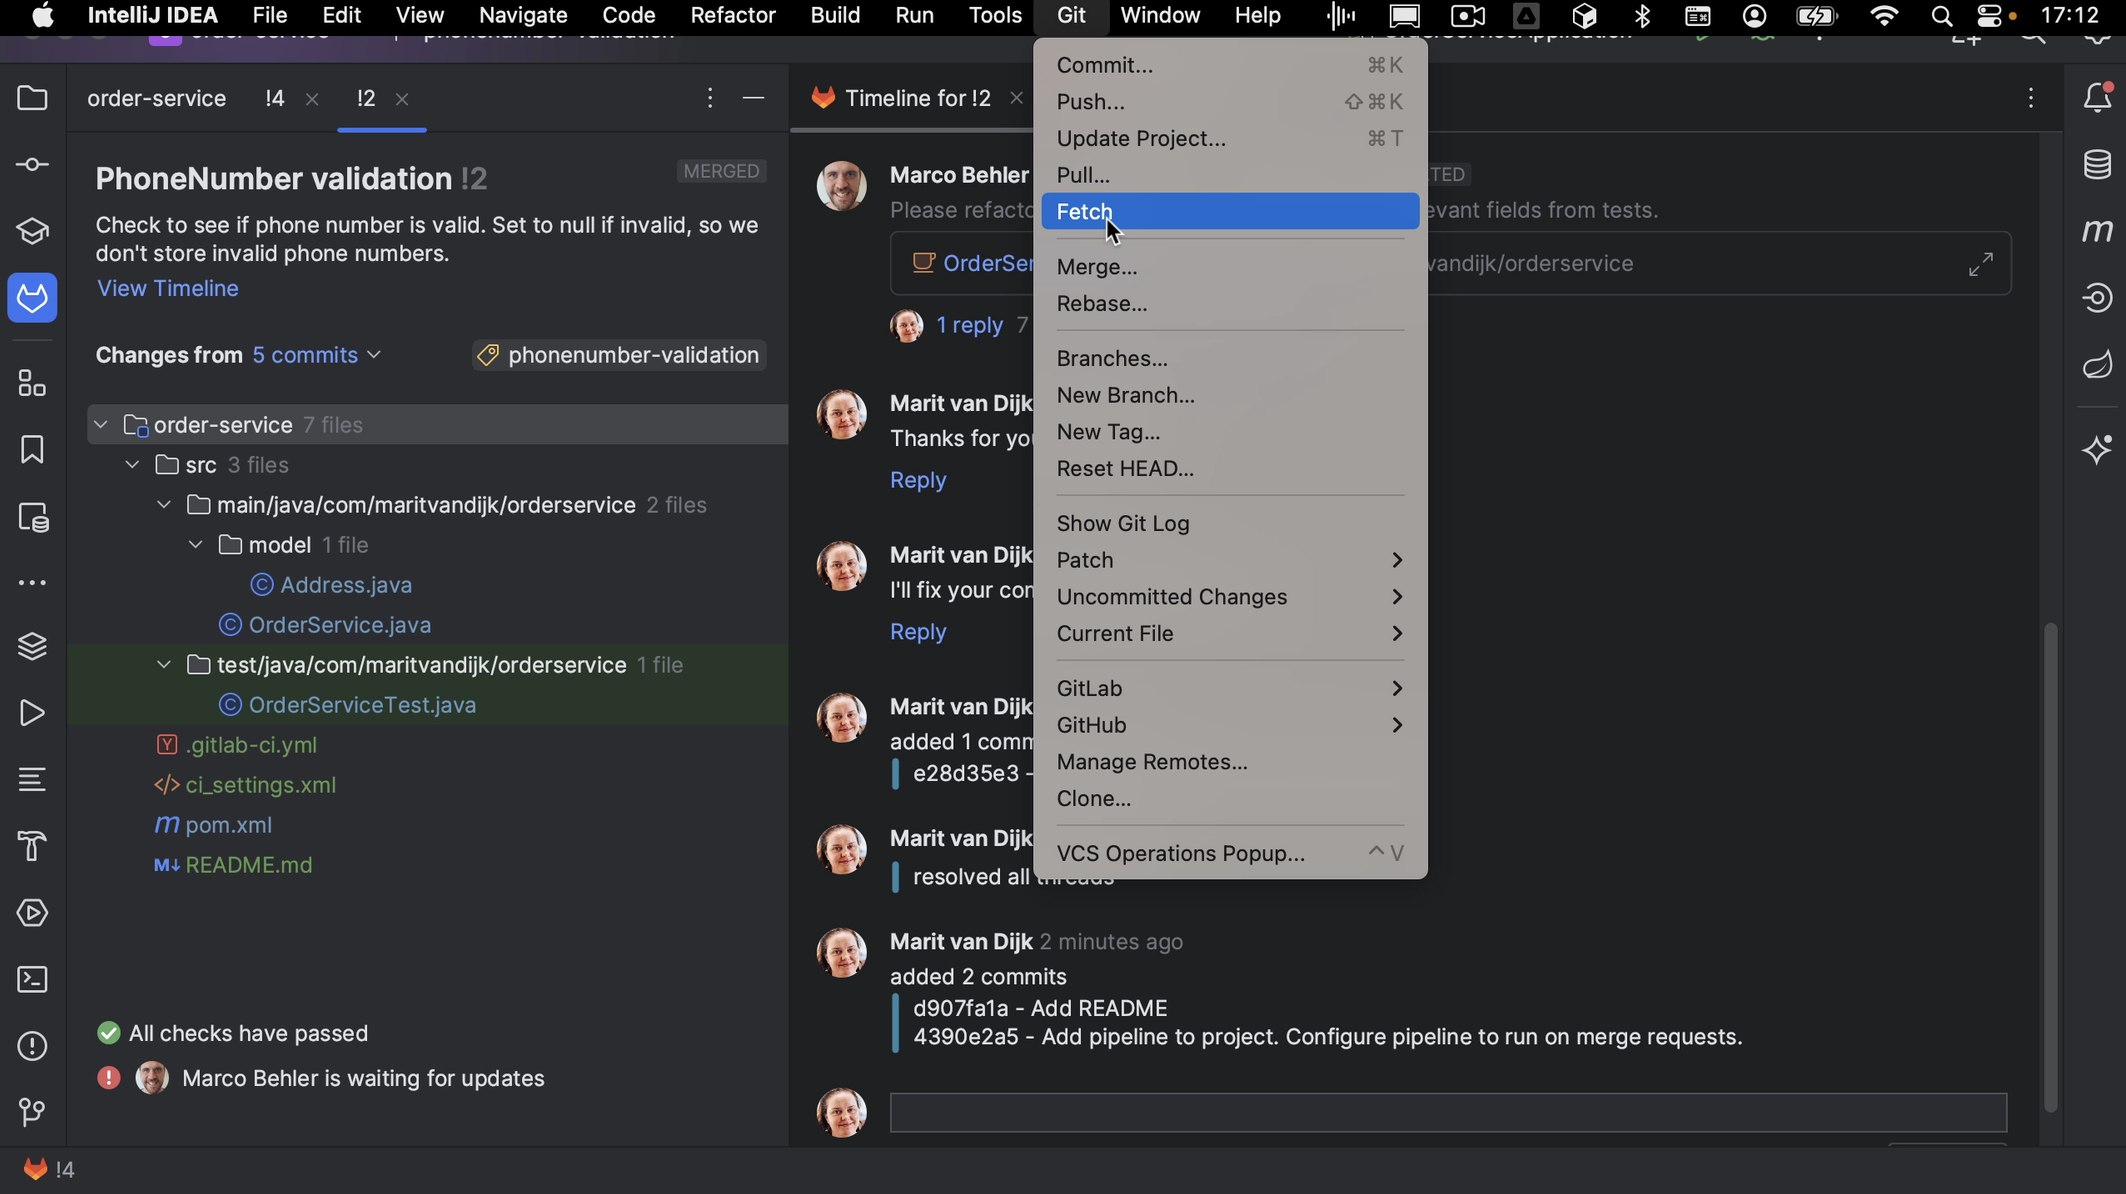
Fetch
Updated branches

We can see in our browser that the Merge Request has been closed.
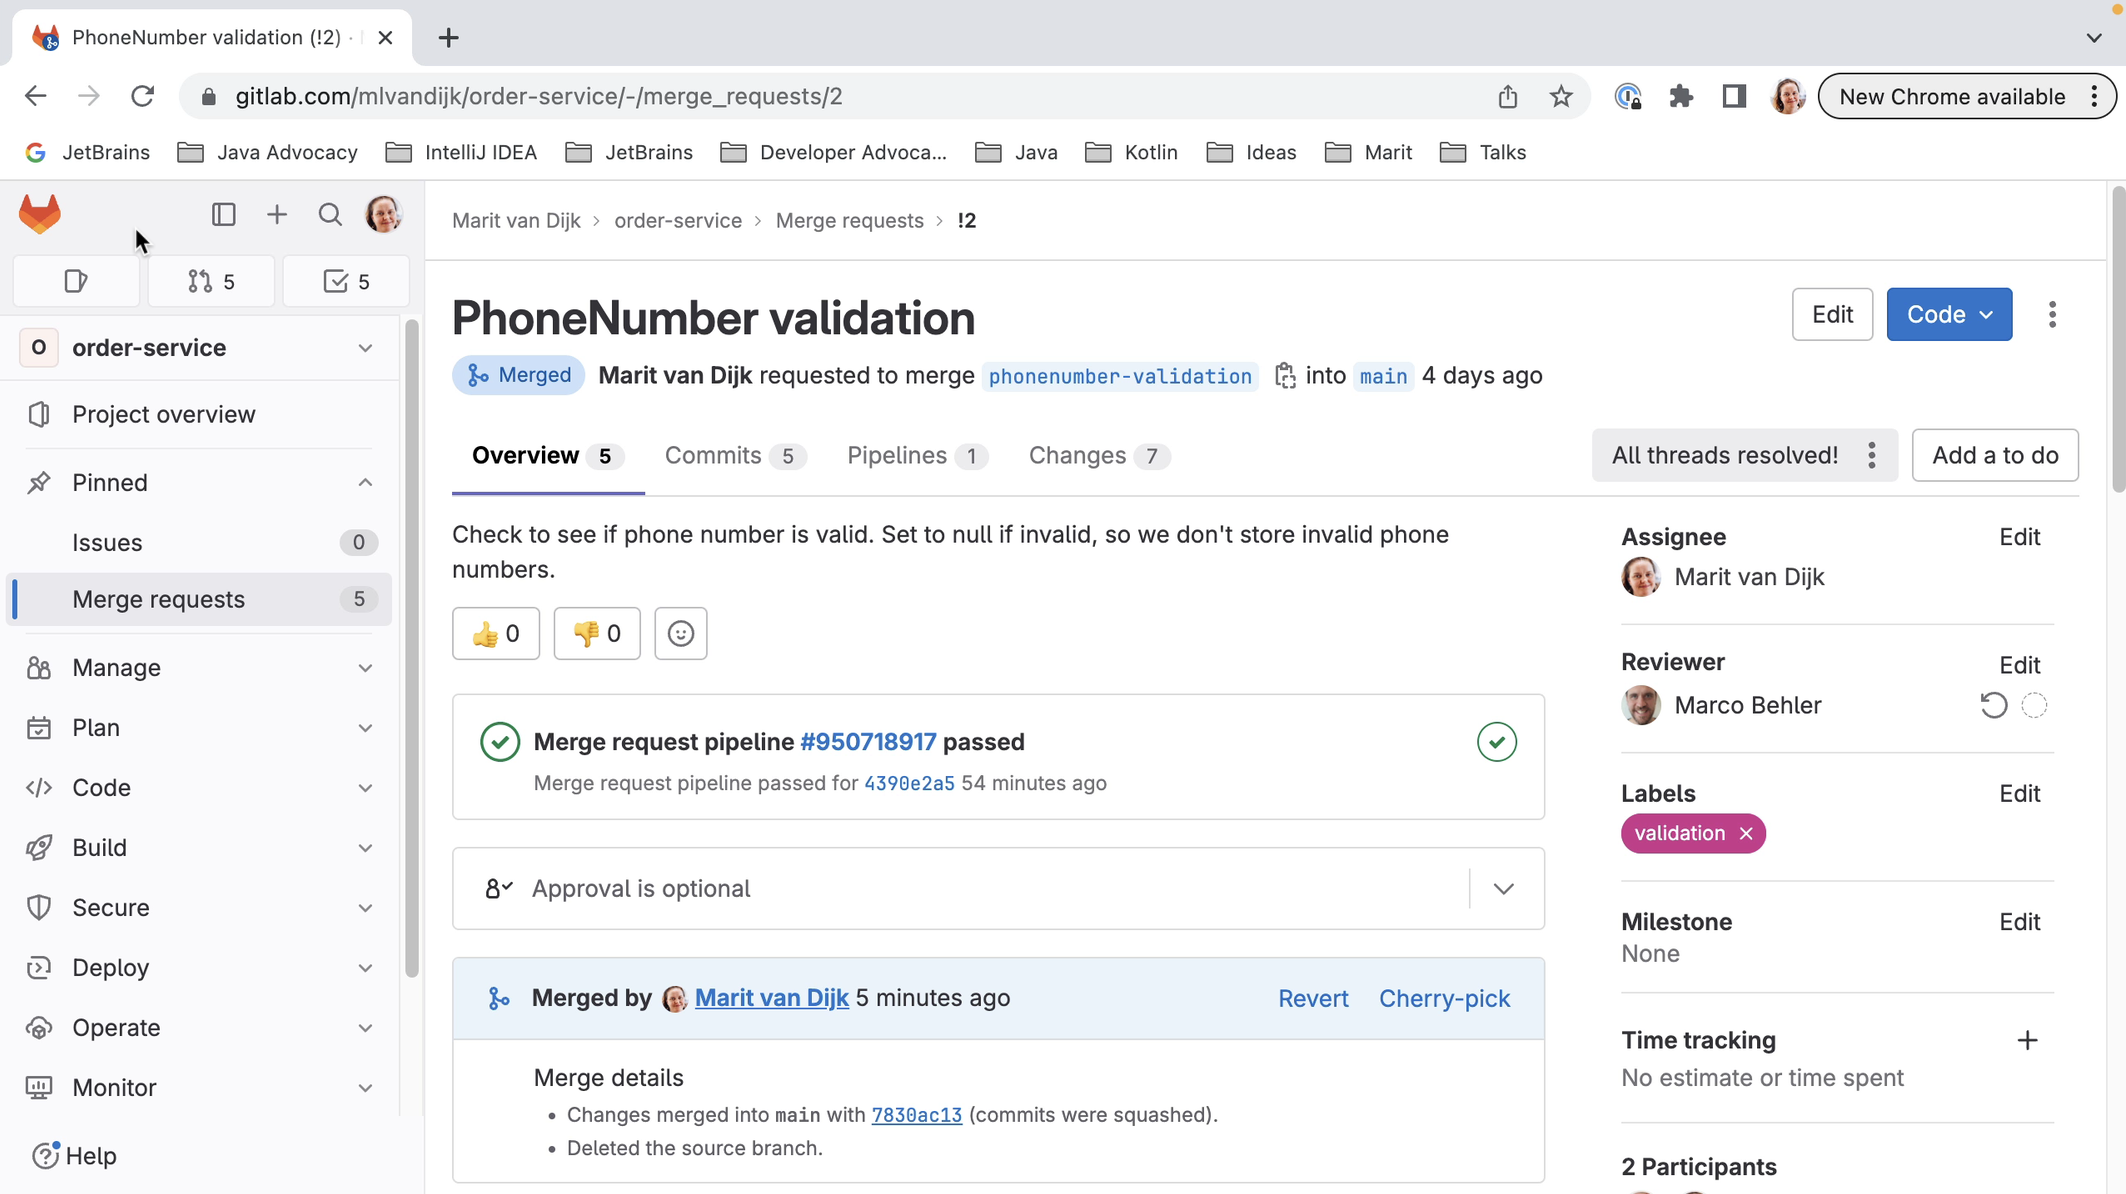
Merged

Summary and shortcuts

As we’ve seen, we can work with GitLab Merge Requests right inside IntelliJ IDEA. We can see all Merge Requests on a project, filter them or search for a specific Merge Request, perform a code review and add comments, see whether checks have passed and there are no merge conflicts, checkout the branch to run it locally, submit our review and approve the Merge Request, and merge (or close) the Merge Request all from inside our IDE.

IntelliJ IDEA Shortcuts Used

Here are the IntelliJ IDEA shortcuts that we used.

NamemacOS ShortcutWindows / Linux Shortcut
Open Settings⌘,Ctrl+Alt+S
Add Account⌘NAlt+Insert
Show Diff⌘DCtrl+D
Compare Next File⌃⇧→Alt+→
Compare Previous File⌃⇧←Alt+←
Hide all windows / Restore windows⇧⌘F12Ctrl+Shift+F12
Recent files⌘ECtrl+E
Refresh reviews⌘RCtrl+F5
IntelliJ IDEA shortcuts used

Related Links

IntelliJ IDEA: GitLab Merge Requests

Overview of IntelliJ IDEA 2023

IntelliJ IDEA is designed to help developers like us stay in the flow while we’re working. Like all IDEs, it has a lot of functionality available, but it’s designed to get out of your way to let you focus on the code.

Take a look at this overview of IntelliJ IDEA.

Introduction

  • Find Action: ⌘ ⇧ A (on macOS) / Ctrl+Shift+A (on Windows/Linux)
  • Feature Trainer
  • Hide all windows: ⌘ ⇧ F12 (on macOS) / Shift+Command+F12 (on Windows/Linux)
  • Project tool window: ⌘1 (on macOS) / Alt+1 (on Windows/Linux)
  • Quick Switch Scheme: ^`(on macOS) / Ctrl+` (on Windows/Linux)
  • IDE viewing modes
  • Preferences: ⌘, (on macOS) / Ctrl+Alt+S (on Windows/Linux)

Coding assistance

  • Code completion
  • Complete Current Statement: ⌘ ⇧ ⏎ (on macOS) / Shift+Ctrl+Enter (on Windows/Linux)
  • Show Context Actions: ⌥ ⏎ (on macOS) / Alt+Enter (on Windows/Linux)
  • Intention actions
  • Navigate to next highlighted error: F2
  • Navigate to previous highlighted error: Shift F2
  • Generate code: ⌘ N (on macOS) / Alt + Insert (on Windows/Linux)
  • Live templates

Refactoring

  • Rename: Shift F6
  • Extend selection: ⌥ Up (on macOS) / Ctrl+W (on Windows/Linux)
  • Extract variable: ⌘ ⌥ V on macOS) / Ctrl+Alt+V (on Windows/Linux)
  • Postfix completion
  • Reformat code: ⌘ ⌥ L (on macOS) / Ctrl+Alt+L (on Windows/Linux)
  • Move statement up: ⇧⌘ Up (on macOS) / Ctrl+Shift+Up (on Windows/Linux)
  • Surround with: ⌘ ⌥ T (on macOS) / Ctrl+Alt+T (on Windows/Linux)
  • SmartType Completion: ^ ⇧ Space  (on macOS) / Shift+Ctrl+Space (on Windows/Linux)
  • Inline: ⌘ ⌥ N (on macOS) / Ctrl+Alt+N (on Windows/Linux)
  • Extract method: ⌘ ⌥ M on macOS) / Ctrl+Alt+M (on Windows/Linux)

Testing & Debugging

Navigation

  • Navigate backwards: ⌘ [ (on macOS) / Ctrl+Alt+Left (on Windows/Linux)
  • Navigate forwards: ⌘ ] (on macOS) / Ctrl+Alt+Right (on Windows/Linux)
  • Find usages / declaration: ⌘ B (on macOS) / Ctrl+B (on Windows/Linux)
  • Recent Files: ⌘E (on macOS) / Ctrl+E (on Windows/Linux)
  • Recent locations: ⇧⌘E (on macOS) / Ctrl+Shift+E (on Windows/Linux)
  • Search everywhere: ⇧⇧ (on macOS) / Shift Shift (on Windows/Linux)
  • Find in files: ⇧⌘F (on macOS) / Ctrl+Shift+F (on Windows/Linux)

Reading Code

  • Folding -> Expand: ⌘ + (on macOS) / Ctrl+ + (on Windows/Linux)
  • Folding -> Collapse: ⌘ – (on macOS) / Ctrl+ – (on Windows/Linux)
  • Folding -> Expand All : ⇧ ⌘ + (on macOS) / Ctrl+Shift+ + (on Windows/Linux)
  • Folding -> Collapse All: ⇧ ⌘ + (on macOS) / Ctrl+Shift+ – (on Windows/Linux)
  • File Structure: ⌘ F12 (macOS) / Ctrl+F12 (Windows/Linux) – Twice to expand list
  • Quick documentation: F1 (macOS) / Ctrl+Q (Windows/Linux)
  • Toggle Rendered View:  ^ ⌥ Q (macOS) / Ctrl+Alt+Q (Windows/Linux)

Version Control support (Git)

  • Commit: ⌘ 0 (macOS) / Alt+0 (Windows/Linux)
  • Jump to last tool window: F12
  • Show diff: ⌘ D (macOS) / Ctrl+D (Windows/Linux)
  • Commit Anyway and Push: ⌥ ⌘ K (on macOS) / Ctrl+Alt+K (on Windows/Linux)
  • Git tool window: ⌘9 (on macOS) / Alt+9 (on Windows/Linux)
  • Terminal: ⌥ F12 (on macOS) / Alt+F12 (on Windows/Linux)
  • Git integration

Language and technology support

Integrated tools support

Contributing to open source software; creating a pull request

In this tutorial, we are going to take a look at contributing to Open Source Software, specifically how to do a pull request (PR). We will look at forking and cloning the project, making the changes, committing and pushing these changes, creating the pull request, the review and hopefully merge of your PR. The same process may apply when making contributions to a project at work that you don’t own. In this example, the project is on GitHub. Other Git code repositories may use a similar process.

There are many reasons to contribute to open source projects, and different ways to find an issue to work on, from fixing a bug that is bothering you, to simply wanting to help out, or even just to gain more experience and learn something new. If you’re fixing something that is currently bothering you, you will have a specific issue and project to work on. If not, you could consider contributing to a project you like to use, or finding an issue that is suitable for someone new to contributing to open source and/or the project. There are also many different things you can contribute. Code is one, but projects also need testing and other things. For more information on what you can contribute and how to find something to contribute, please have a look at this video.

For this blog post, let’s assume we’ve found a project we want to work on, and an issue we want to fix.

Getting the project

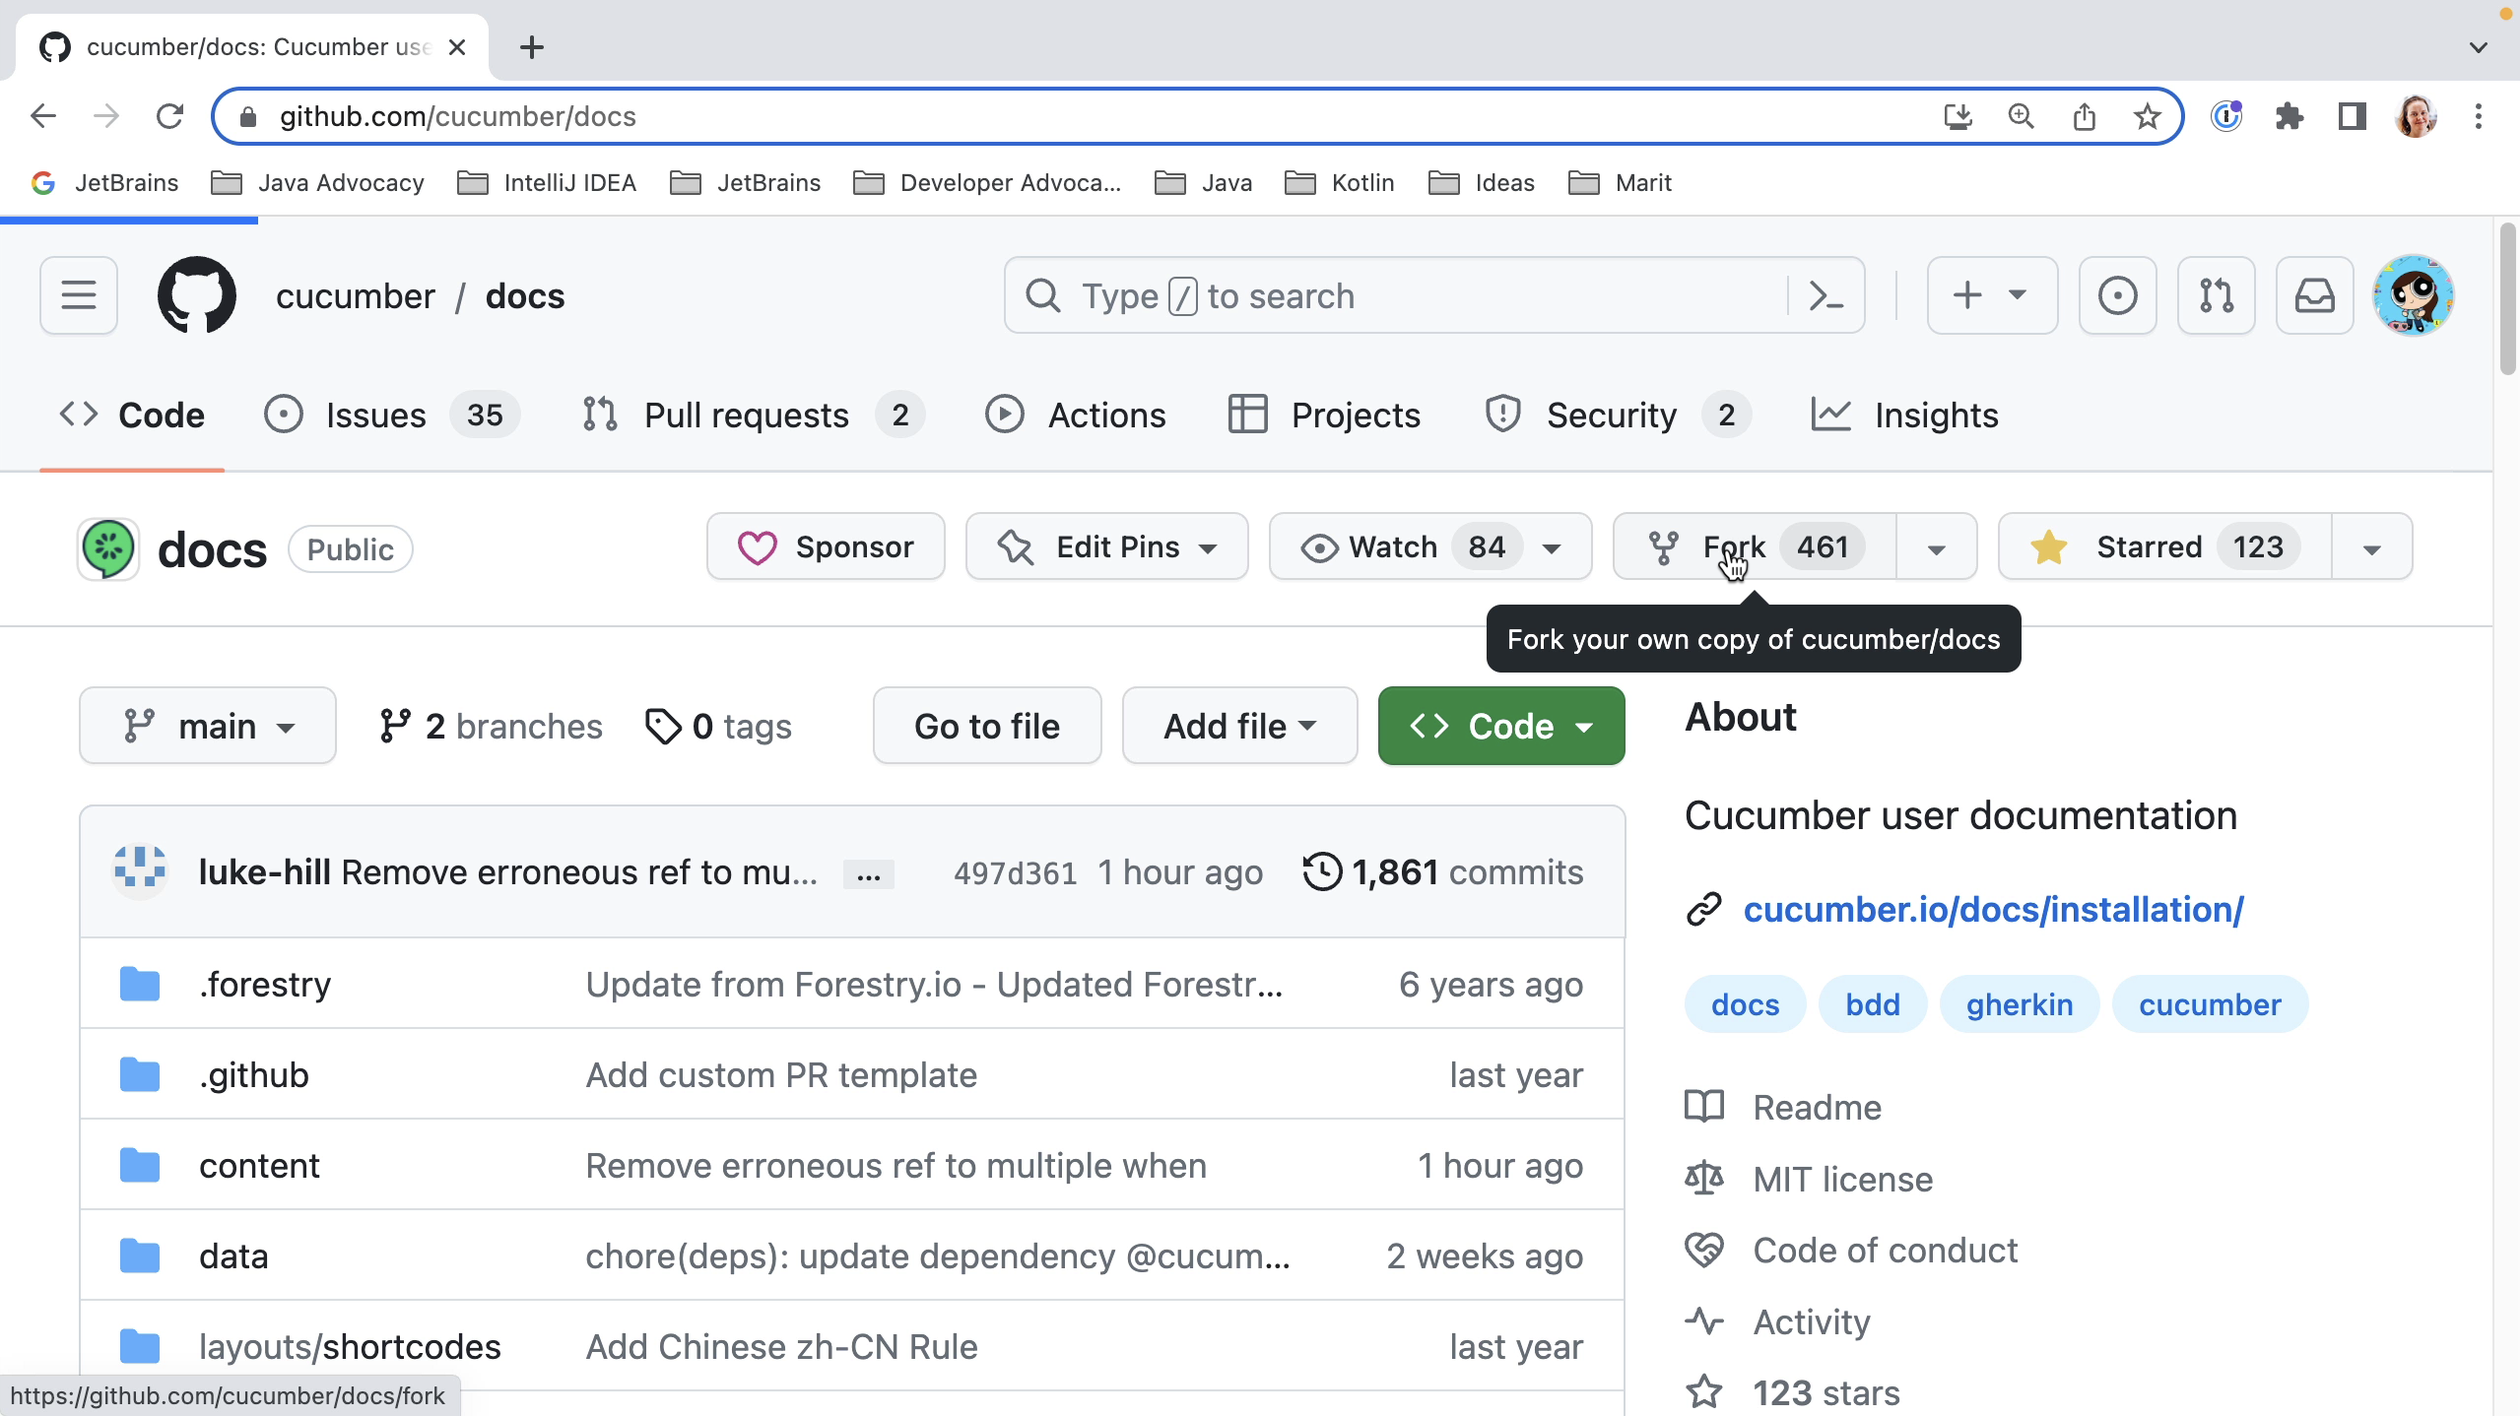
When making your first contribution, you won’t have access to push to the open source project directly. So, the first thing we will need to do is fork this project to our own profile. This means we create a copy of the original project on our profile.

Fork project

Fork

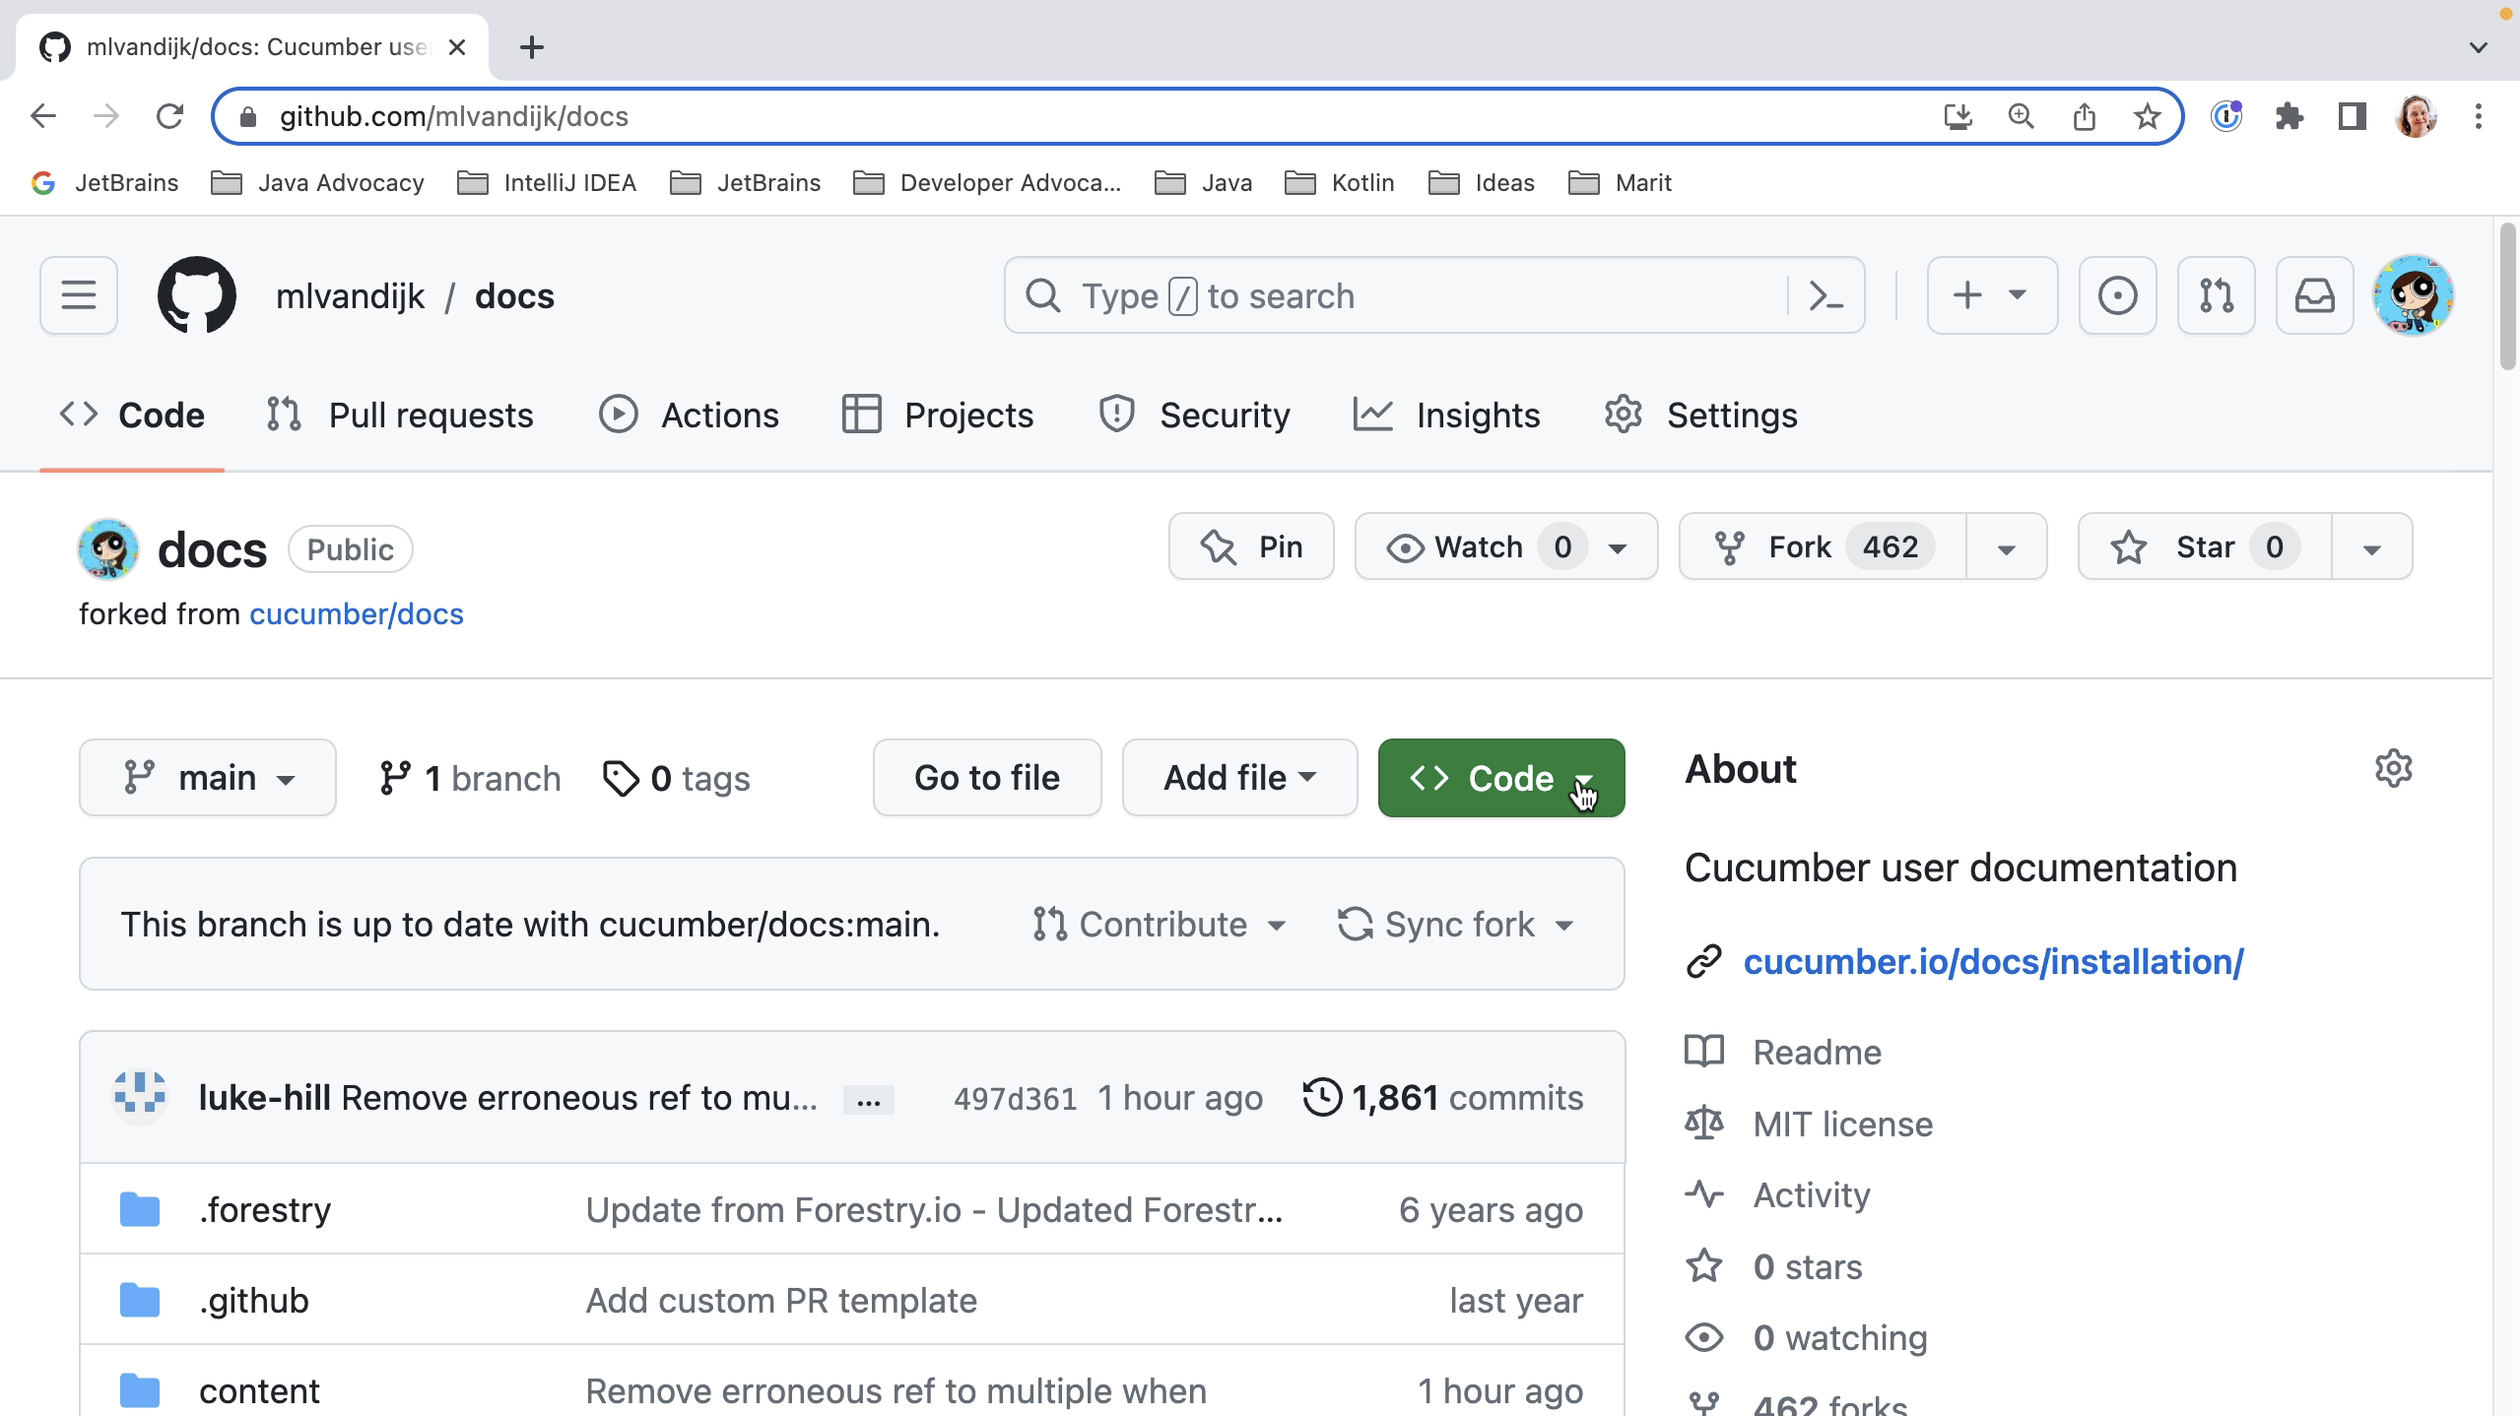
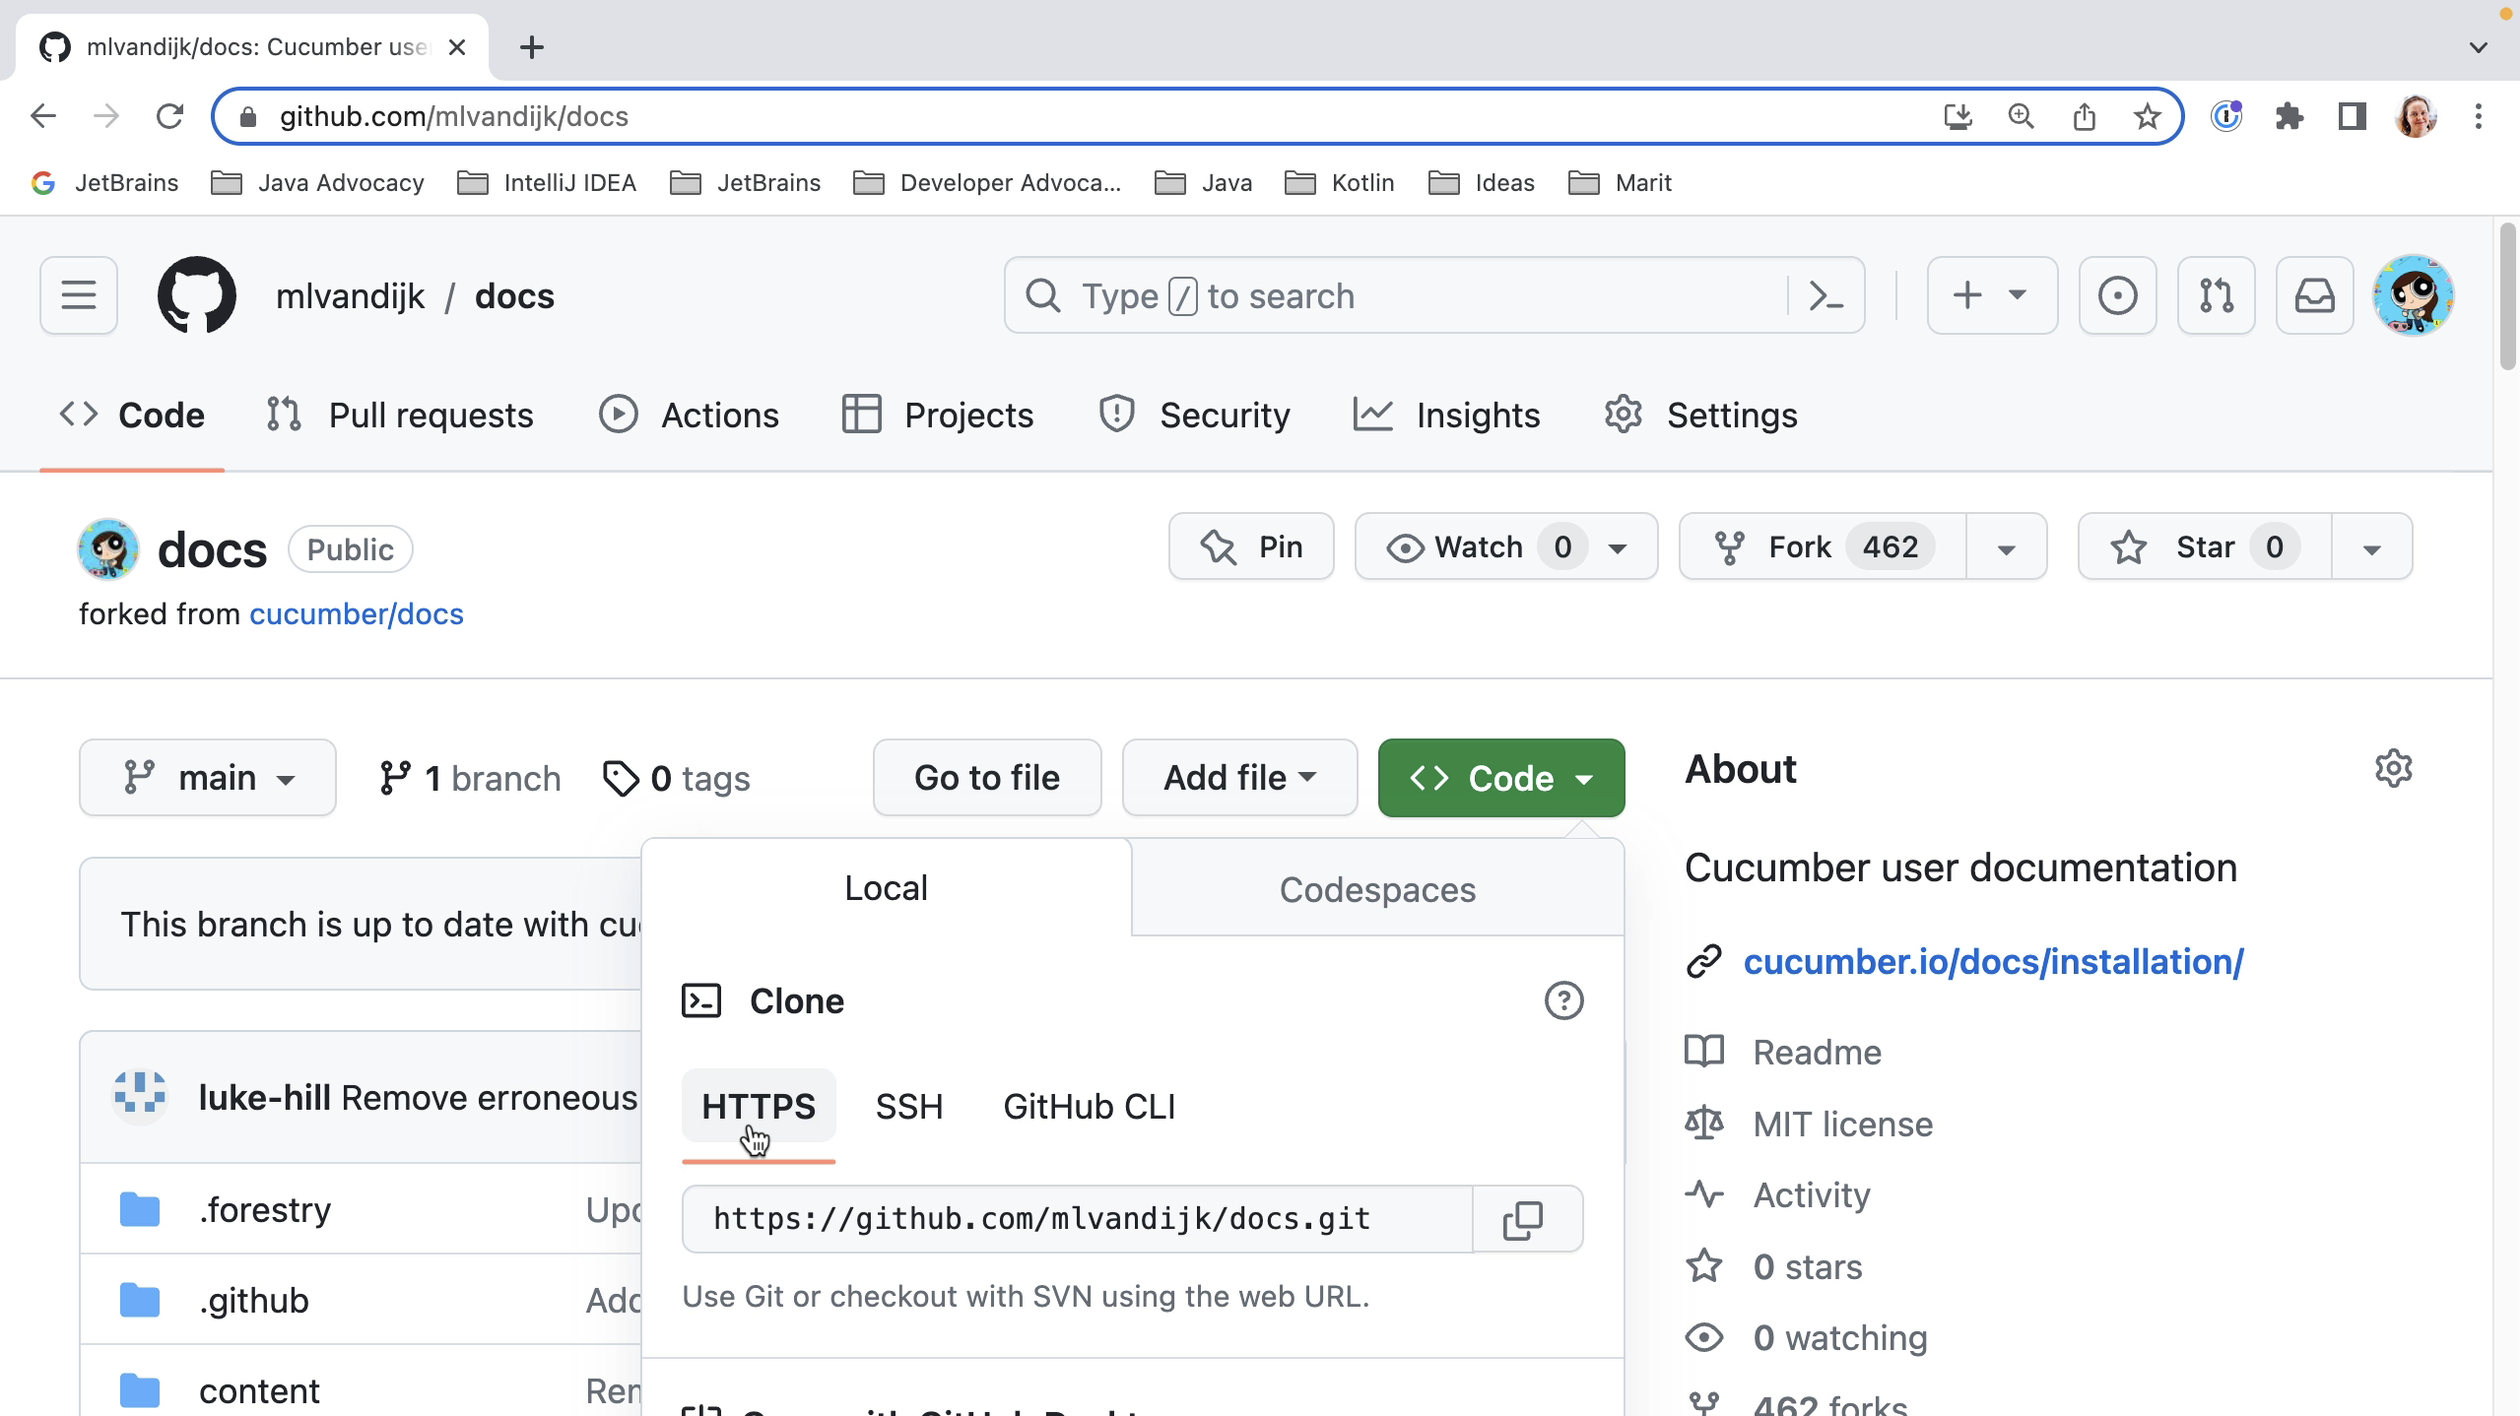
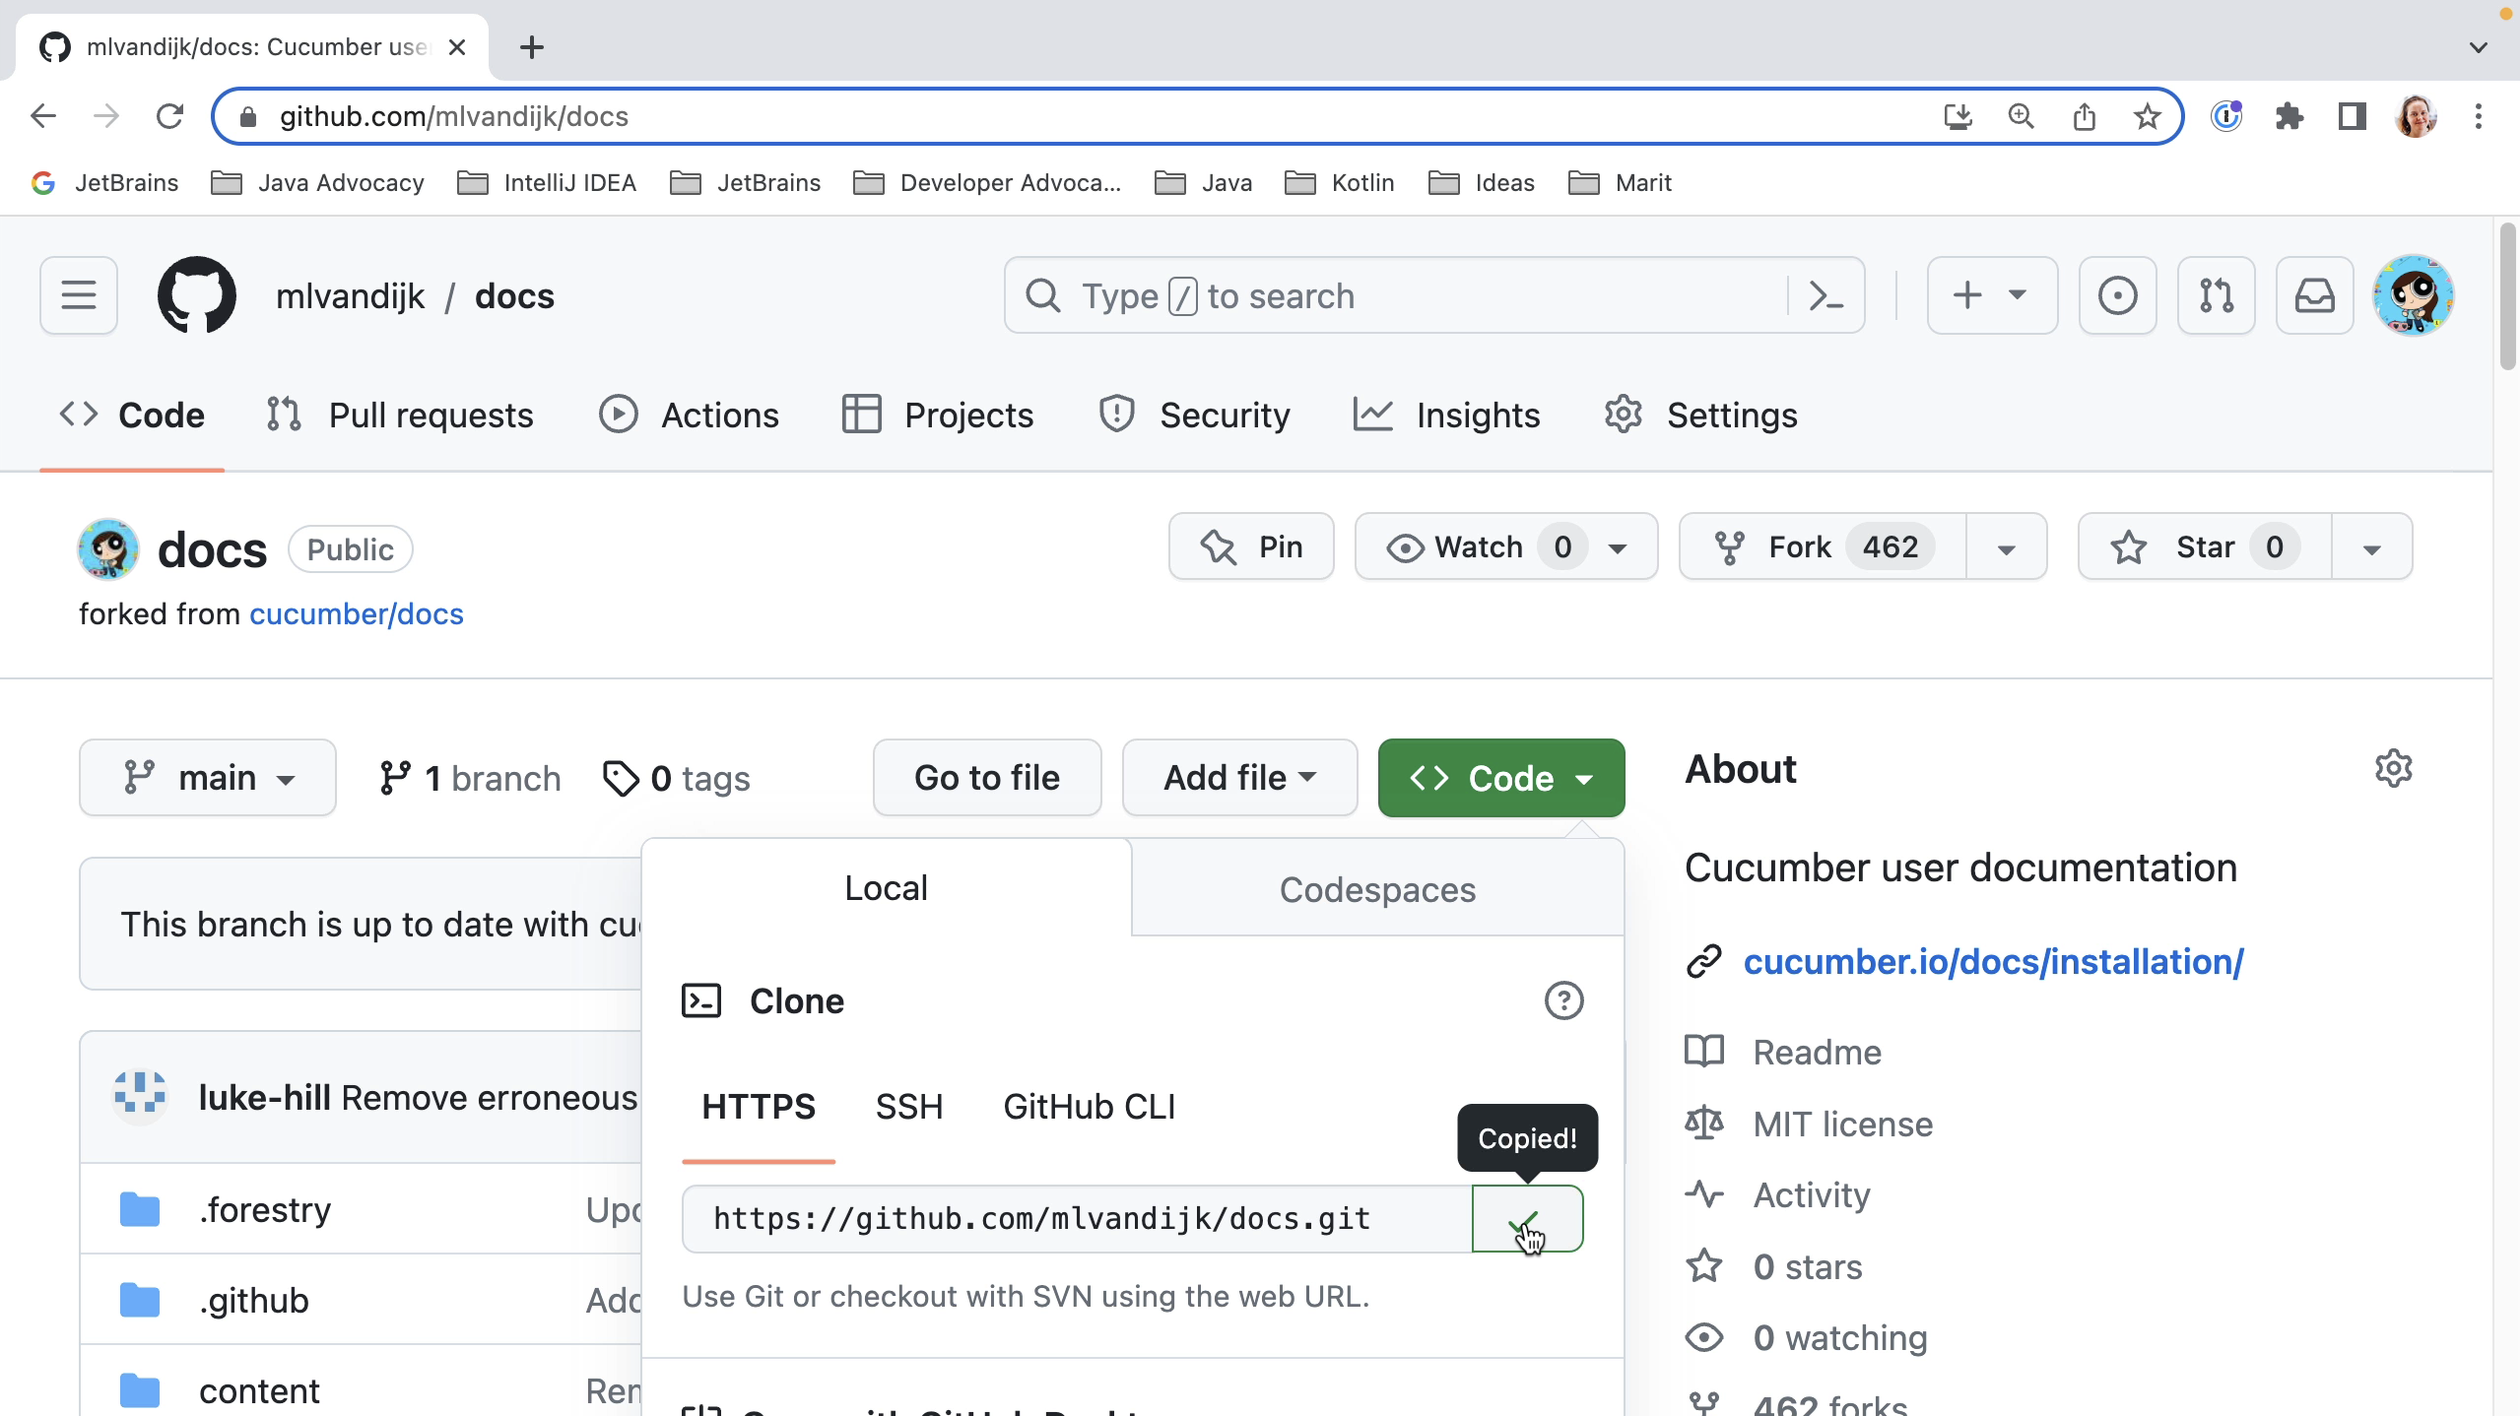
We then need to clone this project to our local machine. We see that we have several options to get the code. Let’s use HTTPS as that can be the simplest option. When we click the clipboard icon, the URL will be copied to our clipboard.

Clone

Copied

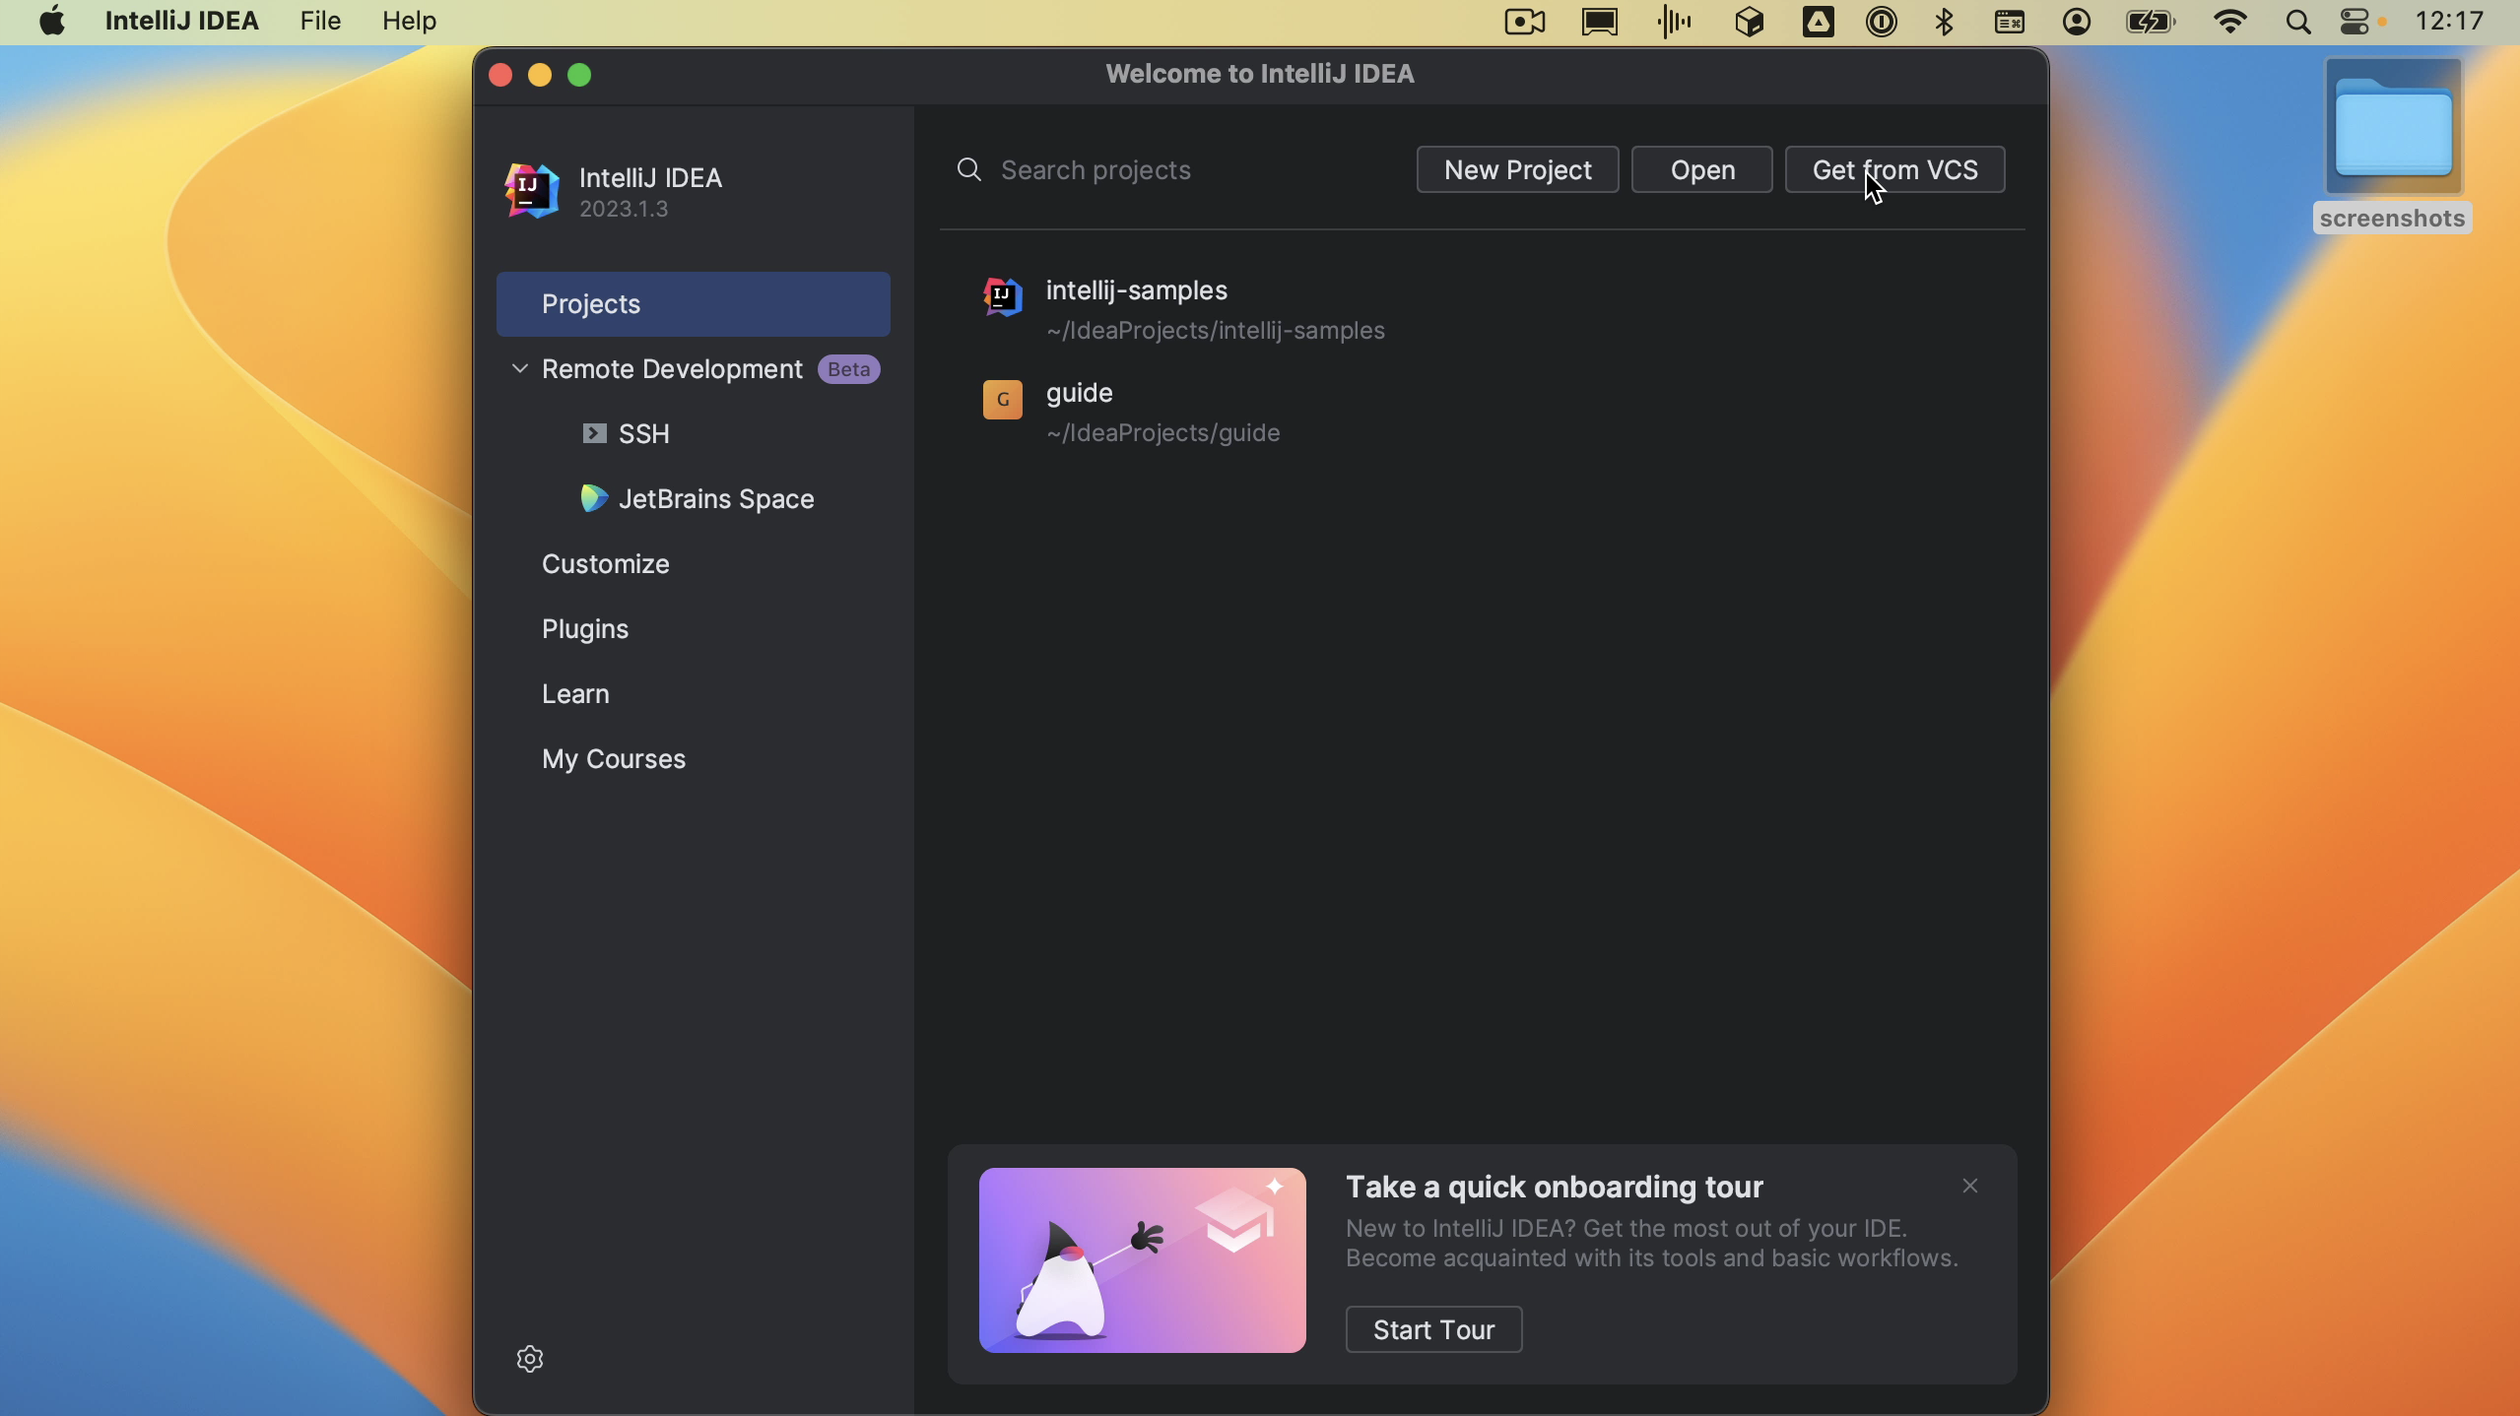
When we open IntelliJ IDEA and don’t already have a project open, we’ll see the Welcome screen. Here we have the option to Get from VCS (version control system).

Welcome screen

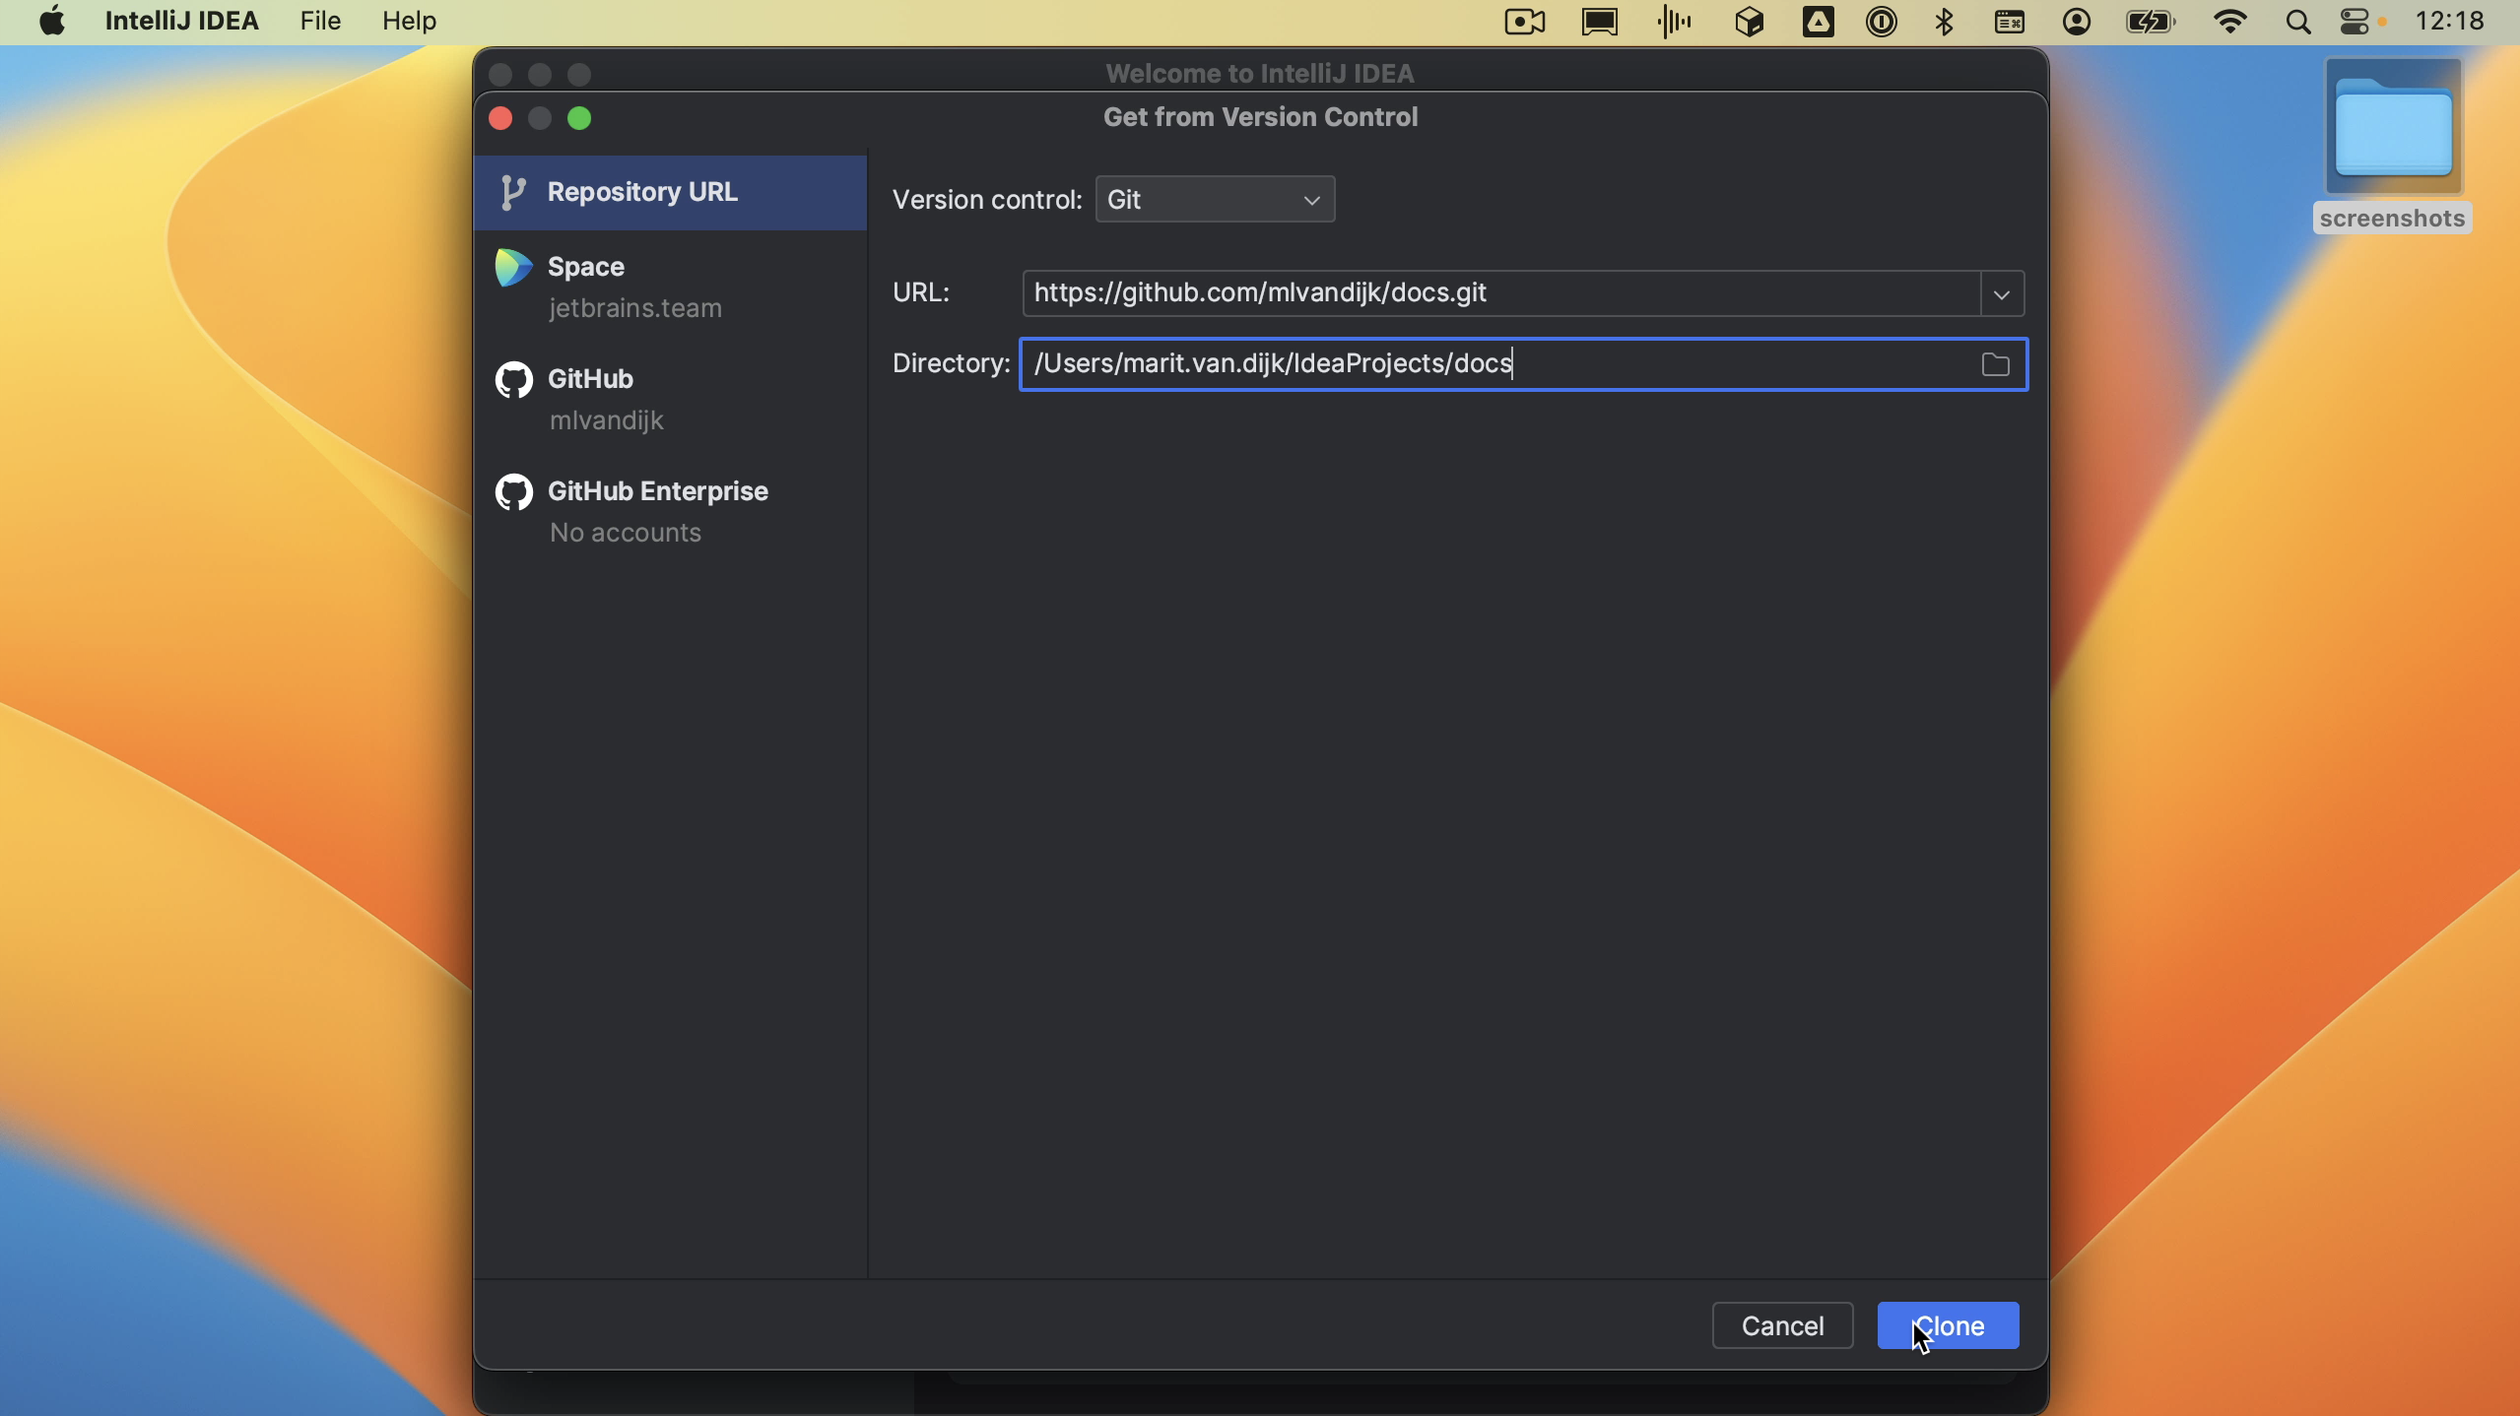
When we click the button, the Get from Version Control dialog opens. We can paste the URL we just copied. We can select where we want to store this project on our computer; let’s stick with the default. When we select Clone, IntelliJ IDEA will clone the GitHub repository to the selected directory.

Clone project

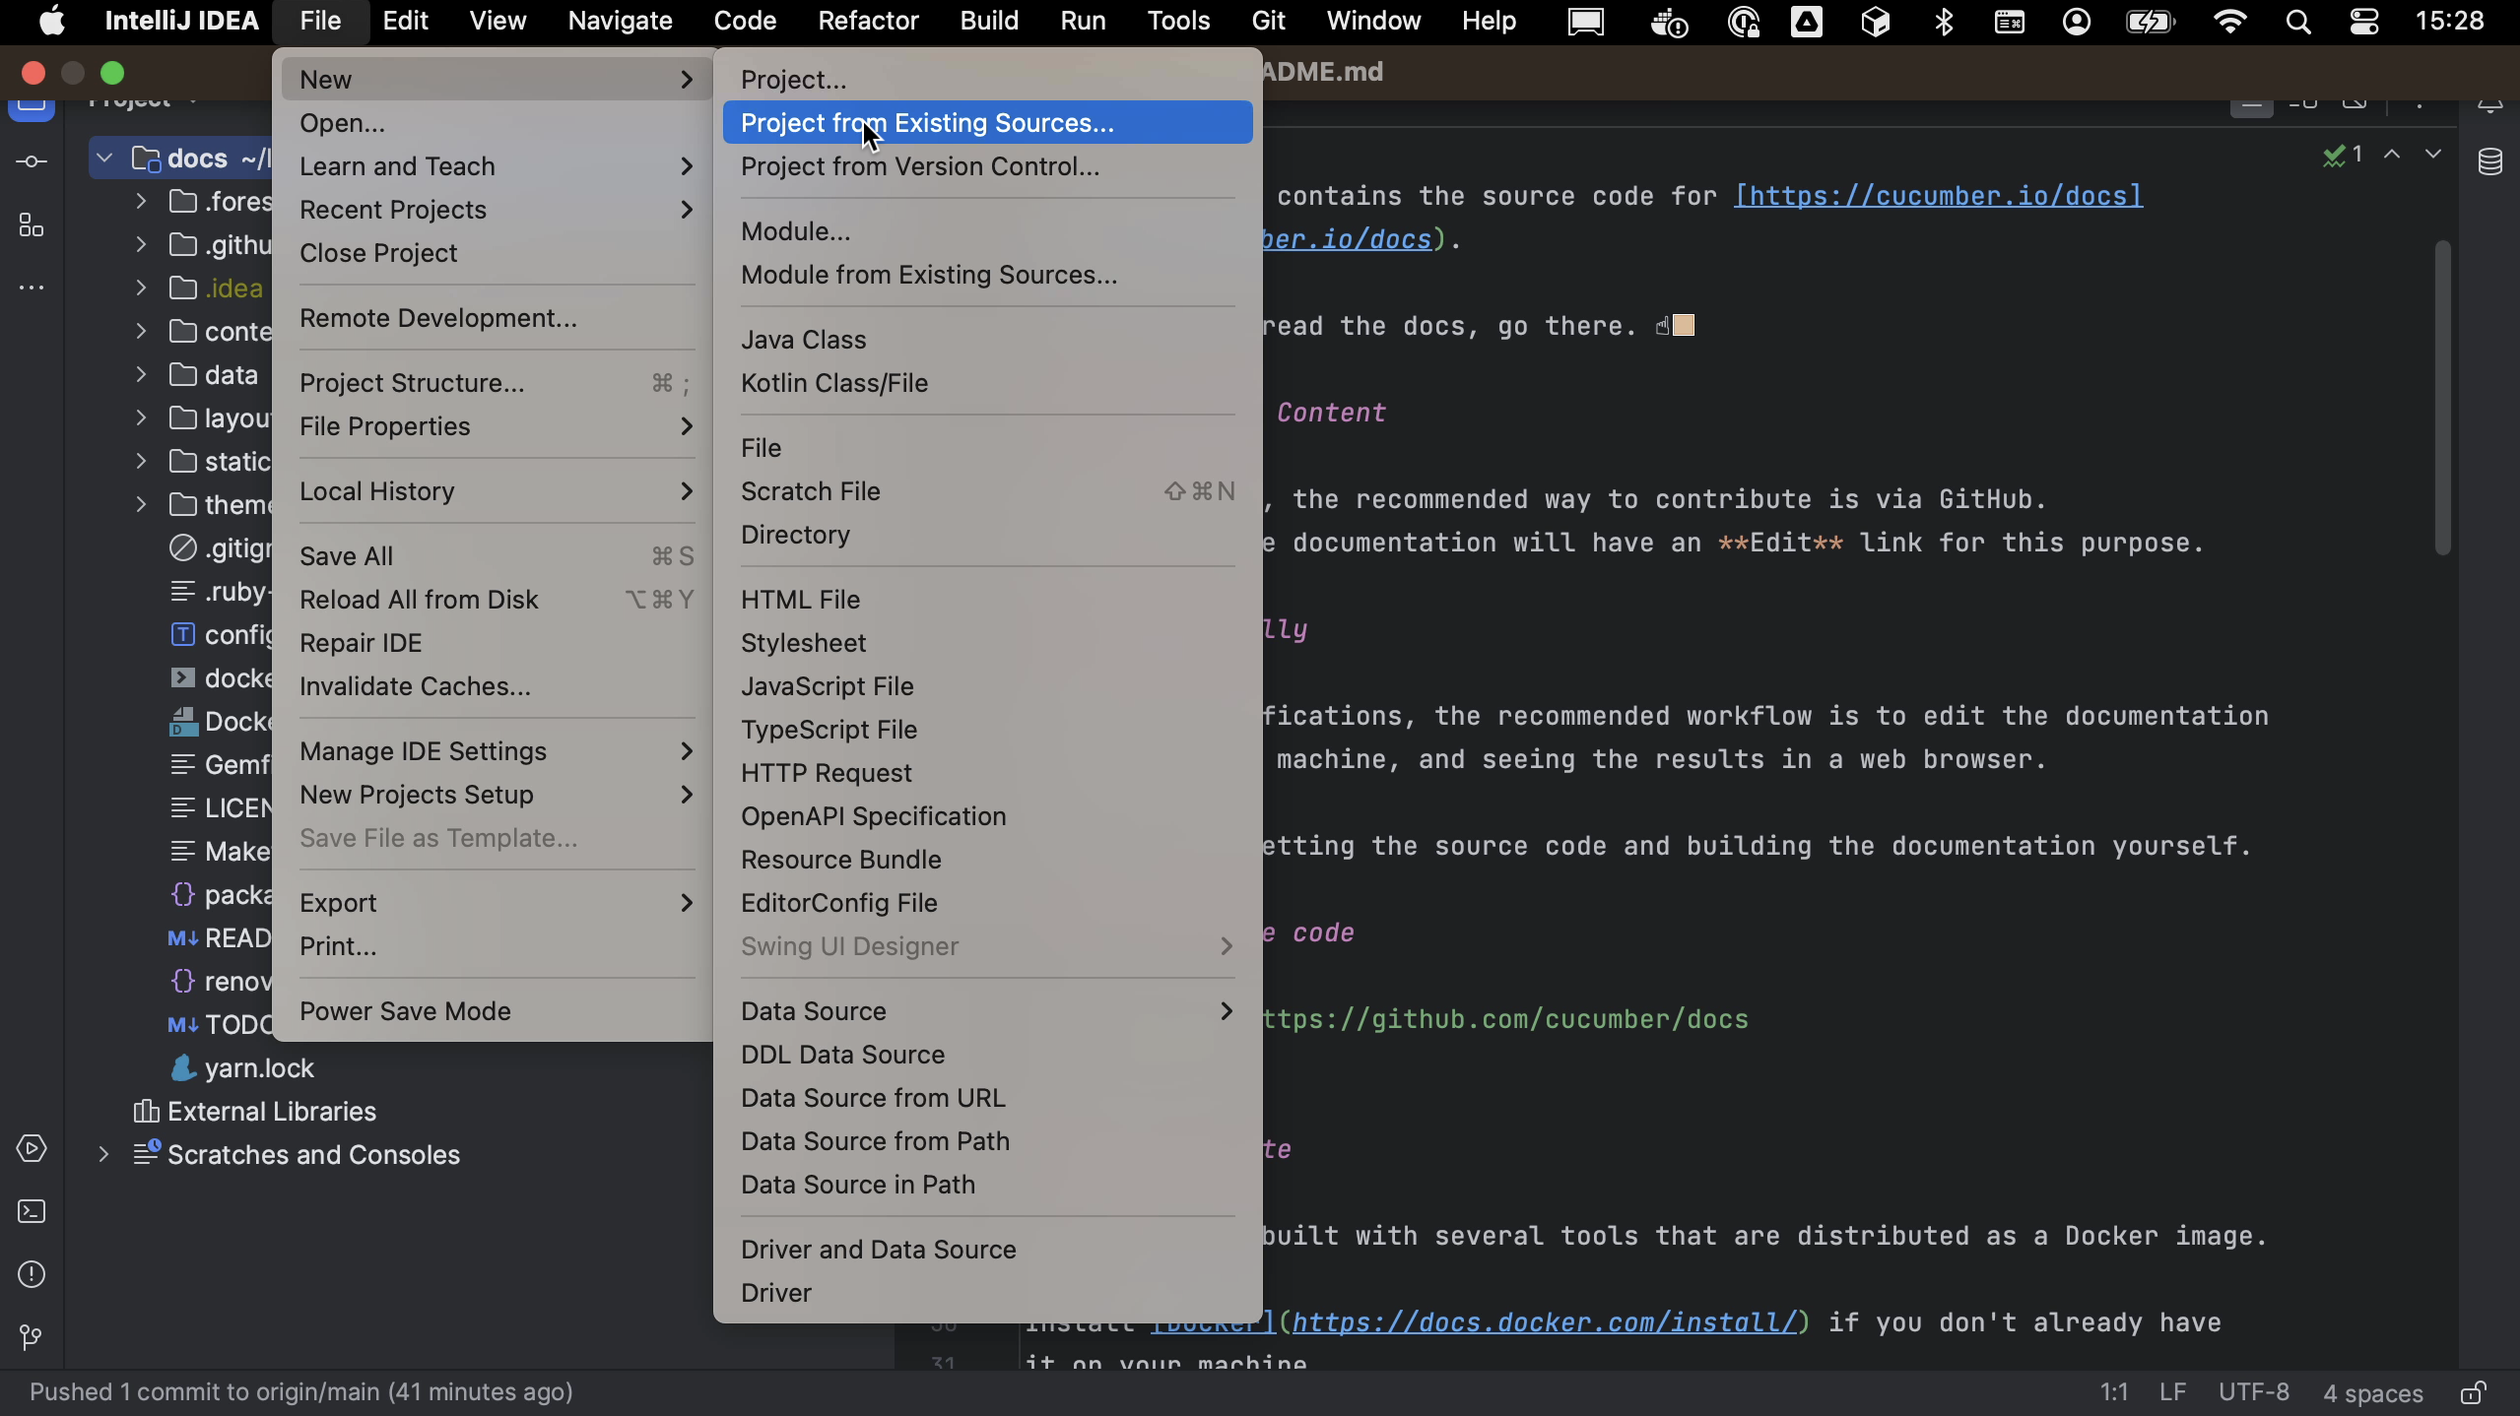
If we already have a project open, we can open the Get from Version Control dialog by going to File > New > Project from version control.

New Project from version control menu

IntelliJ IDEA will open the project on our machine.

Making and committing our changes

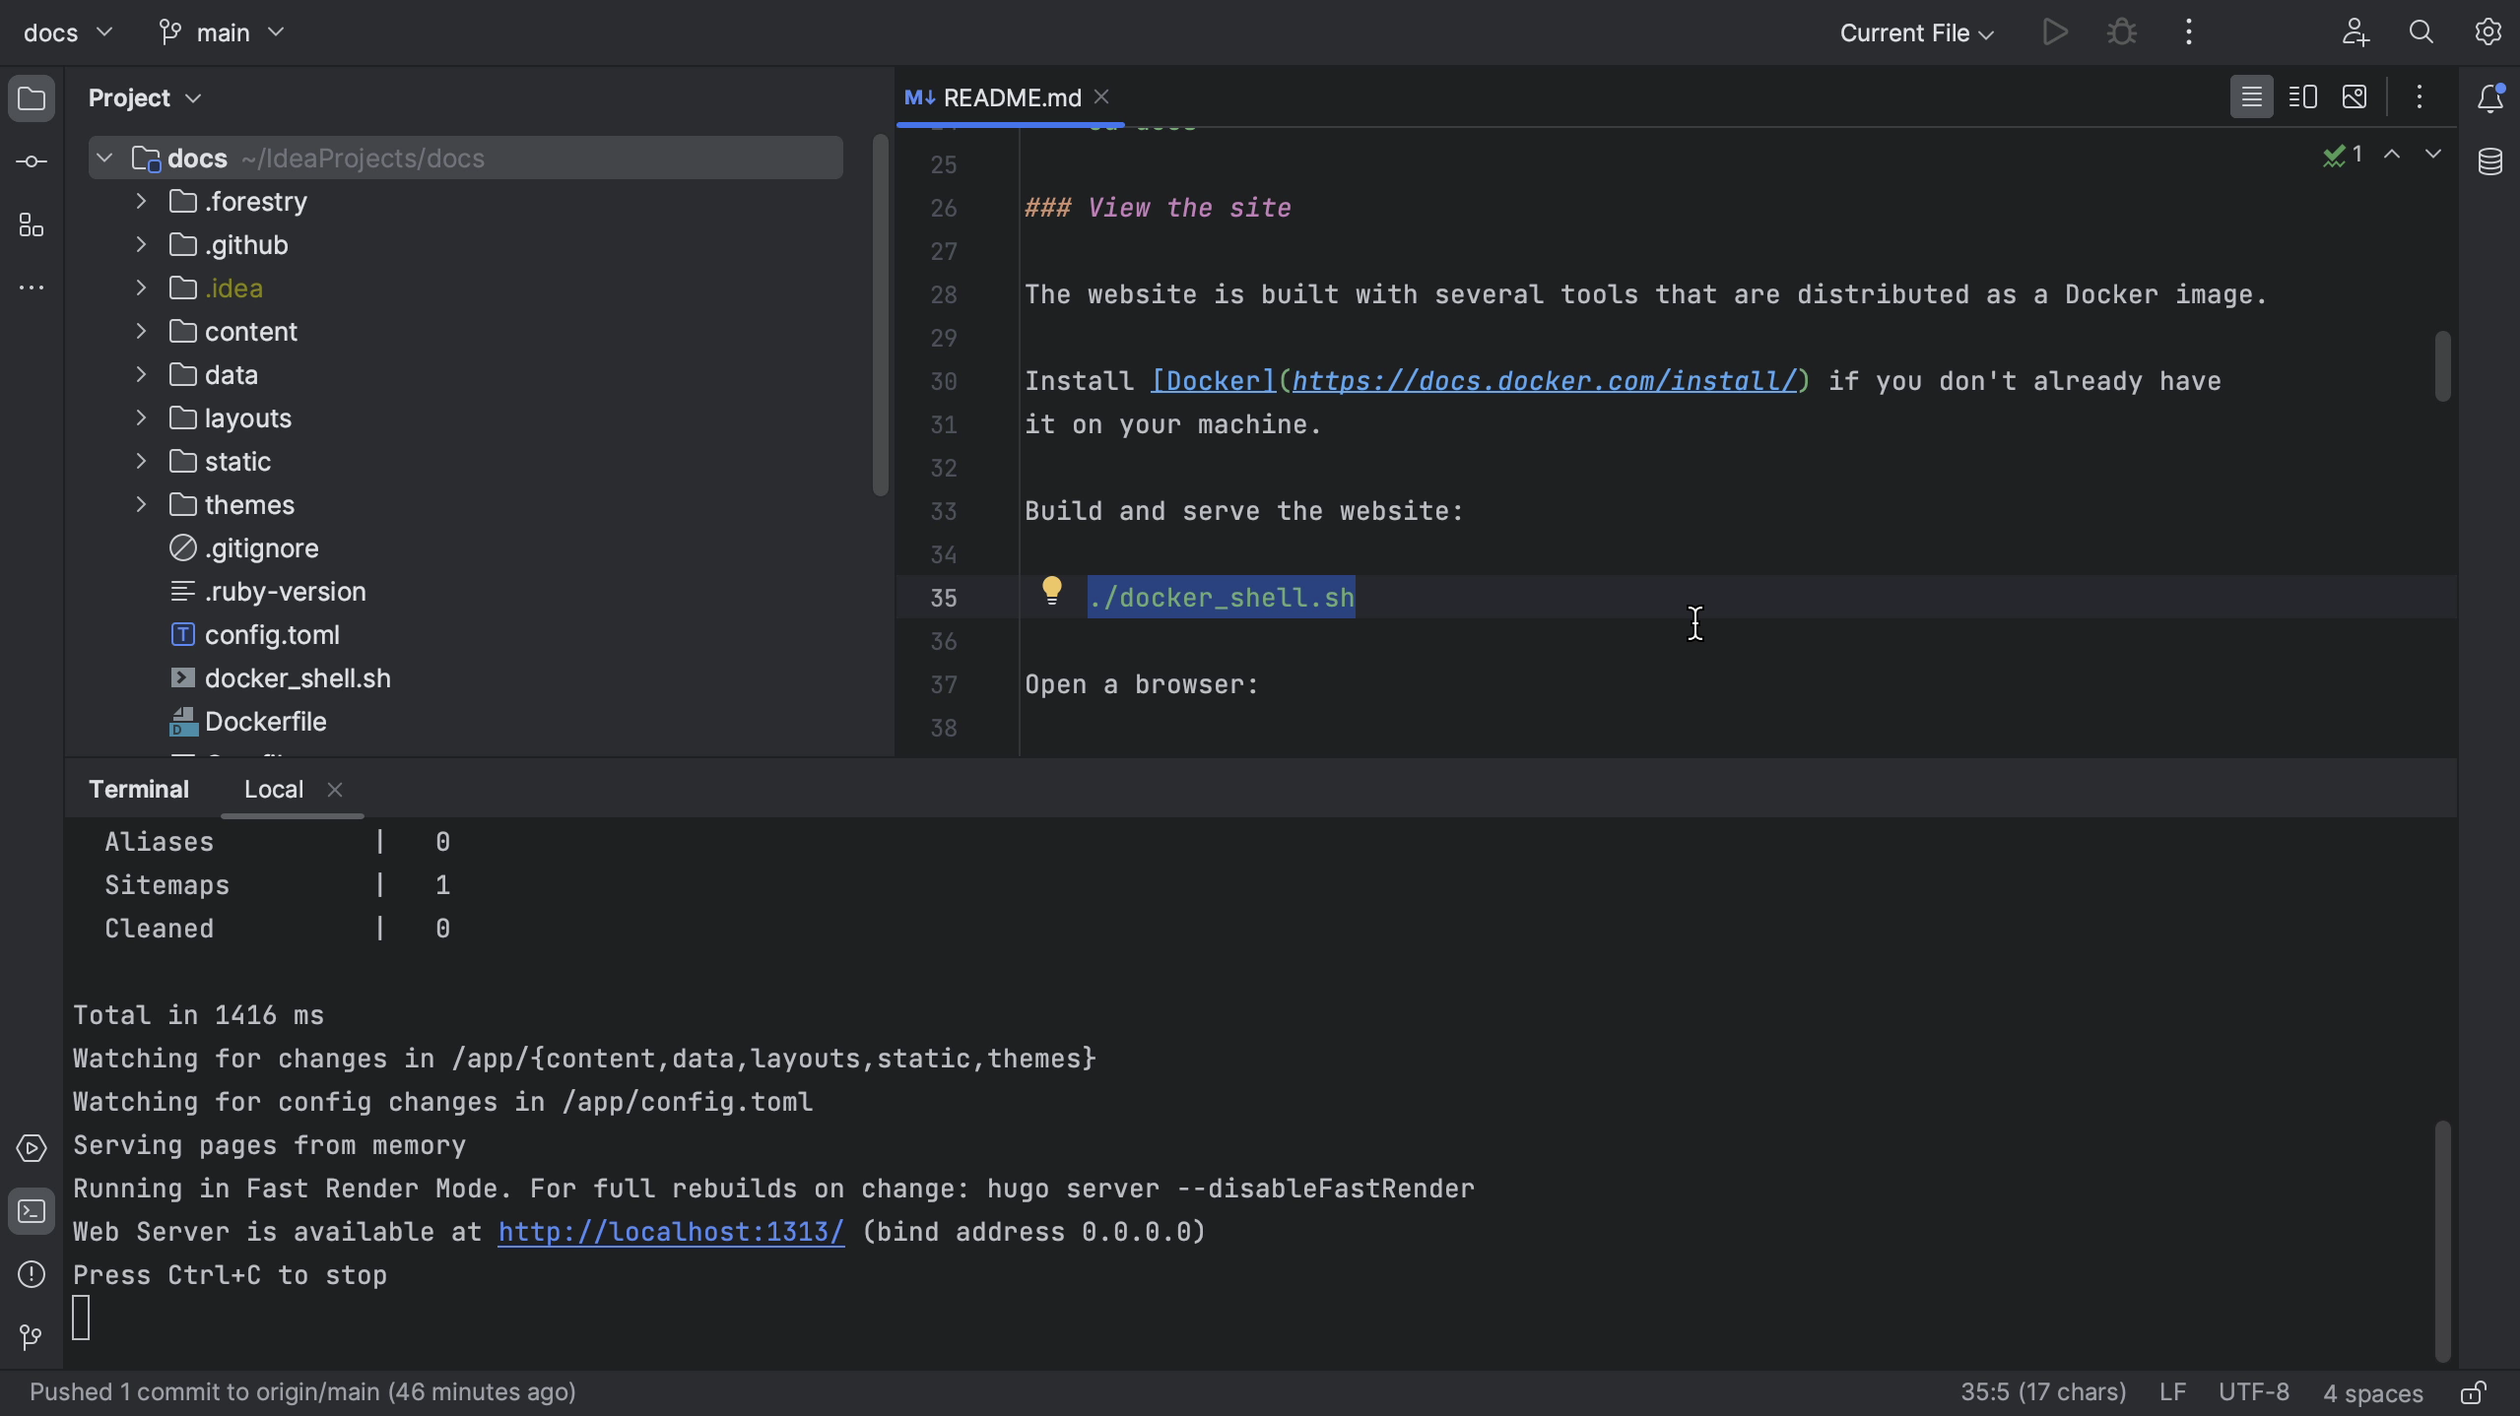
Before making any changes, we’ll want to make sure that we can build the project. Hopefully, how to build the project will be described in the README, as it is for this example. Let’s open the terminal and build the project as described. In this example, we need Docker, which is already installed and running.

Build the project

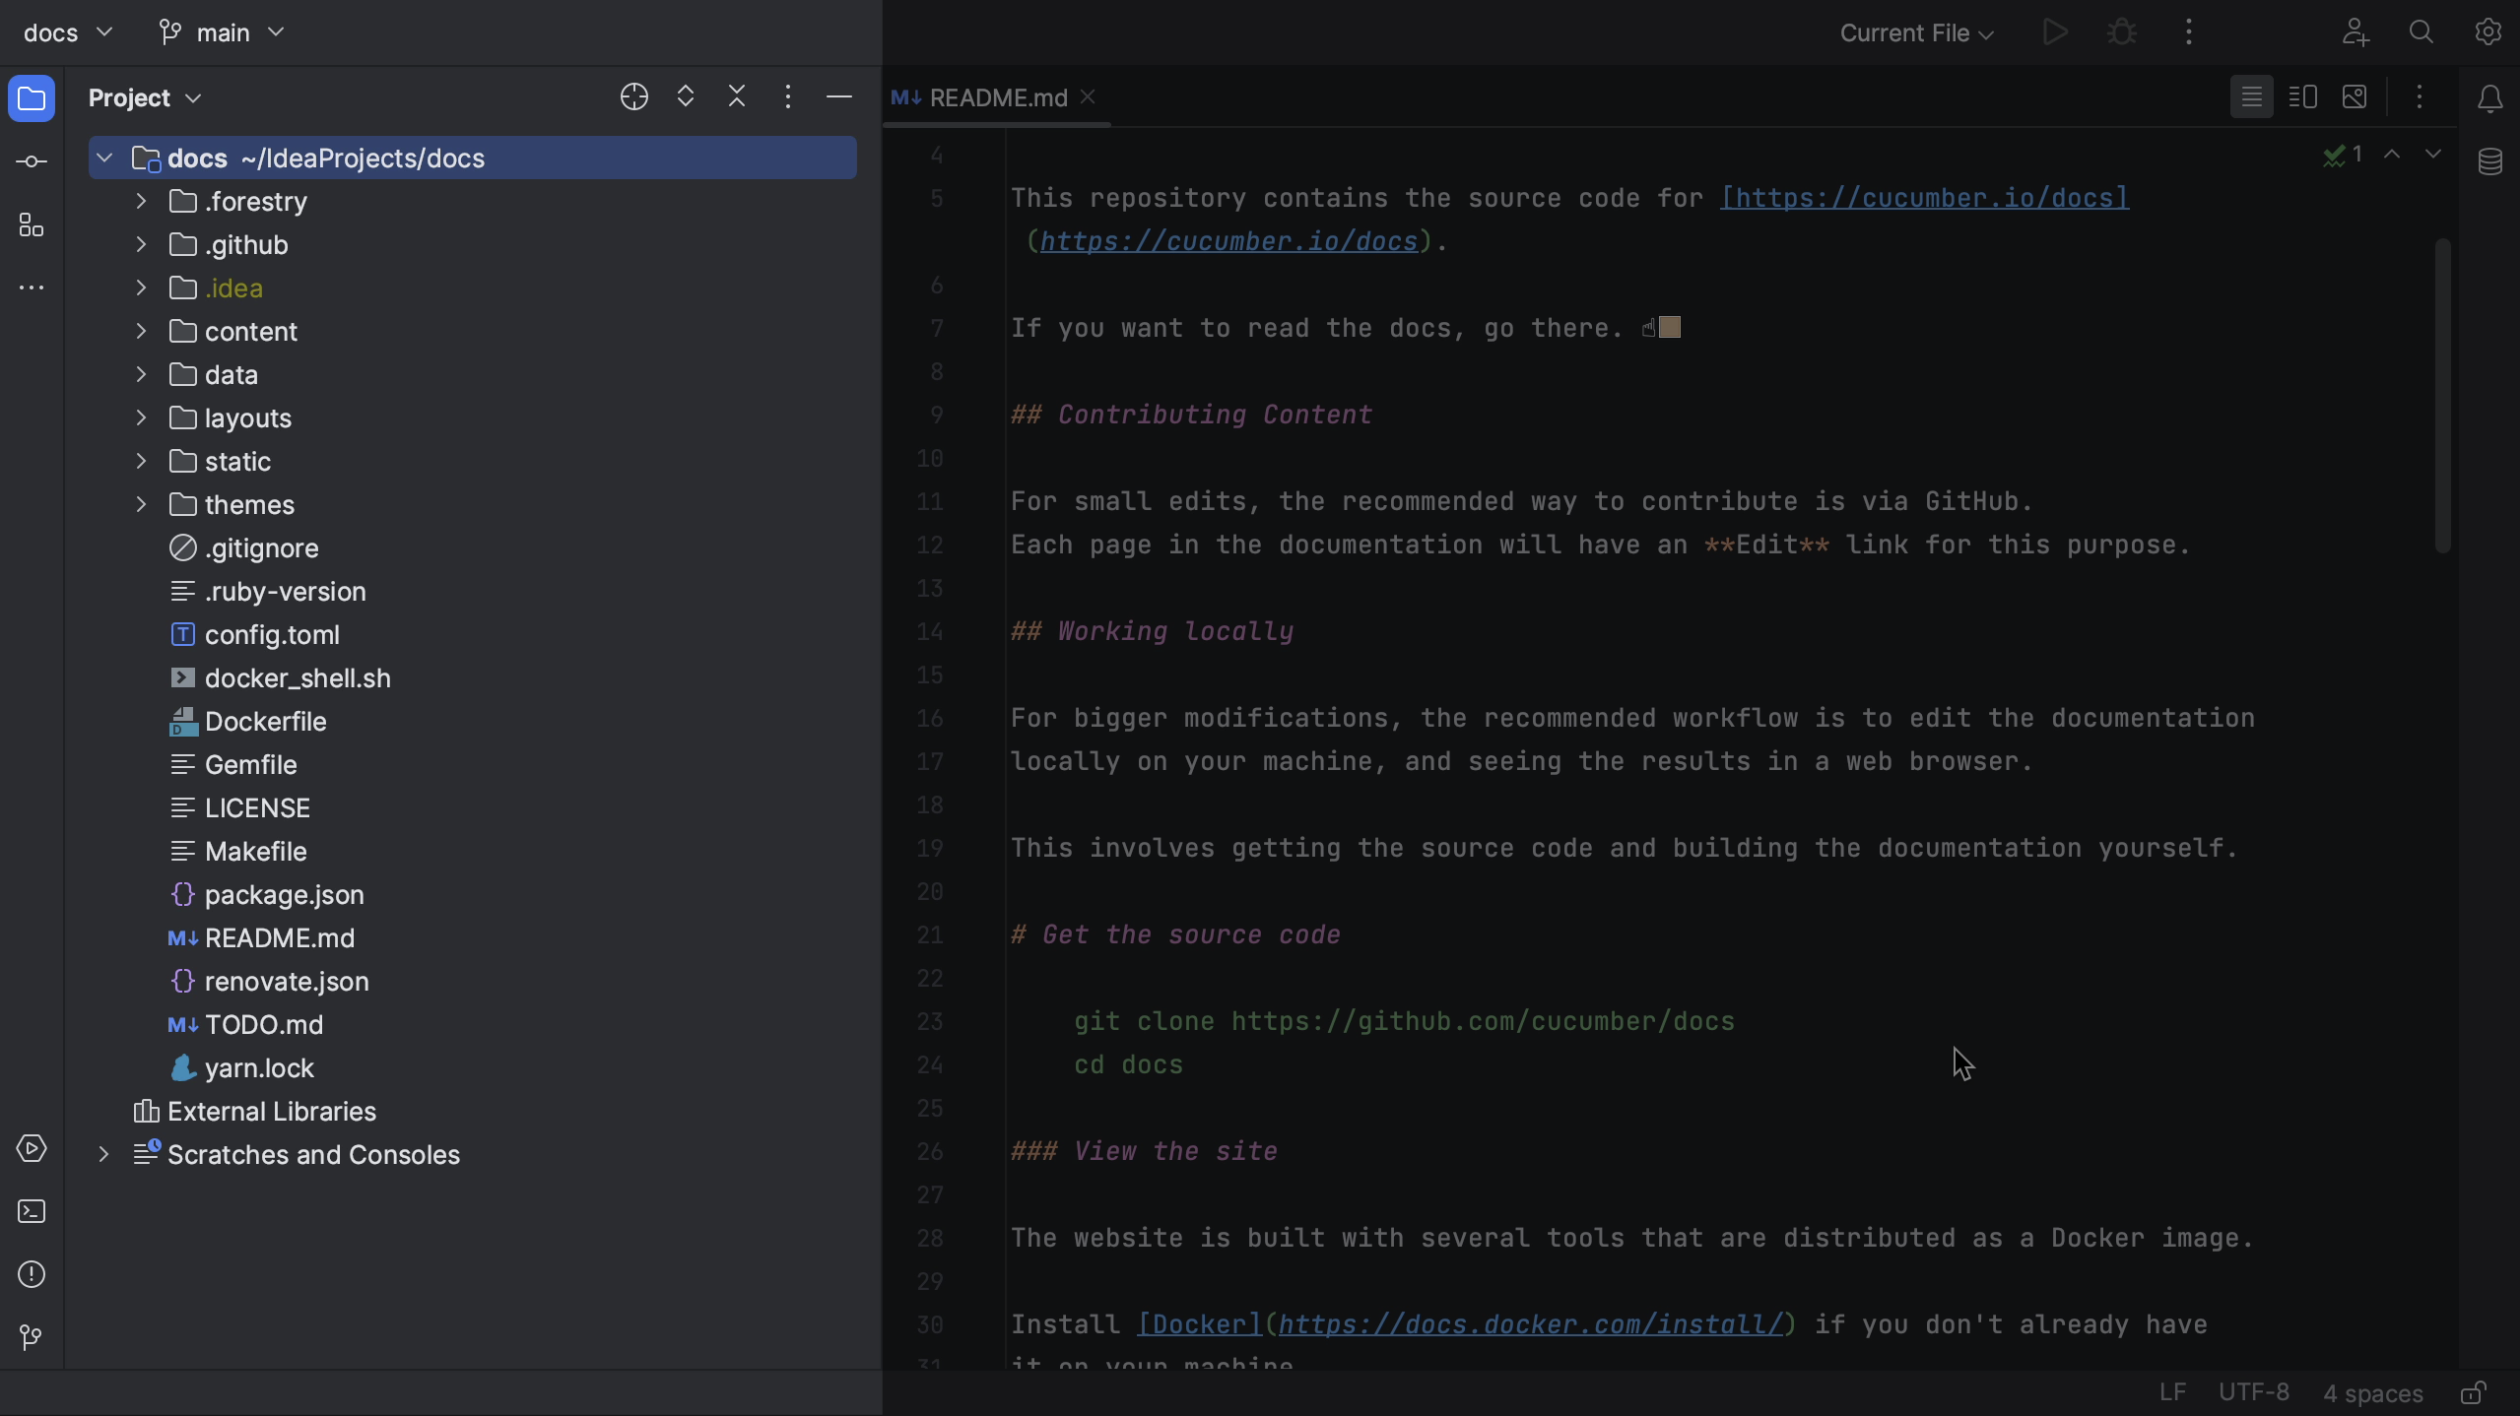
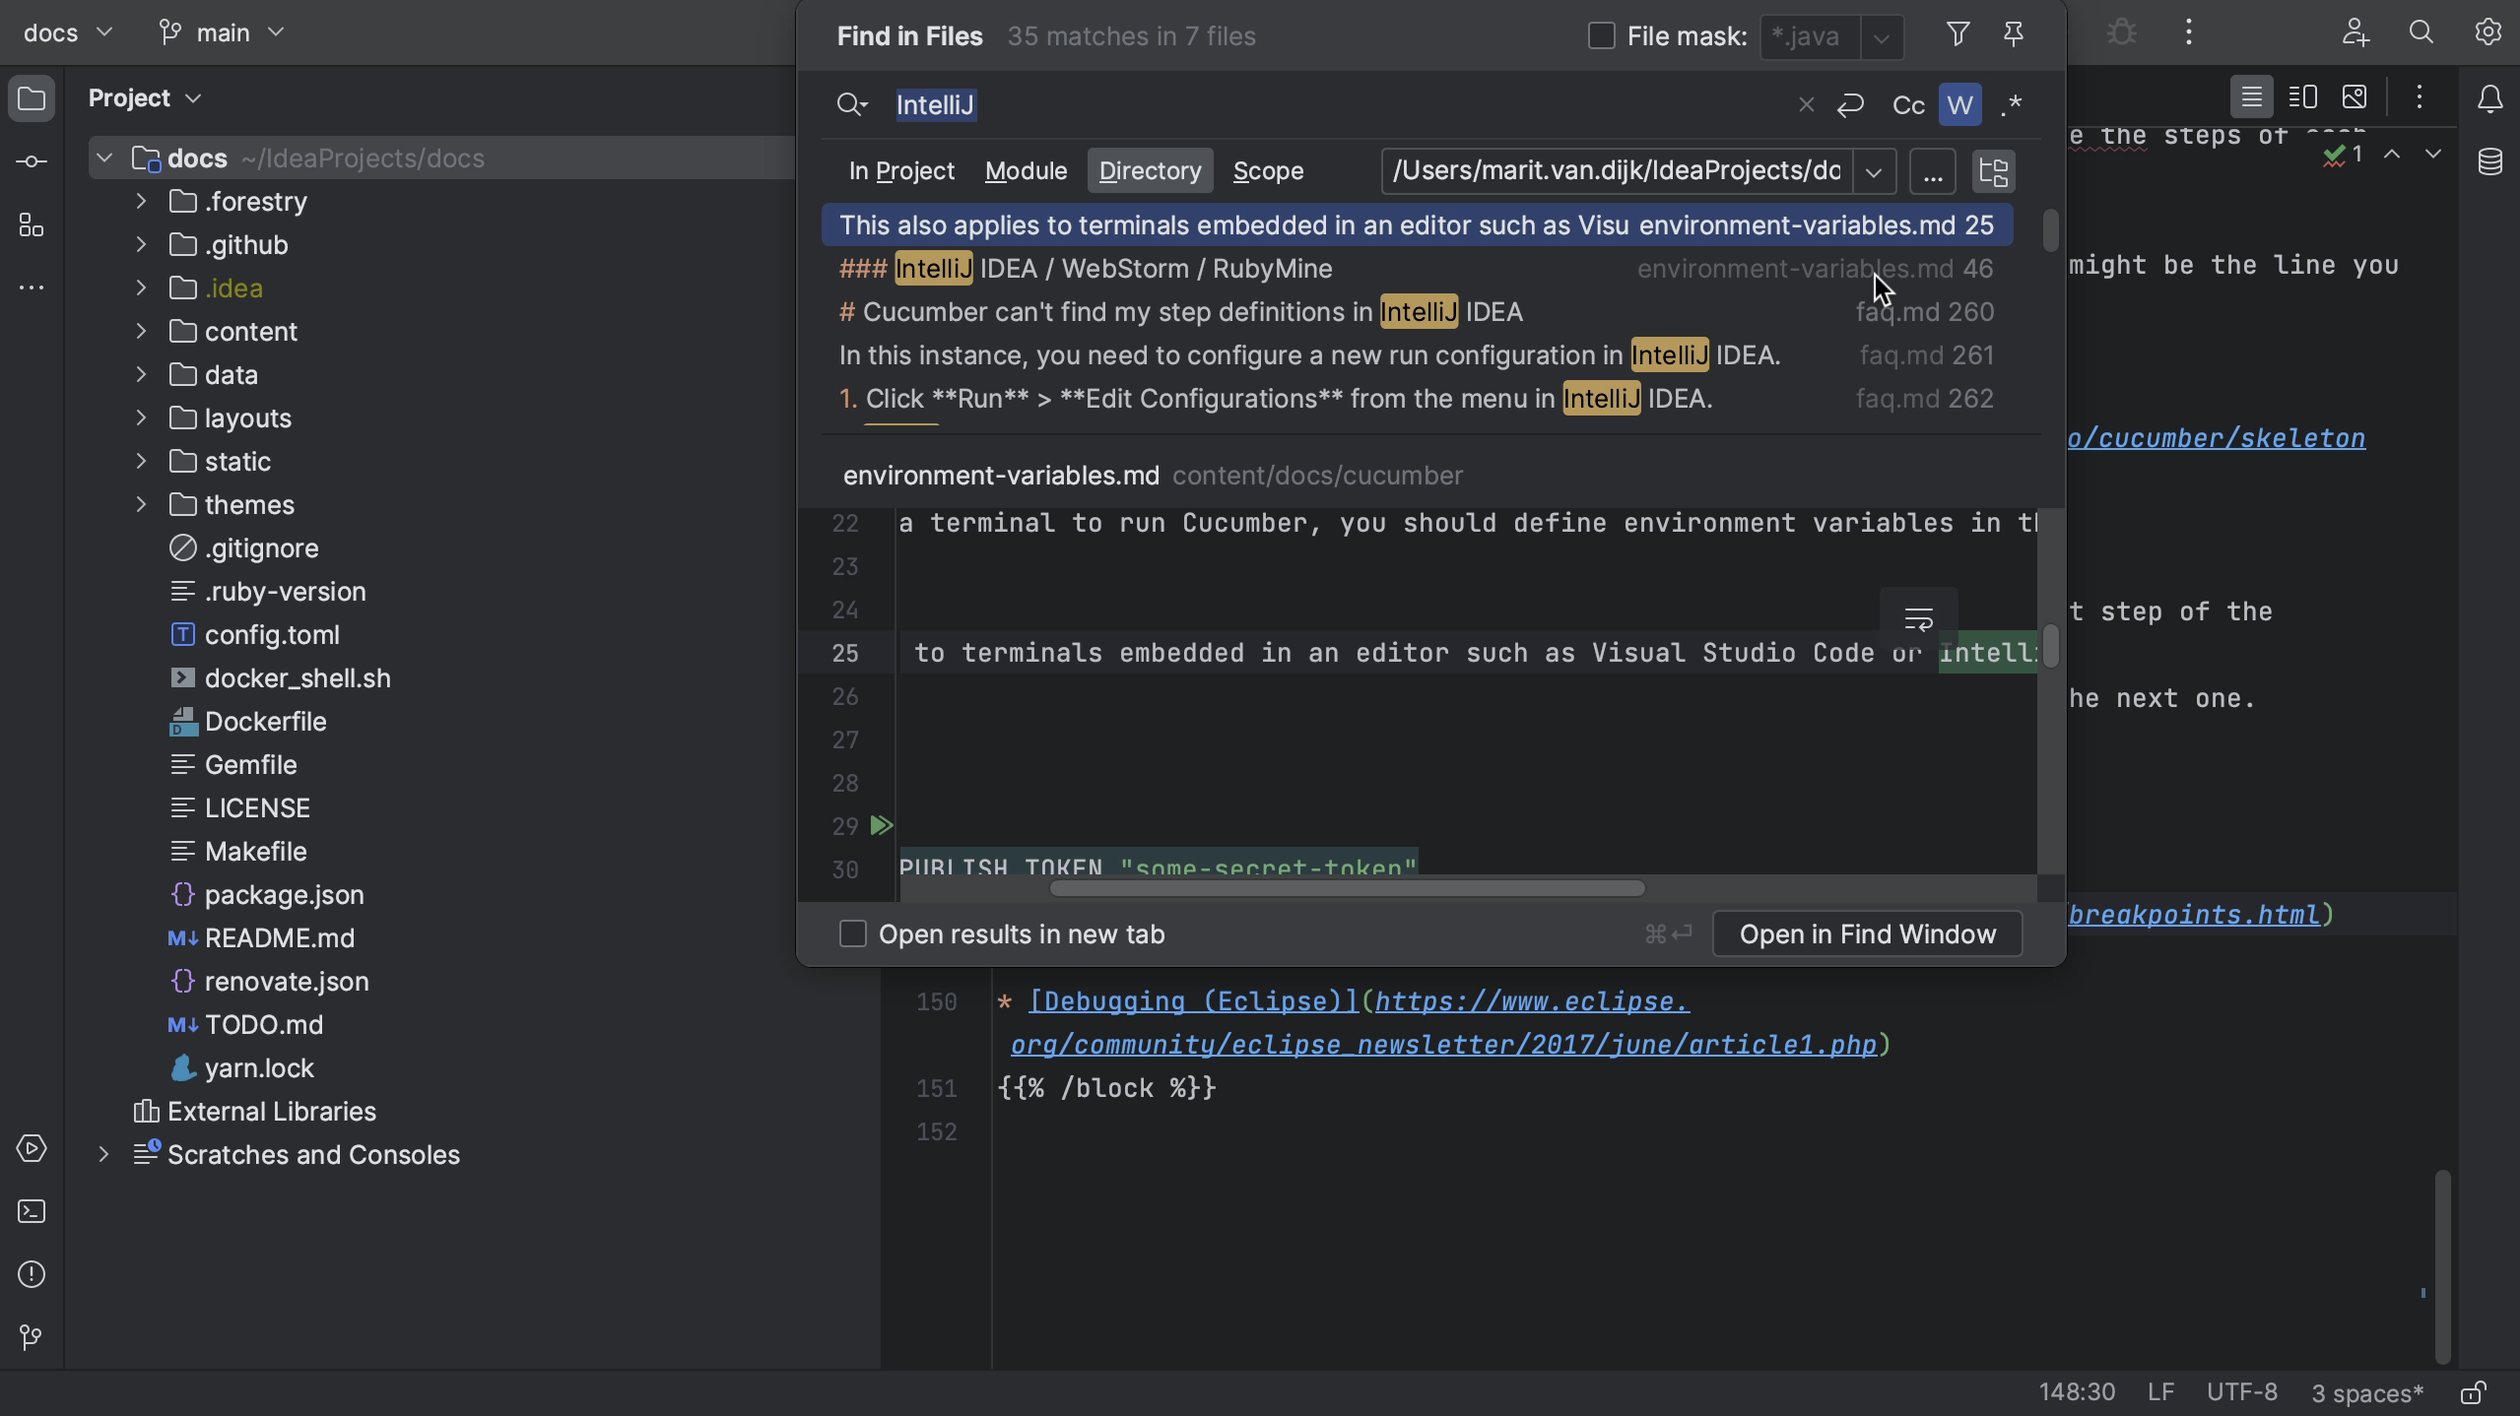
Now that we know we can build the project, we can start making changes. First, we need to look for the right place to make the change. We might navigate the project in the Project tool window (⌘1 on macOS, or Alt+1 on Windows/Linux), or look for a specific file or code snippet using Find in Files (⌘⇧F on macOS, or Ctrl+Shift+F on Windows/Linux).

Project tool window

Find in files

We might want to create a specific branch for our changes.

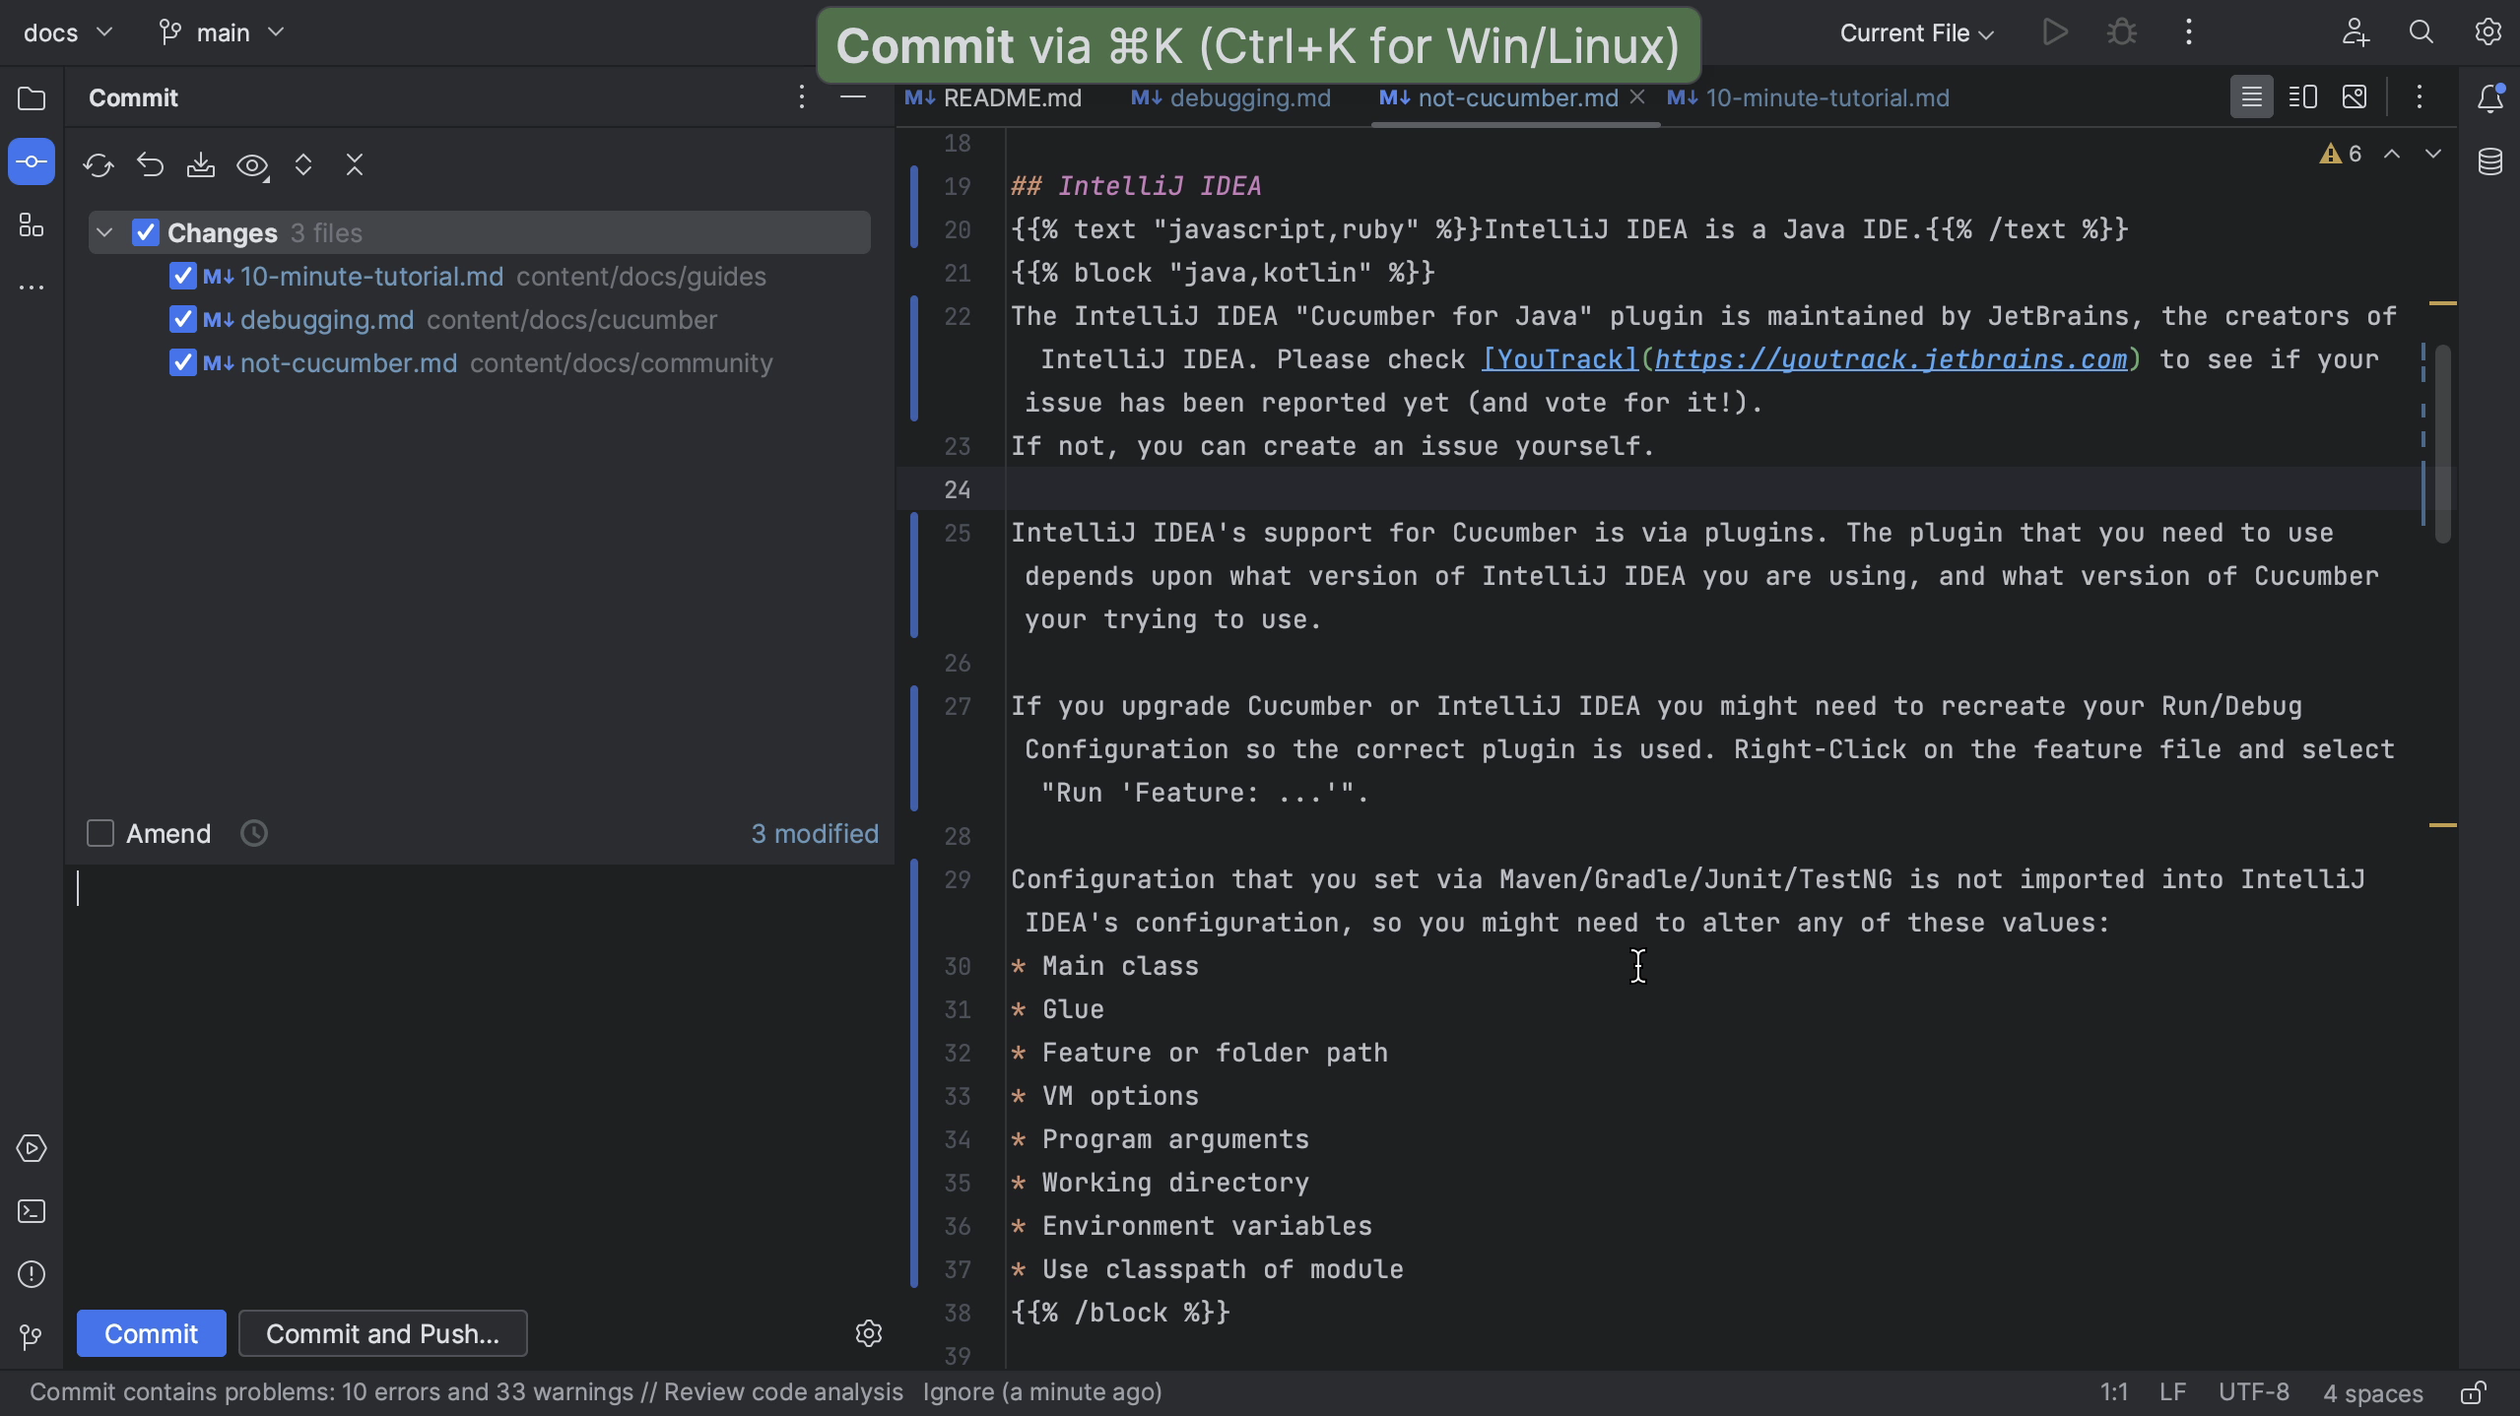
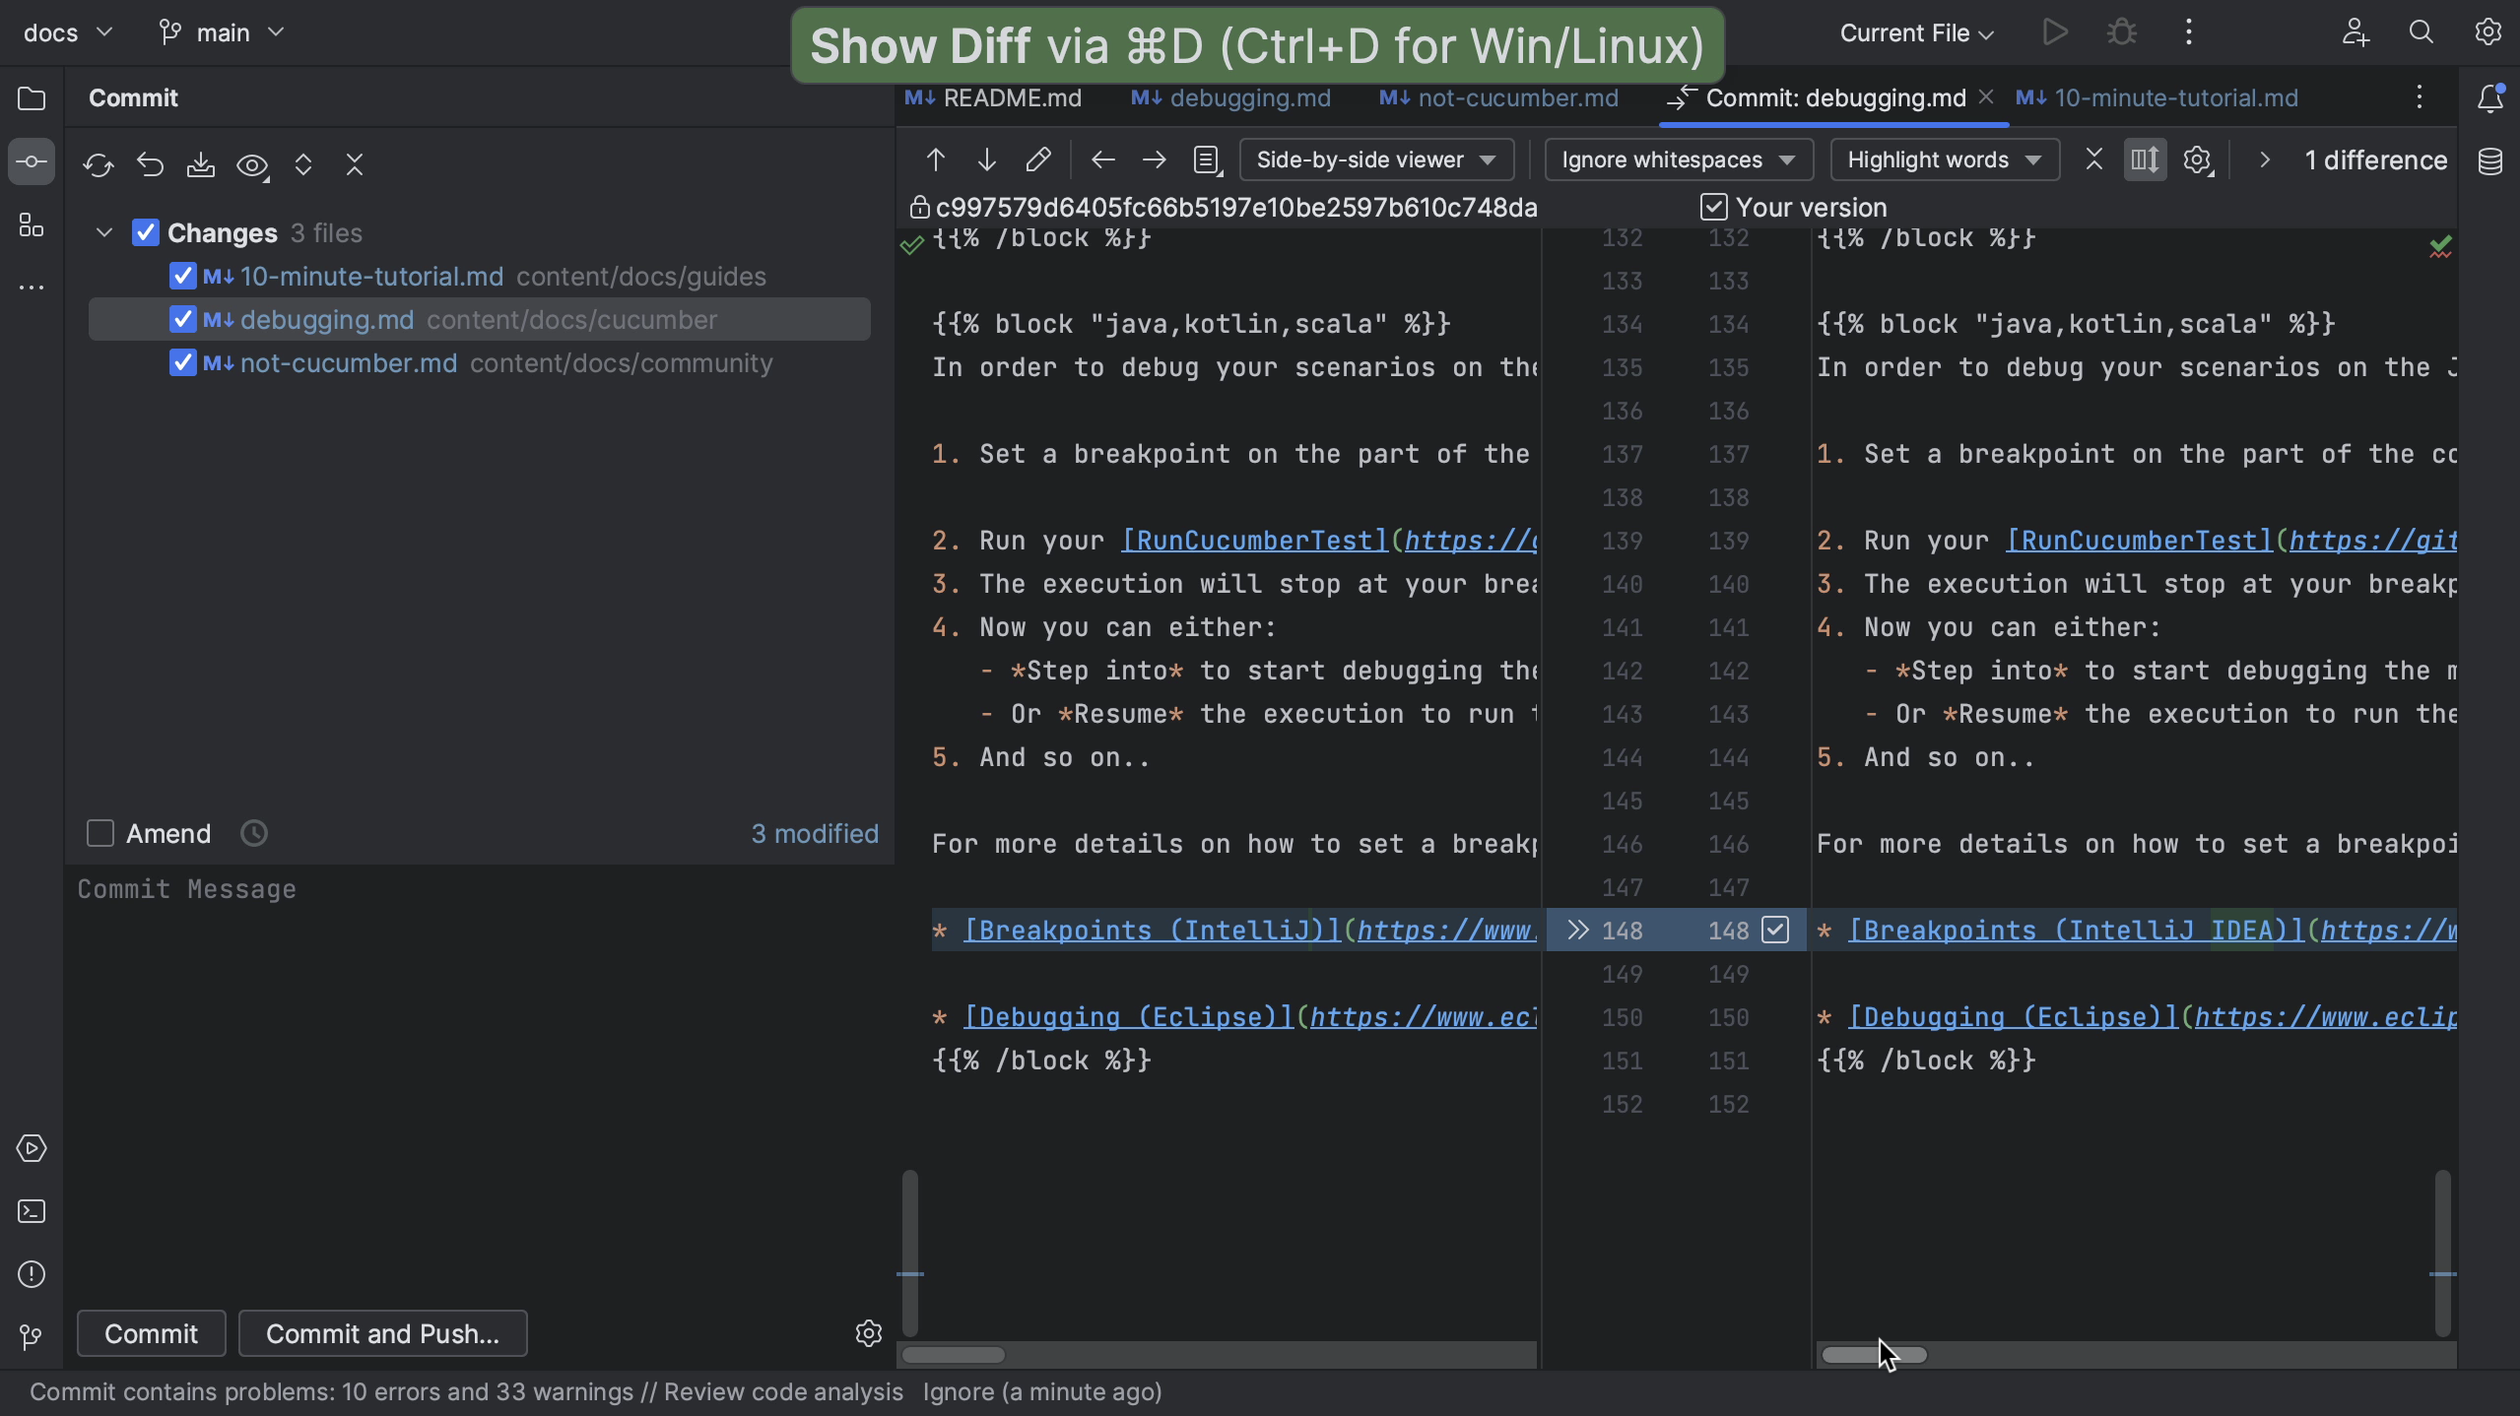
Once we are done making our changes and the project still builds, we can commit our changes (⌘K on macOS, or Ctrl+K on Windows/Linux). We can check our changes in the Commit tool window (⌘1 on macOS, or Alt+1 on Windows/Linux) to see if these are the right files and use Show Diff (⌘D on macOS, or Ctrl+D on Windows/Linux) to see if the changes are correct.

Commit changes

Check the differences

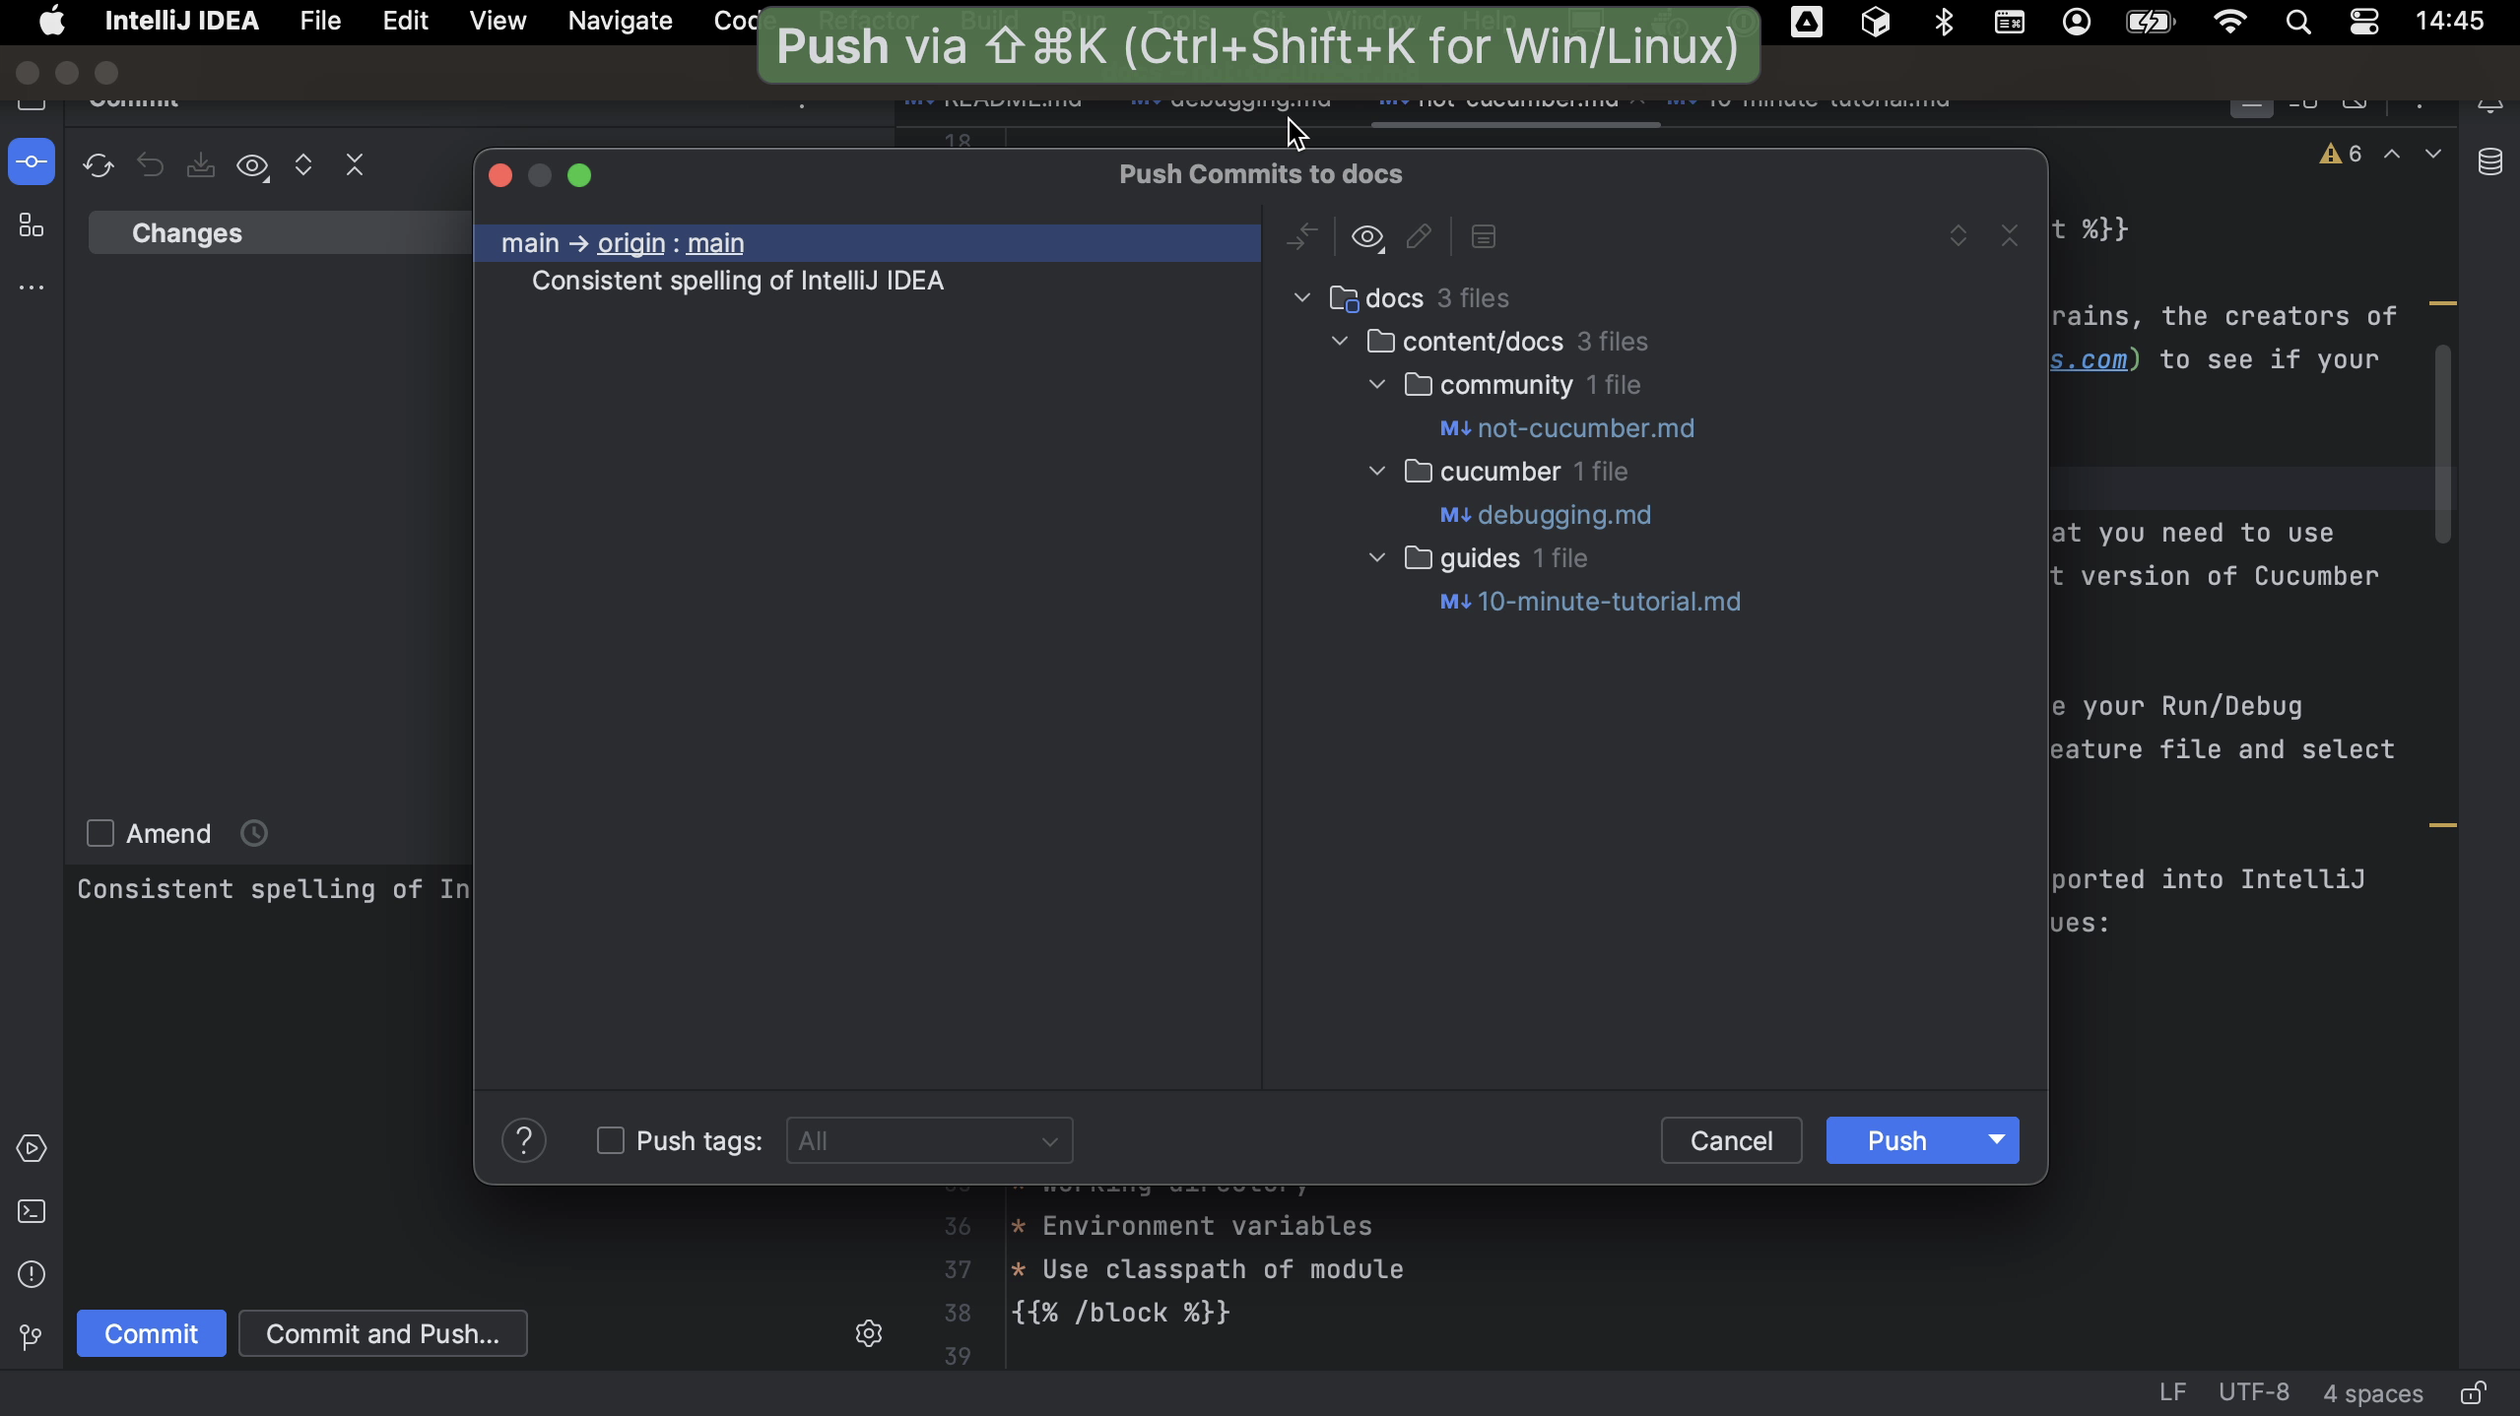
If we don’t have access to the original project, we need to push our code to our fork.

Push

Creating the pull request

Once we are happy with our changes, we can create a pull request.

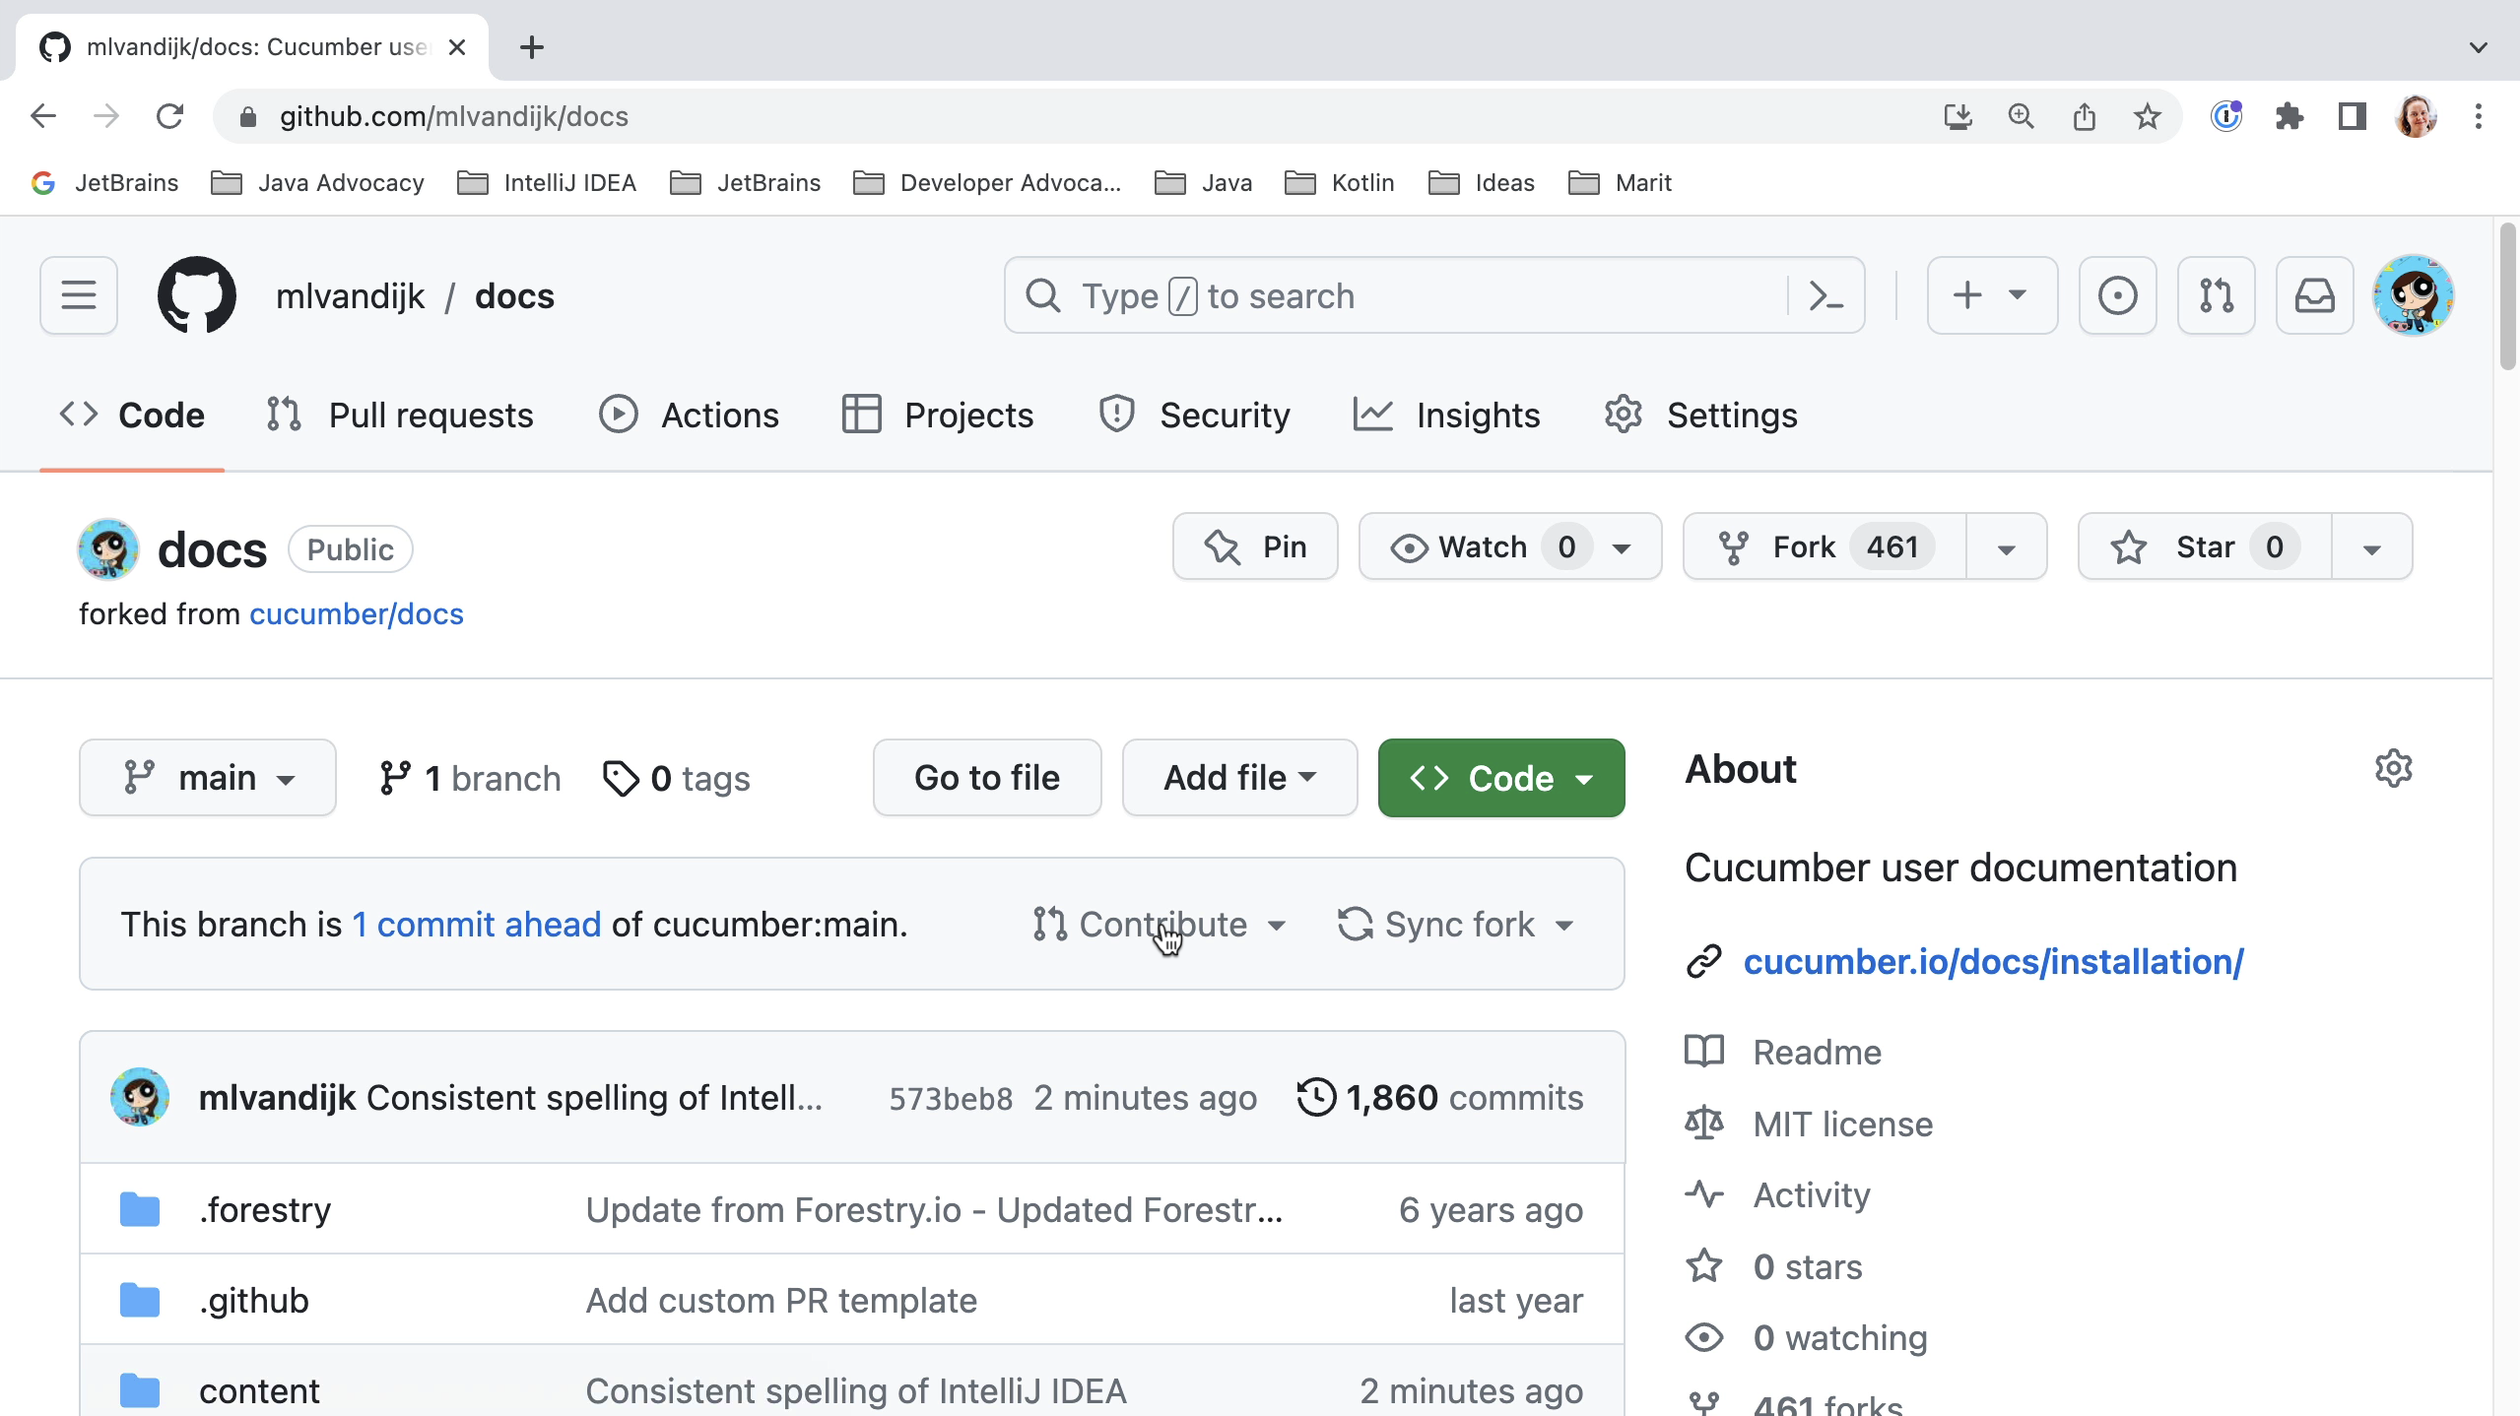
We go back to our GitHub profile and create a pull request from there. After we have pushed our changes, we can see that our fork is 1 commit ahead. We can start creating our pull request by clicking Contribute.

Contribute

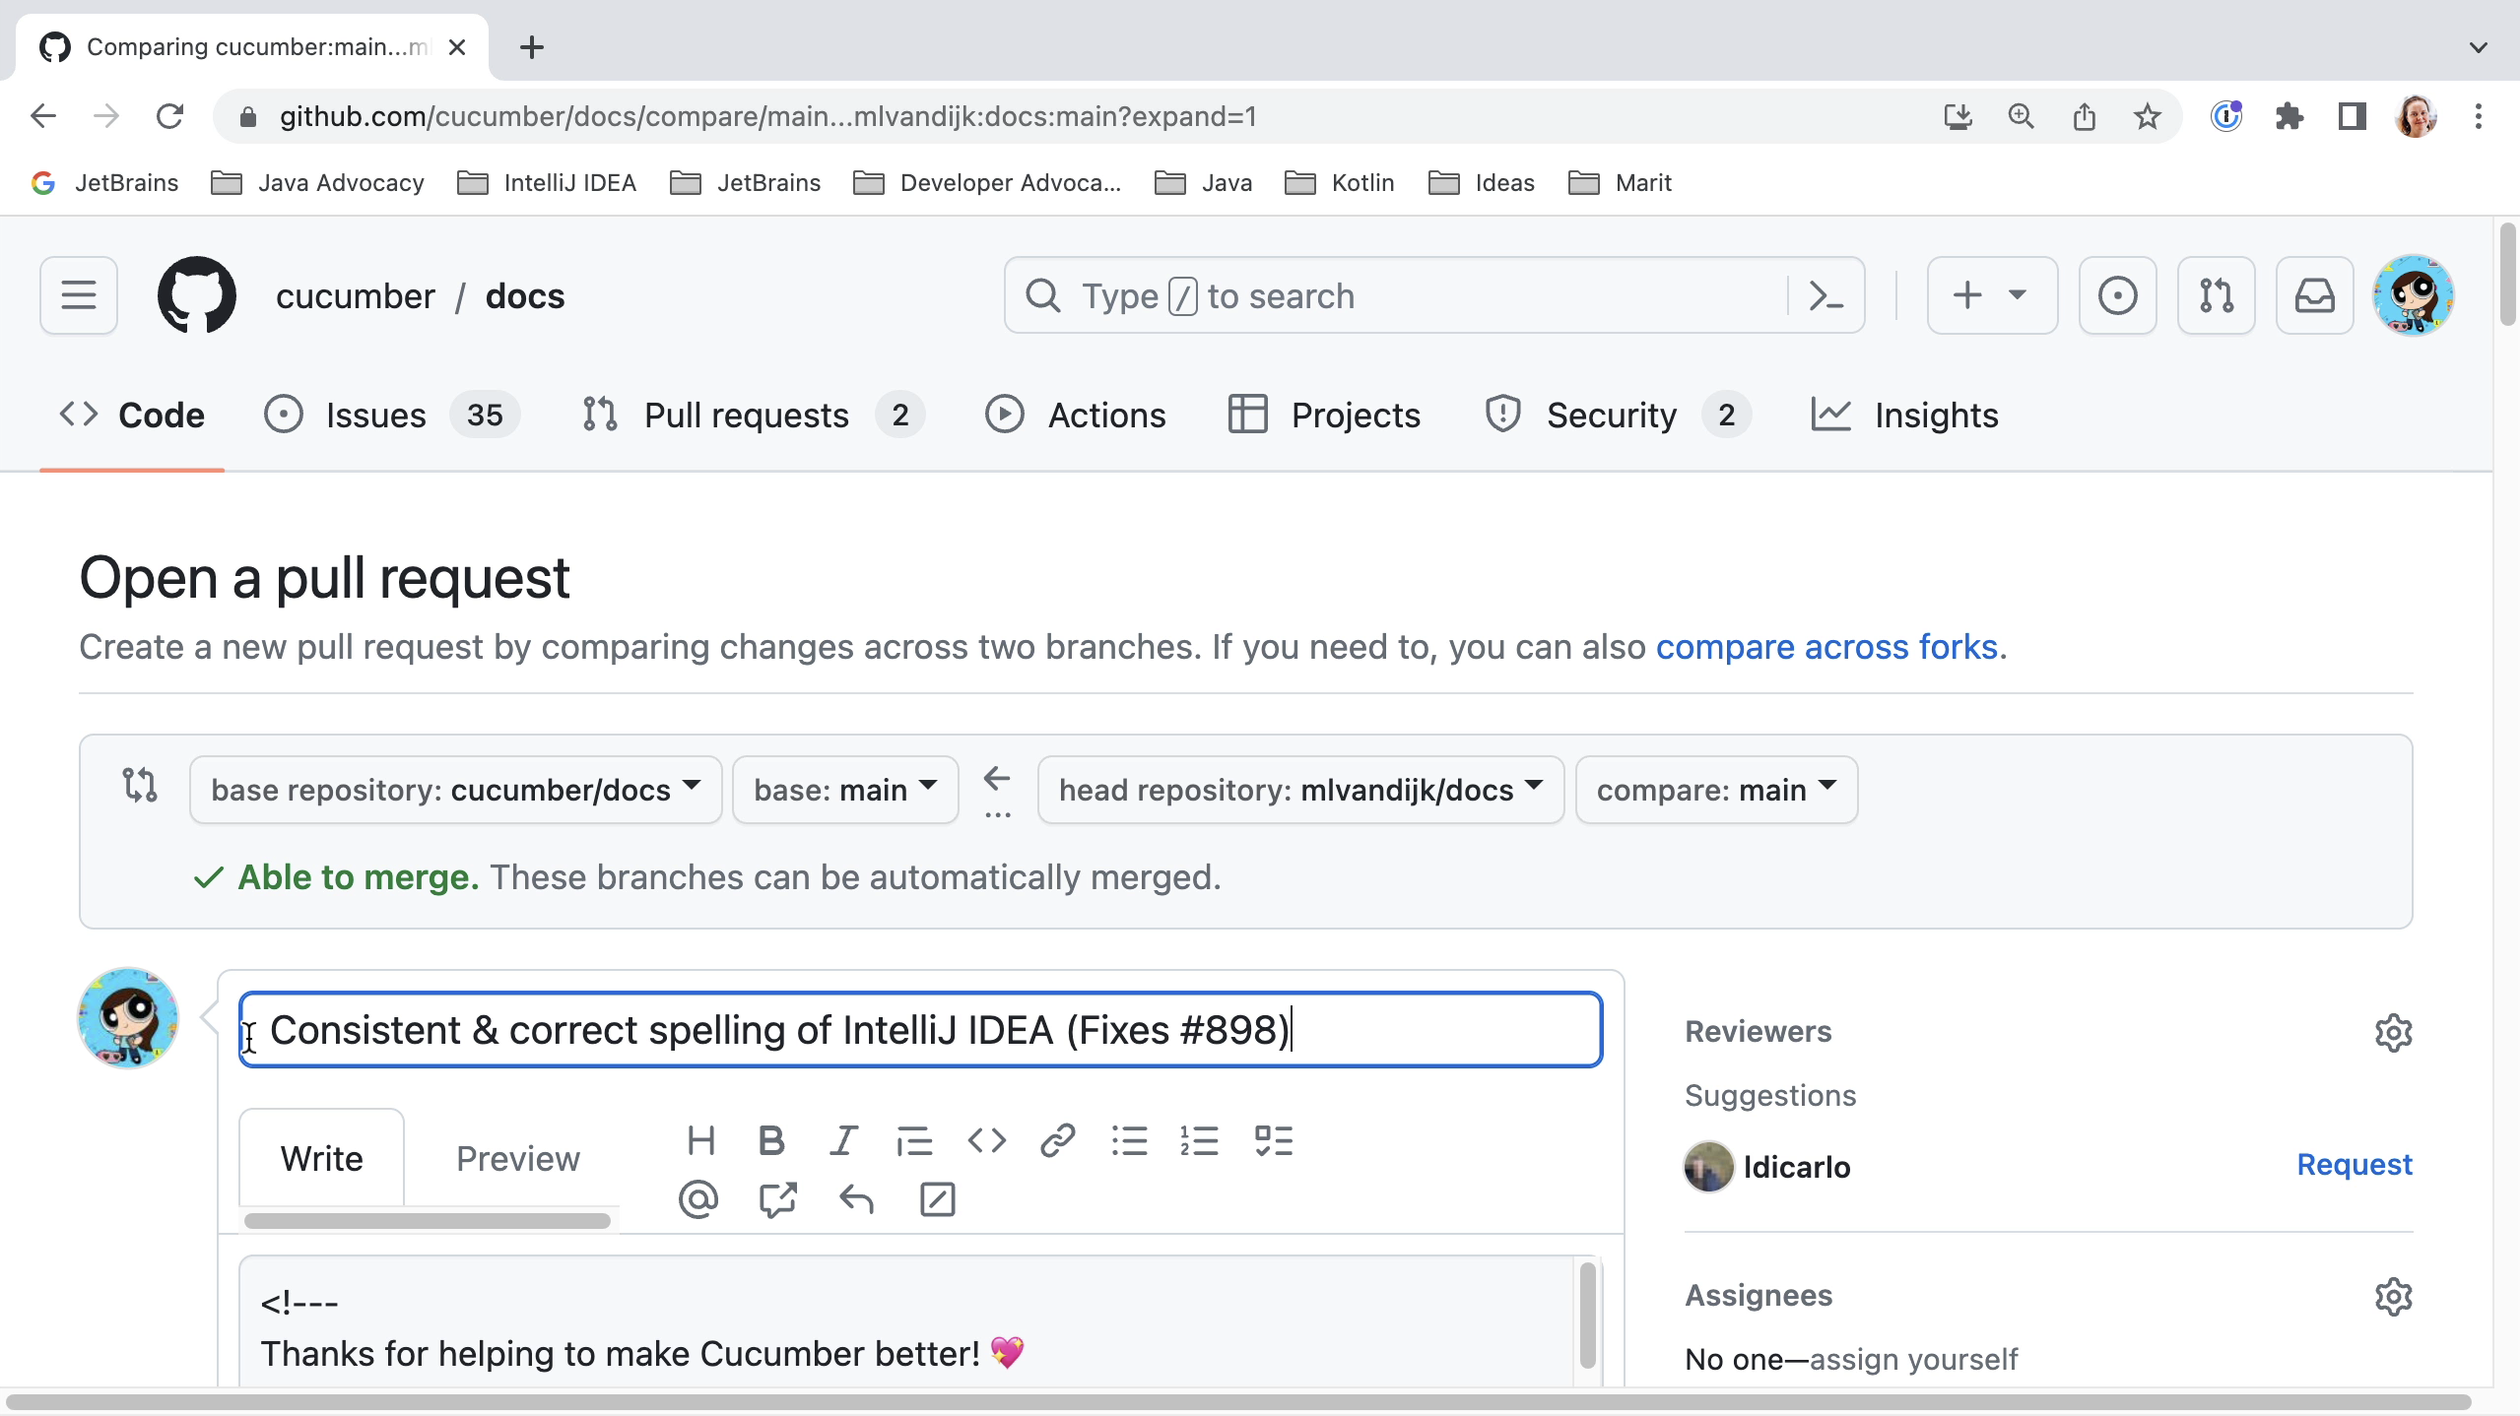
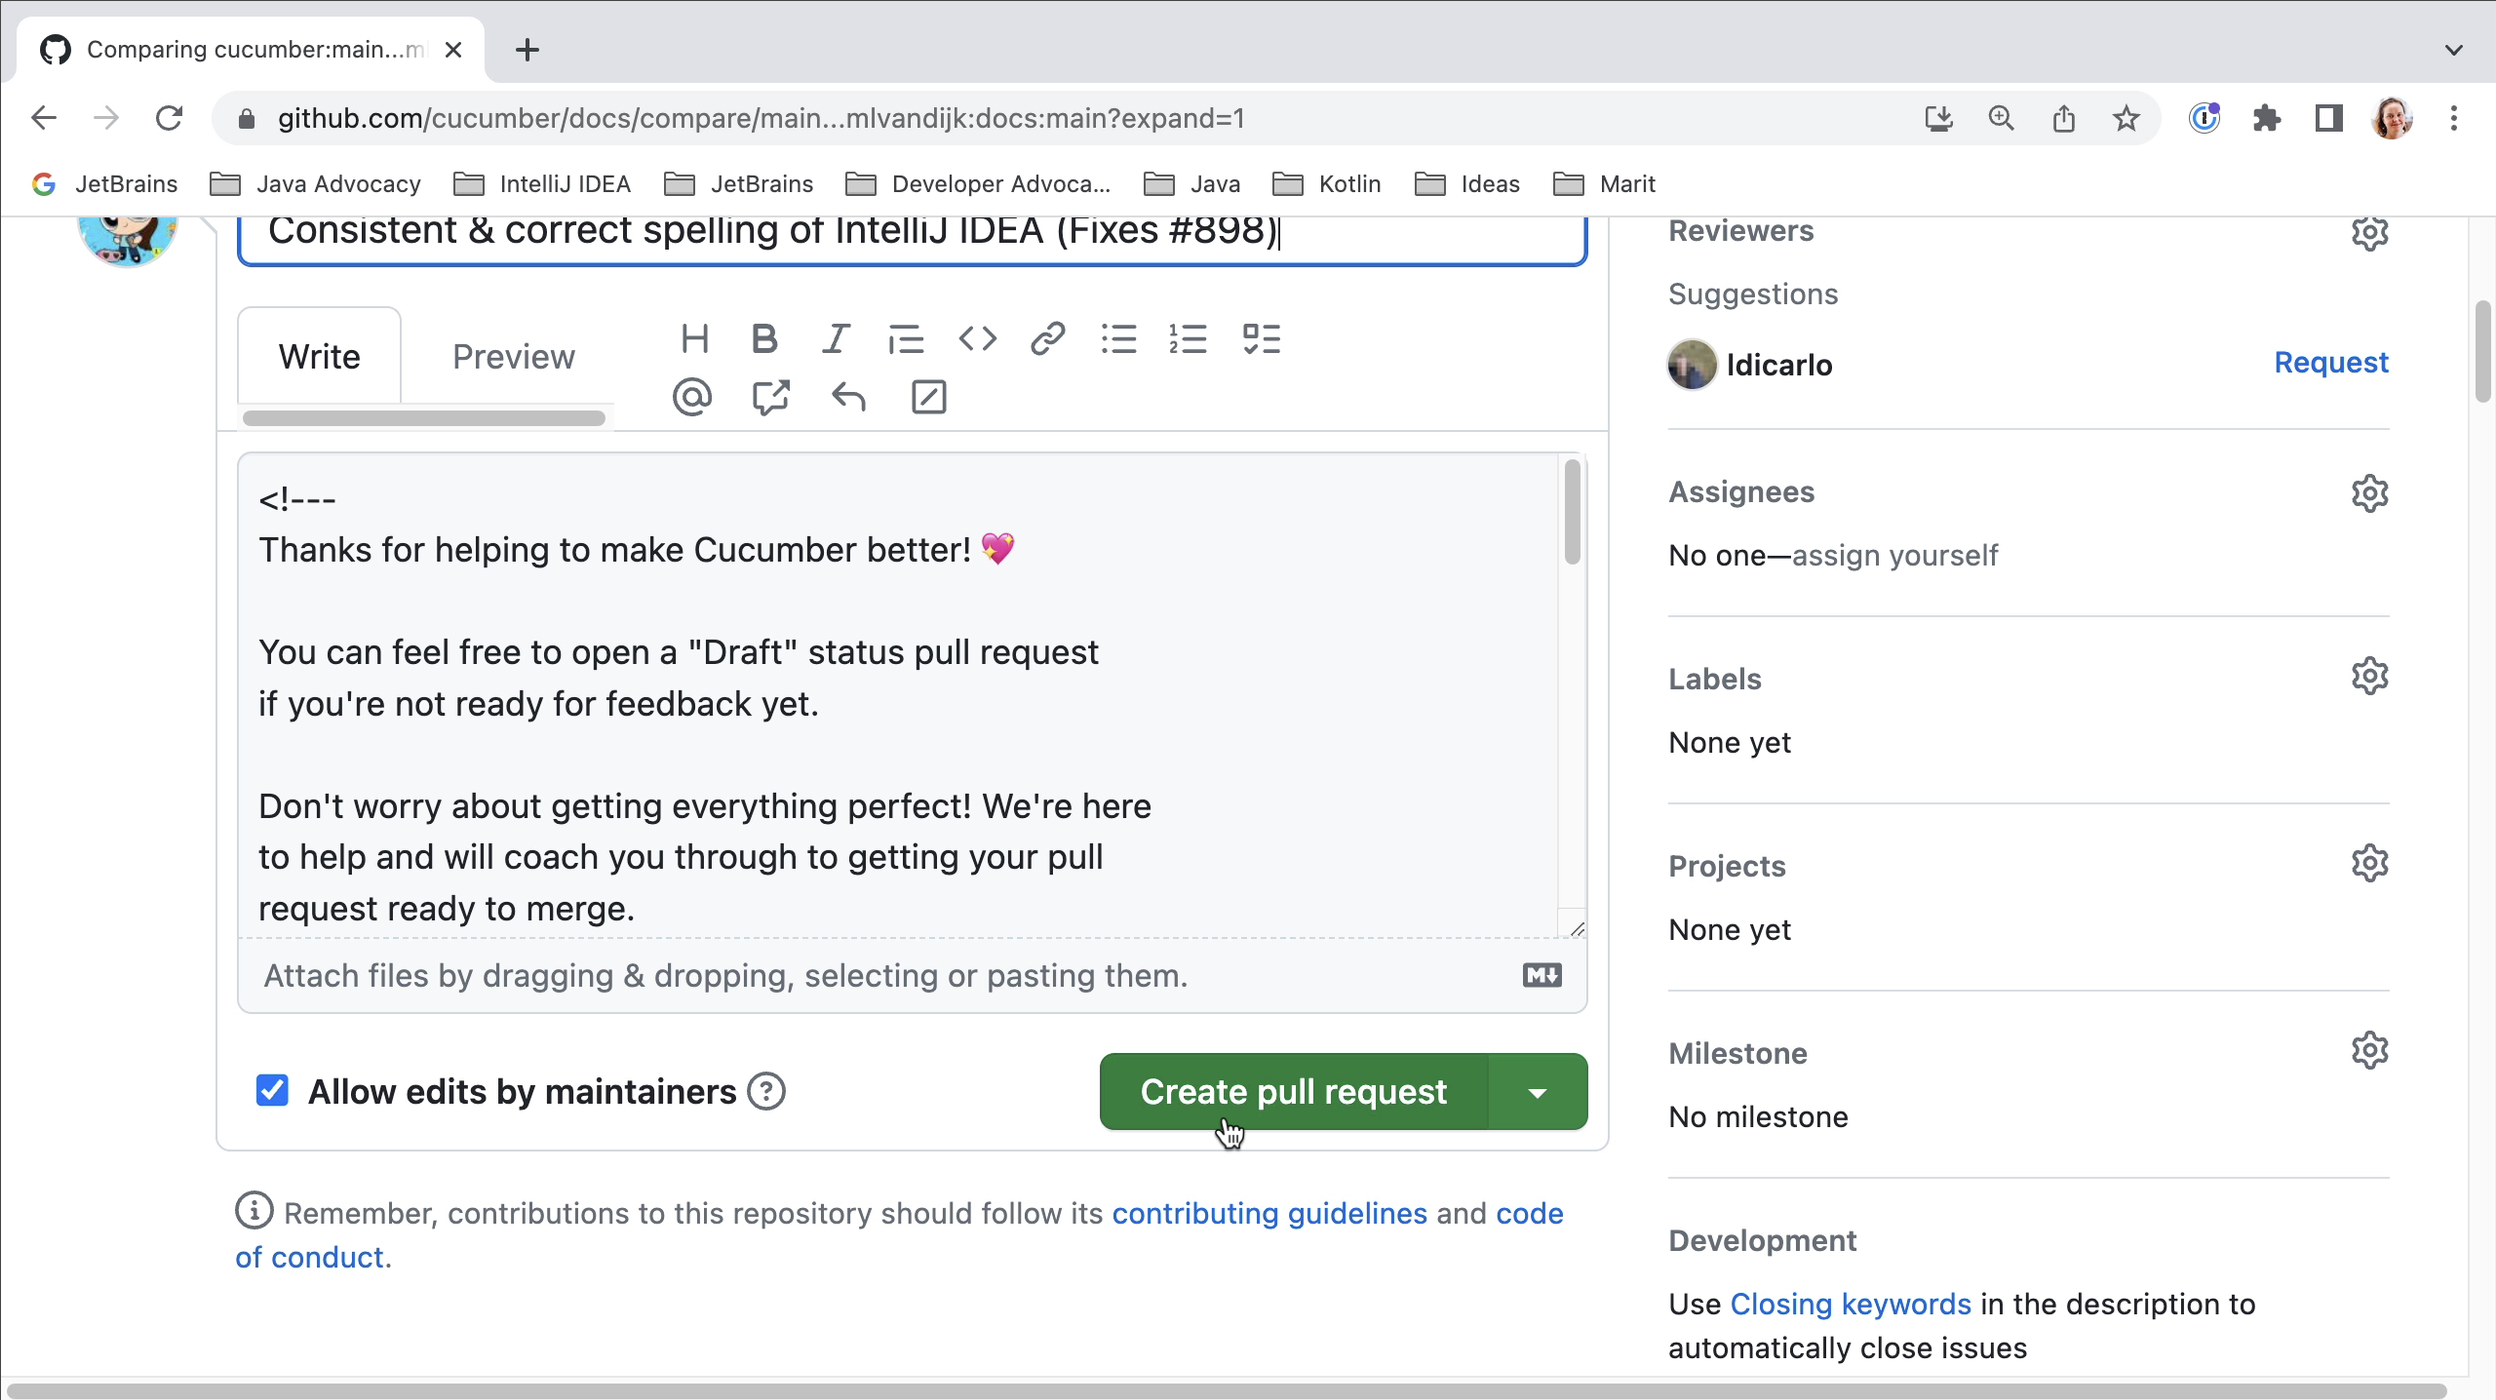
We need to provide a title and description for our pull request. Make sure the title is a good description of the changes you want to contribute. If your PR fixes an issue, you can add “fixed #x” (where x is the issue number) to the title; this will automatically close the linked issue when the PR is merged. Once you are happy with the title and description, click the button Create pull request to open your pull request.

Open the pull request

Create pull request

Negotiating the review process

Now the waiting starts. On an active project, hopefully your PR will be reviewed soon. Your PR might get comments from reviewers that you need to fix. For complex changes, this might take several iterations. For smaller changes, hopefully it won’t. Before doing a lot of work on an issue you might want to check that your contribution is wanted and your solution is what they are looking for. Don’t be discouraged by review comments. Keep in mind that the maintainers will have to maintain your solution in the future and they want to make sure that it fits their project.

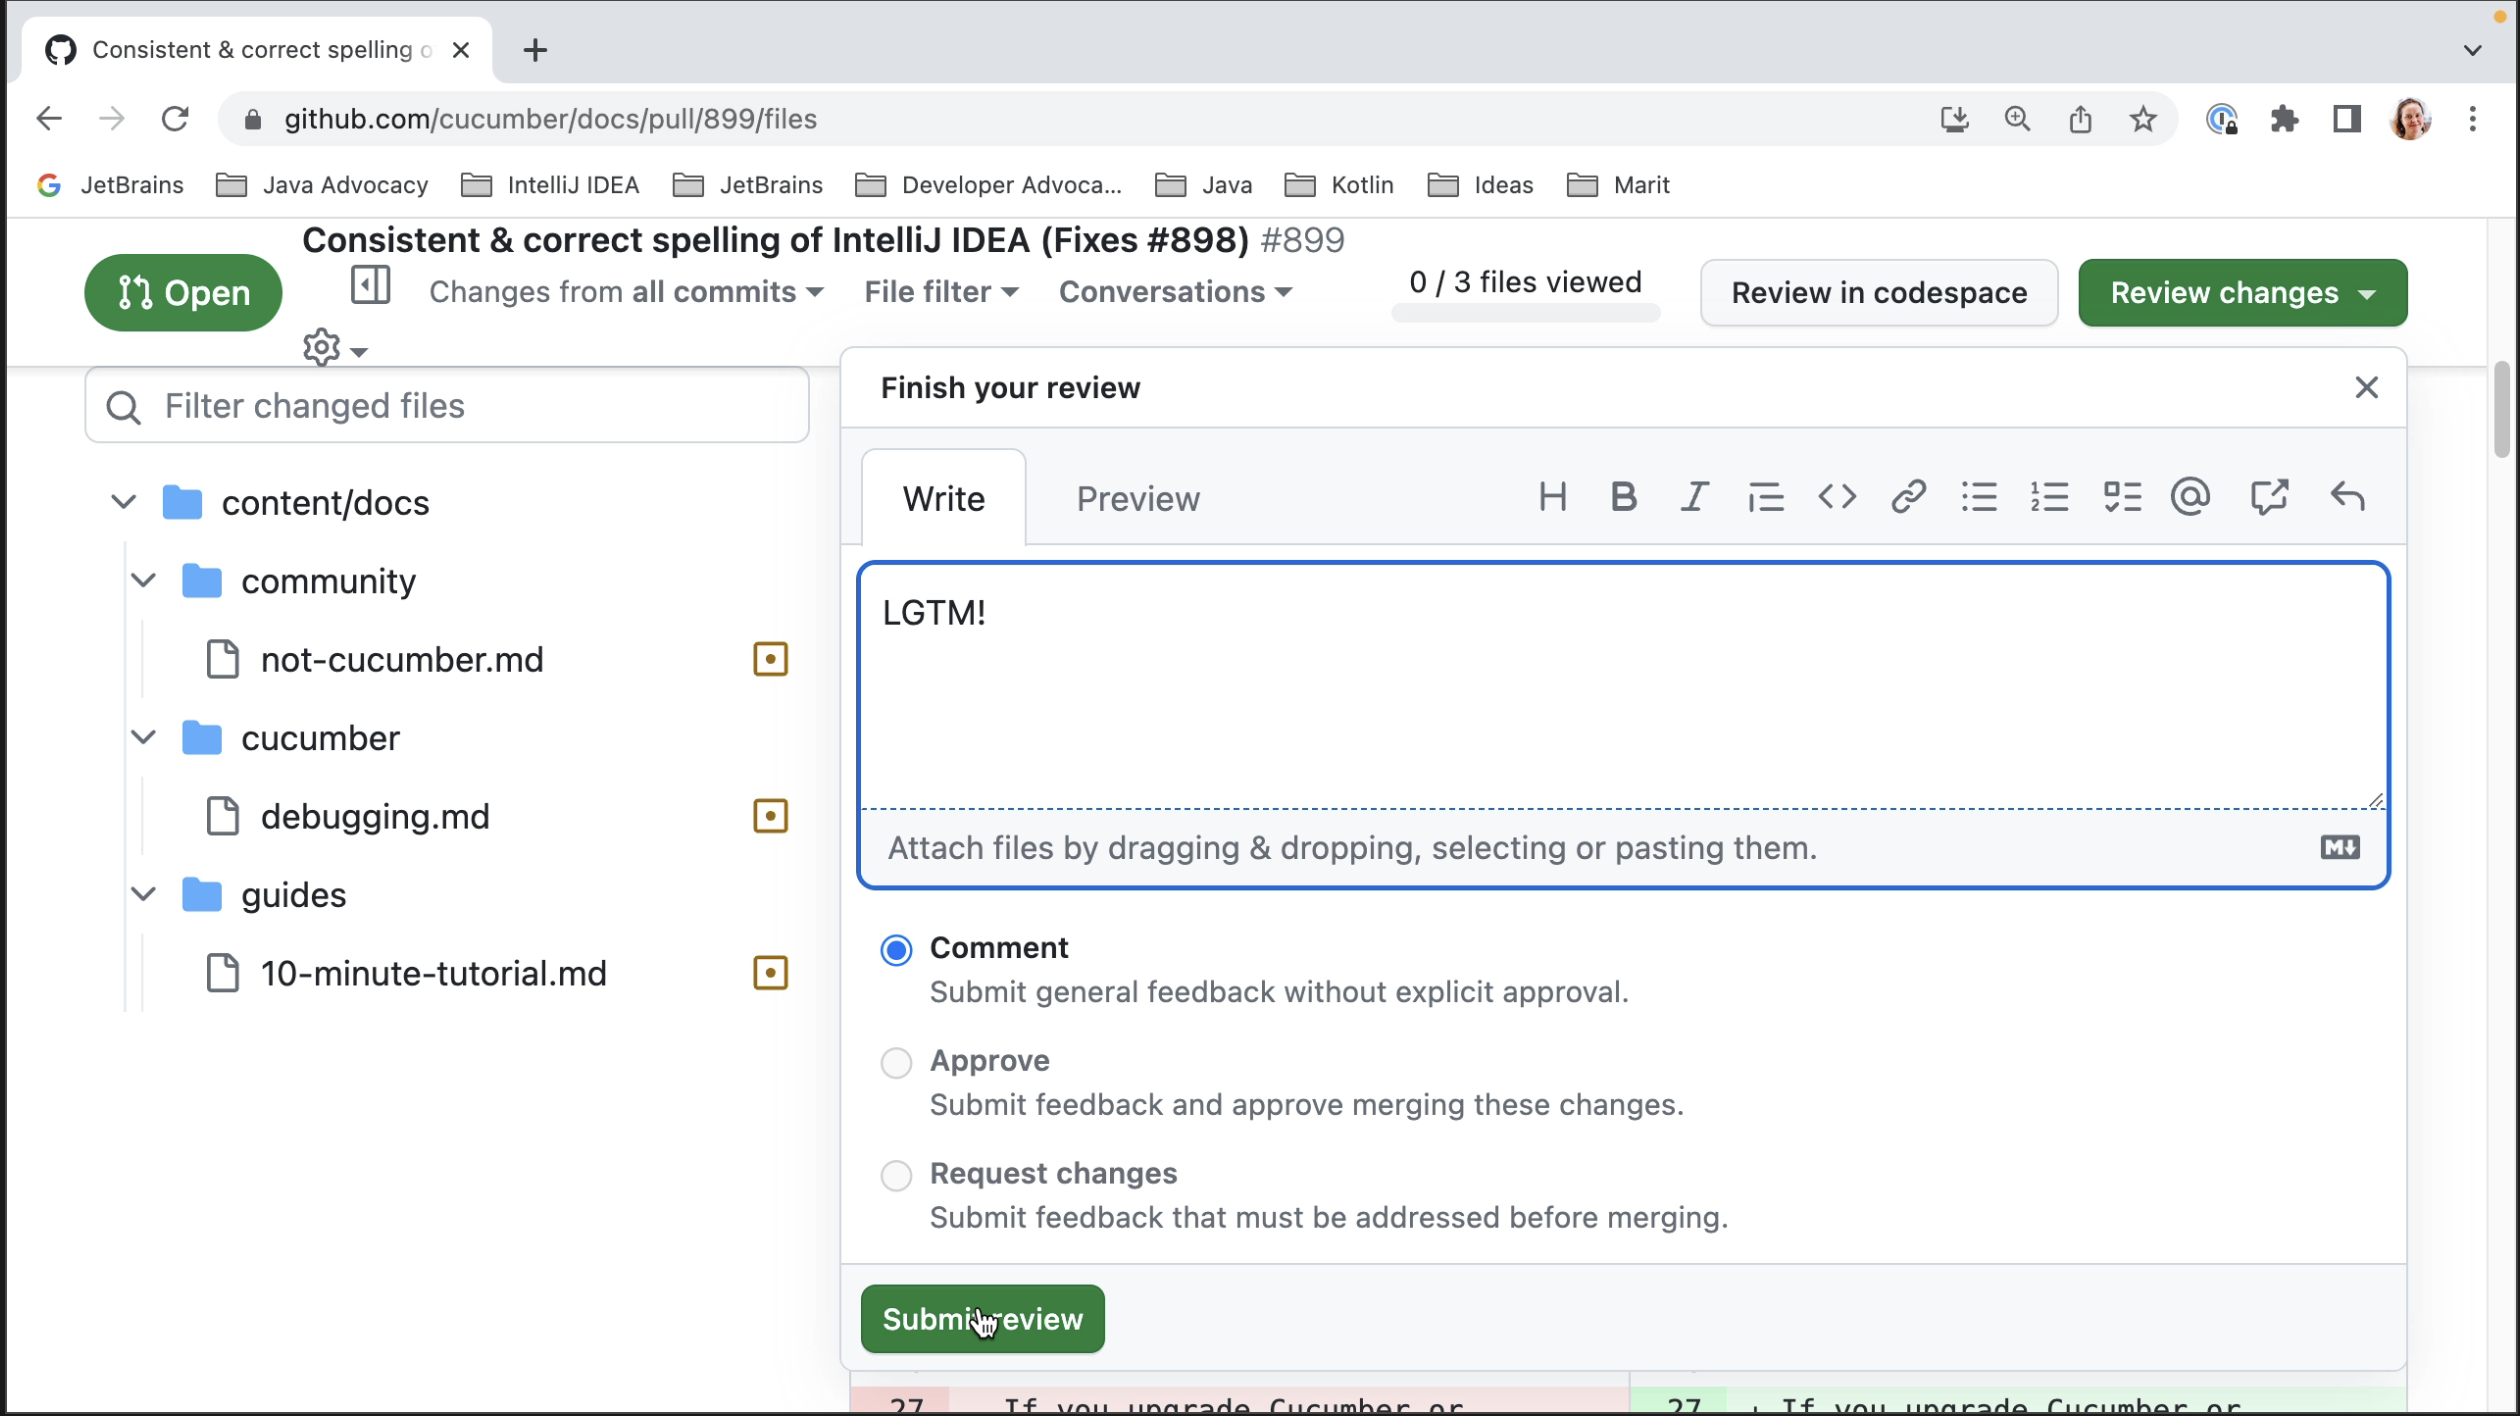
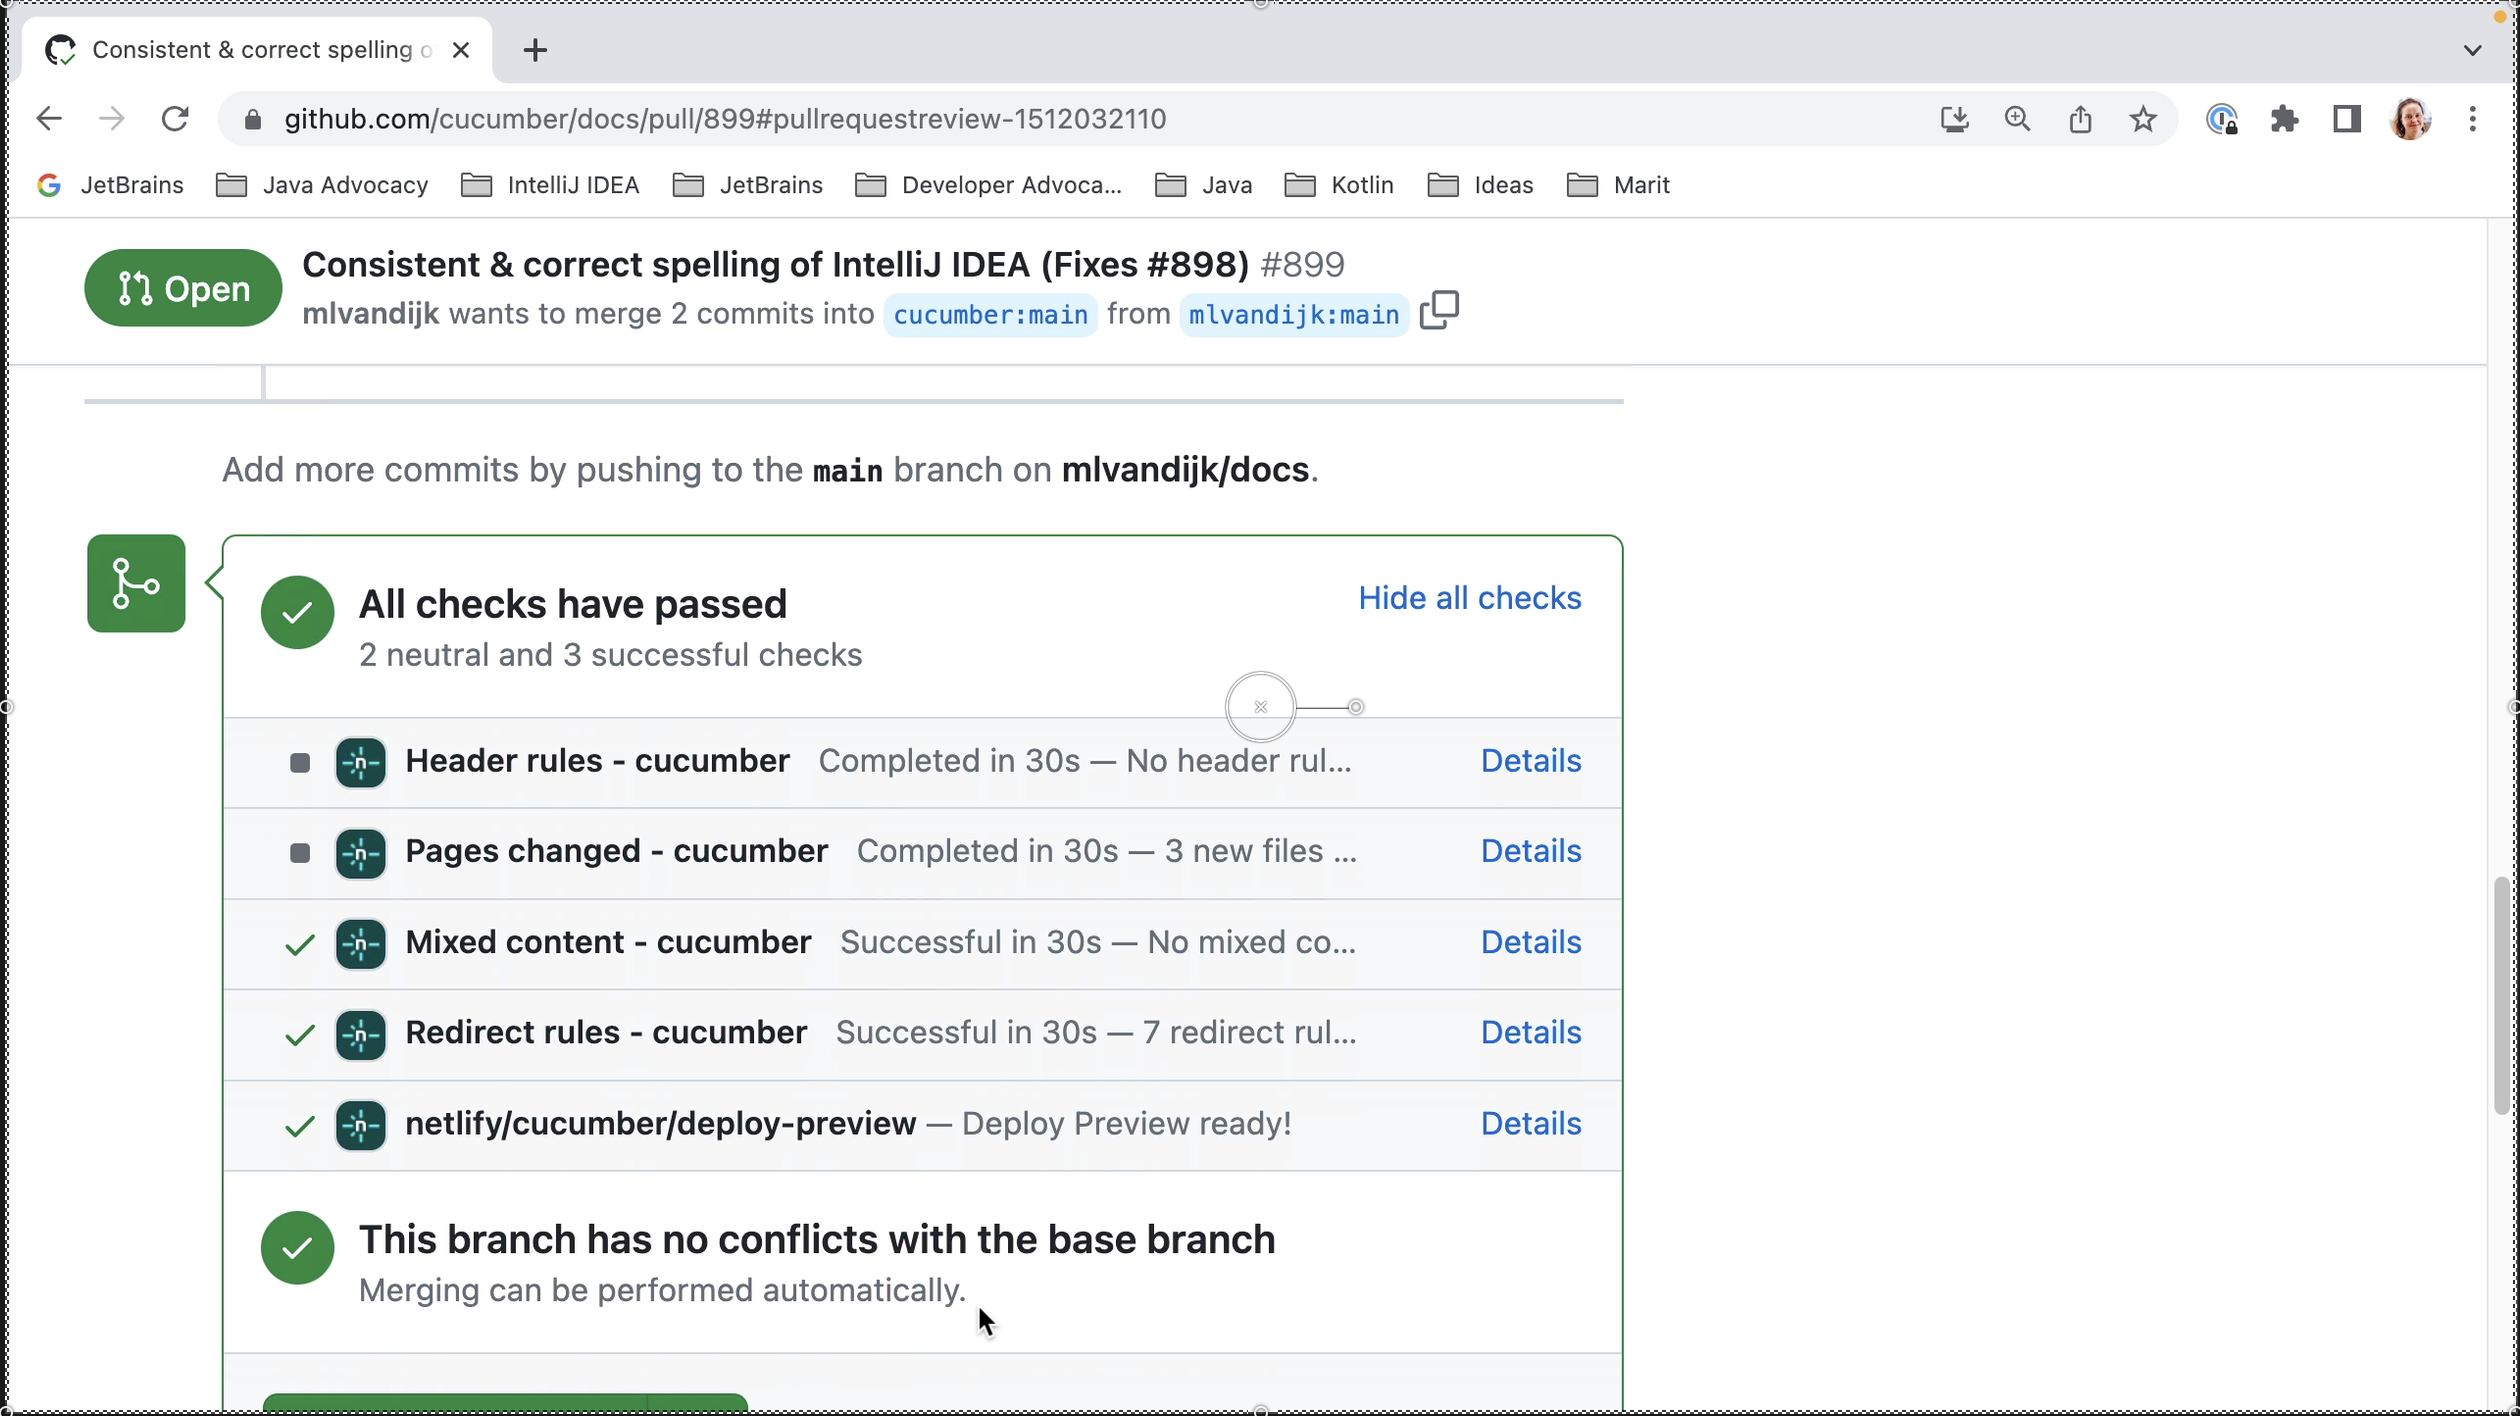
As you can see, reviewers can comment on your PR, approve the PR or request changes which must be addressed before merging. A project might have other checks set up that need to pass before merging. You might want to check that these checks pass and that there are no conflicts with the main branch.

Review

Checks

Summary and shortcuts

In this blog post, we’ve seen how to do an open source pull request. For more information on what you can contribute and how to find something to contribute, please have a look at this video.

IntelliJ IDEA Shortcuts Used

Here are the IntelliJ IDEA shortcuts that we used.

Name macOS Shortcut Windows / Linux Shortcut
Open / Close Project Tool Window ⌘1 Alt+1
Find in Files ⌘⇧F Ctrl+Shift+F
Commit changes ⌘K Ctrl+K
Commit tool window ⌘1 Alt+1
Show diff ⌘D Ctrl+D

Related Links

Contributing to open source software: Creating a pull request

In this screencast, we’re going to take a look at Contributing to Open Source Software, specifically how to create a pull request.

Links

public static void main 🎶

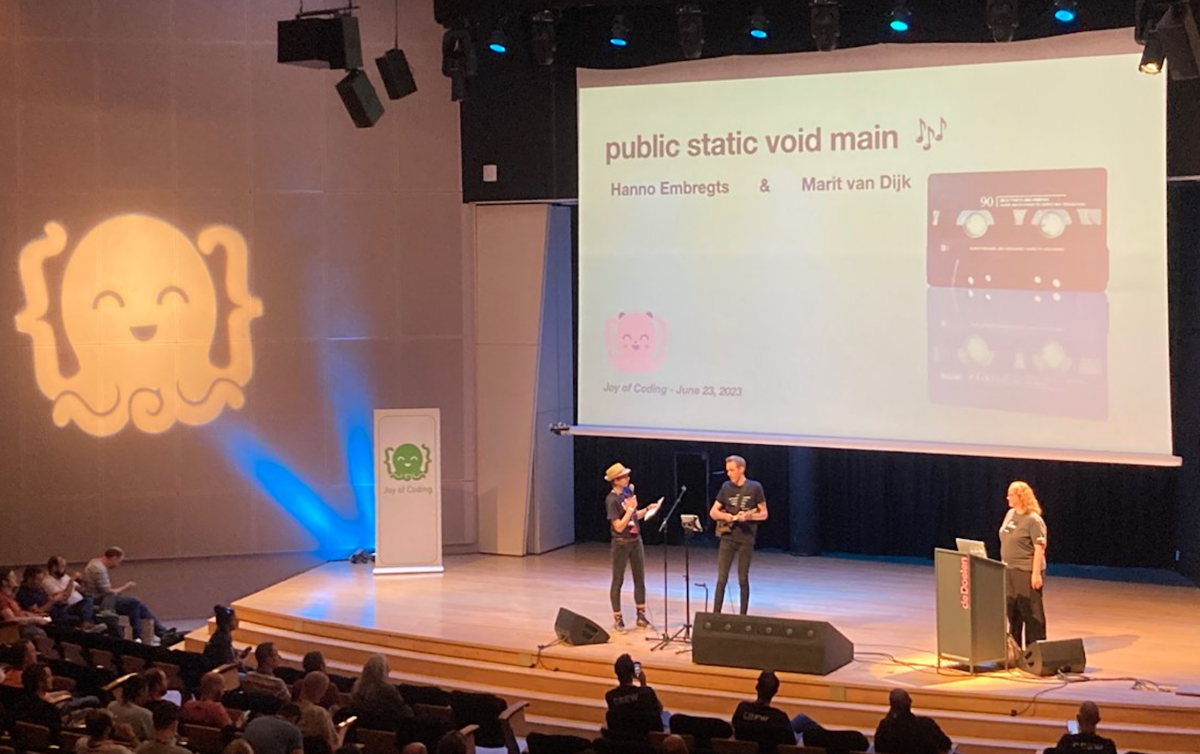
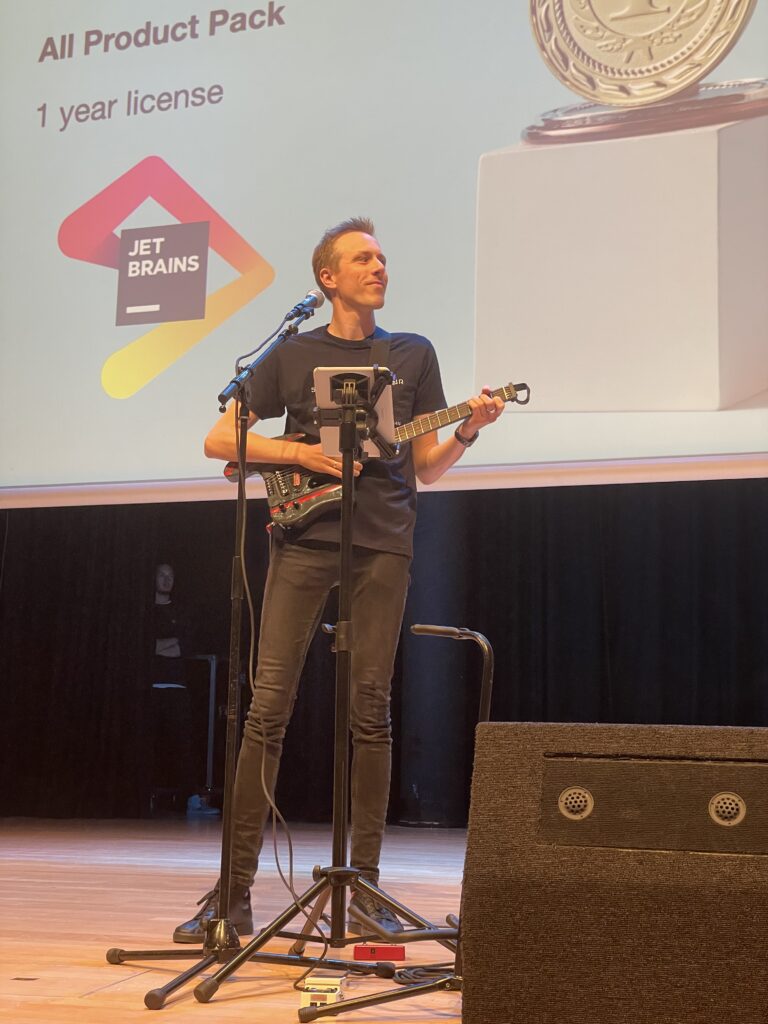
On June 23, 2023 Hanno Embregts and I performed a lightning talk / pop music quiz called “public static void main 🎶 “. This was based on a Tweet that said “I realized that you can sing “public static void main” like “Everybody dance now” and I can’t stop doing it”. Hanno found 15(!!) songs that would also work, and we created a pop music quiz.

On June 23, 2023 Hanno Embregts and I performed a lightning talk / pop music quiz called “public static void main 🎶 “.

Hanno and I met at Joy of Coding 2022, where he gave his talk “What “Stairway to Heaven” Can Teach Us About Software Development“. In this talk, he plays parts of the song on stage with his travel guitar, and then explains how the lyrics are about software development.

How it started

A few weeks later, I saw a tweet that said “I realized that you can sing “public static void main” like “Everybody dance now” and I can’t stop doing it”. (And, I’ve been doing just that ever since.) Someone responded to my retweet by pointing out that this also works for Vamos a la playa.

I love it when a plan comes together

So I pitched the idea to Hanno of doing a “pop music quiz” with different songs where we would replace the lyrics with “public static void main” and we could have the audience guess what the original song was. A few months later, Hanno contacted me to say he had found at least 15(!!) songs where this would work. Apparently, he had gone through the Top 2000 looking for songs he thought might work. So we got together to discuss this idea, write an abstract and figure out where to submit it too. We submitted to several conferences that offered lightning talks slots and … got accepted to Joy of Coding 2023! Coincidentally, this is also where I got started speaking, so I was very excited to return.

Time constraints

Unfortunately, we had to cut some songs due to the 5-minute limit, so we selected the 6 we thought would work best. We selected a quiz tool, created the questions, and some videos to go with them using IntelliJ IDEA‘s live templates.
The Joy of Coding organizers were extremely helpful in allowing us to take the last slot in the lightning talk line-up, letting us use our own laptop to run the quiz, and talking to the venue to get Hanno an audio monitor at the last minute.

Joy of Coding 2023

On the day of the conference, we had a lot of fun playing and singing along.

And to our surprise, we ended up with a tie for first place! Fortunately, we had some back-up songs we could use to settle this tie in a kind of “sudden death” match between the two top contestants.

We also got some positive feedback from the crowd, as well as an invitation to perform again elsewhere.

Thanks

Many thanks to original tweeters for the idea (I’ll forgive you for also getting the song stuck in my head), Hanno Embregts for the awesome collaboration, Yosuf Haydary for pictures and videos of the event and Joy of Coding for having us!

How I got started with public speaking

As a public speaker, one of the questions that comes up occasionally is “How did you get into public speaking?”. In my case another speaker and conference organizer convinced me to submit a lightning talk to their conference, which got accepted. it was both scary and exciting, but fun enough to keep doing it!

As a public speaker, one of the questions that comes up occasionally is “How did you get into public speaking?”. Everybody has their own personal story; this is mine.

Attending conferences

In my 20+ years in IT, I’d never had a job where it was normal for me to go to conferences. This changed when I joined bol.com, an online retail platform, in 2017. At bol.com, going to  conferences was very common. As it turns out, I really loved going to conferences.

Some of the things I particularly enjoy are hearing about new technologies I might not yet be aware of, or new and different perspectives on technologies I already know. Also, I’m interested in hearing stories about challenges people face in other companies and industries, and how they solve their problems (either with or without specific tools). My favorite conferences are the ones where I come back with a bunch of ideas of new things to try. In addition, I very much enjoyed meeting people and discussing our thoughts on software development in the so-called “hallway track”; the conversations that happen in the hallway in between talks. While talks can often be watched online after a conference, meeting new people and having conversations with them only happens in person.

Meeting other speakers

To expose myself to more ideas, I created a Twitter account and started following speakers I liked and people I met at conferences. One of those people was Peter Hilton, whose talk I saw speak at CodeMotion Amsterdam 2017 and later met at Joy of Coding in 2017.

Peter was the one who convinced me to submit a lightning talk to Joy of Coding in 2018. He told me that as it was only 5 minutes, if I really didn’t like it, at least it would be over quickly. Of course, what he didn’t tell me is that it could be worse: I could end up liking it and wanting to do it again! Also, it wasn’t until I was accepted to do a 5-minute lightning talk that people told me that short lightning talks are actually harder than regular, longer talks. If you only have 5 minutes to get your point across, you have to be really clear about what that point is!

Picking a topic for my first talk

For my very first talk, I chose a topic I was very enthusiastic about and actively using at the time: Cucumber & BDD. I had started using Cucumber the year before and even started making open source contributions to the Cucumber documentation as well as cucumber-jvm (the Java implementation of Cucumber). My team at the time was using Cucumber to describe the intended behavior of our applications, and these automated tests helped safeguard this behavior by making sure we didn’t break it when making changes and adding new features. Being an active user and contributor, I had way more to say about this topic than I could fit into 5 minutes, so I had to bring it down to several core points I wanted to make. 

Practice makes perfect

Since it was imperative that I keep it under 5 minutes (I was told that the microphone would be cut after 5 minutes; no pressure!), I practiced my talk. A lot. The way I did this was by setting a 5-minute timer on my phone, and practicing my talk in the mirror. Every time I went over the 5 minutes, I would think about what went wrong. Often, it would be a tangent I went on that would take too long, so I would try to cut that and try again. Eventually I managed to whittle it down to 5 minutes and focus on the core idea(s) I wanted to get across.

Conference day!

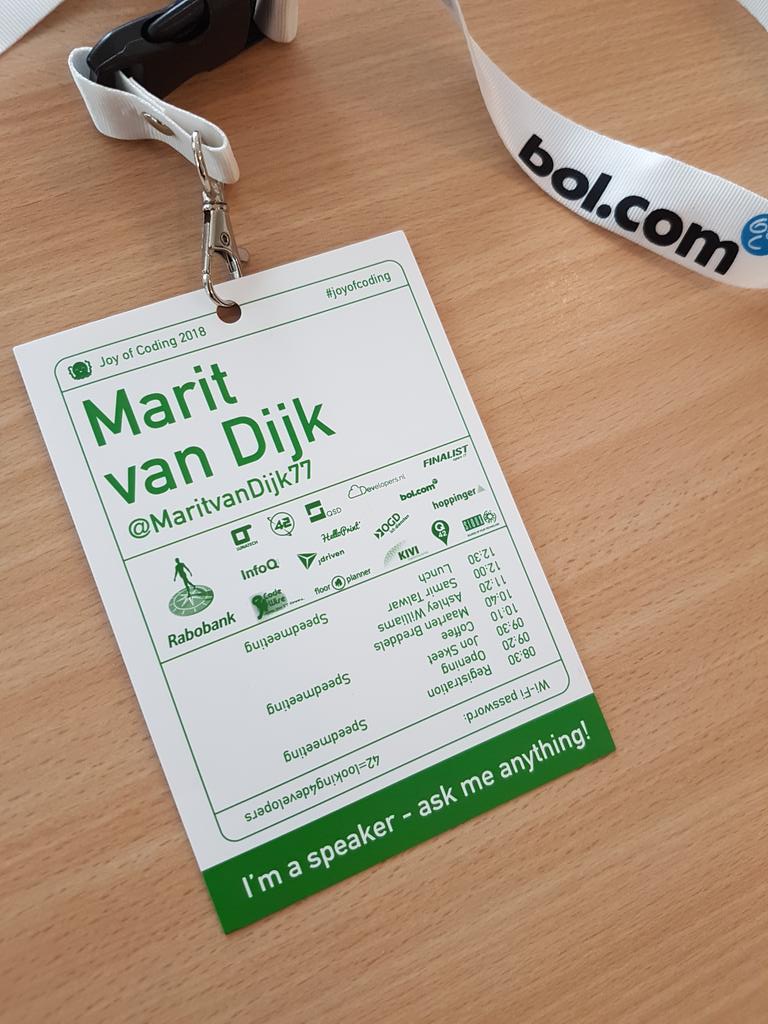
On the day of the conference, I was extremely nervous but also excited. It was pretty exciting to see my name on a speaker badge!

Joy of Coding 2018 conference badge with my name and the text "I'm a speaker - ask me anaything!"
First speaker badge with my name on it!

There were several people doing lightning talks and the organizers had been kind enough to let me go on first, so I didn’t have to continue to get more nervous while waiting for my turn. Standing on stage for the first time was weird; it can be hard to know if the audience likes your talk if they just sit there quietly.

Fortunately I managed to get my story out within the 5-minute limit, and then I got to sit and watch the rest of the lightning talks. I’ll admit I didn’t really process a lot of them as I was feeling like a deflated balloon after my talk; or at least that’s how I describe the feeling of coming down off the adrenaline after a talk. To be honest, I still feel that way after talks these days, despite having way more of them now. It is not as bad as the first time, but I still get nervous before each talk and still need a bit of time to recover after. And yet, I still continue to do it!

Upsides of public speaking

This is how I got into public speaking. It started with a lightning talk on a topic I was enthusiastic about, and based on personal experience. It’s lead me to speak at many other conferences, share my knowledge and experience, meet many more amazing people and learn from them. And speaking is now part of my job as a Developer Advocate at JetBrains!

Analyzing dependencies in IntelliJ IDEA

If you’re working on a real world project, you’re probably using external dependencies. You might need to analyze which dependencies your application uses. For example, you may want to find out how a particular version of a dependency ended up in your application. Let’s take a look at how IntelliJ IDEA can help you to analyze dependencies.

Using the Dependency Analyzer

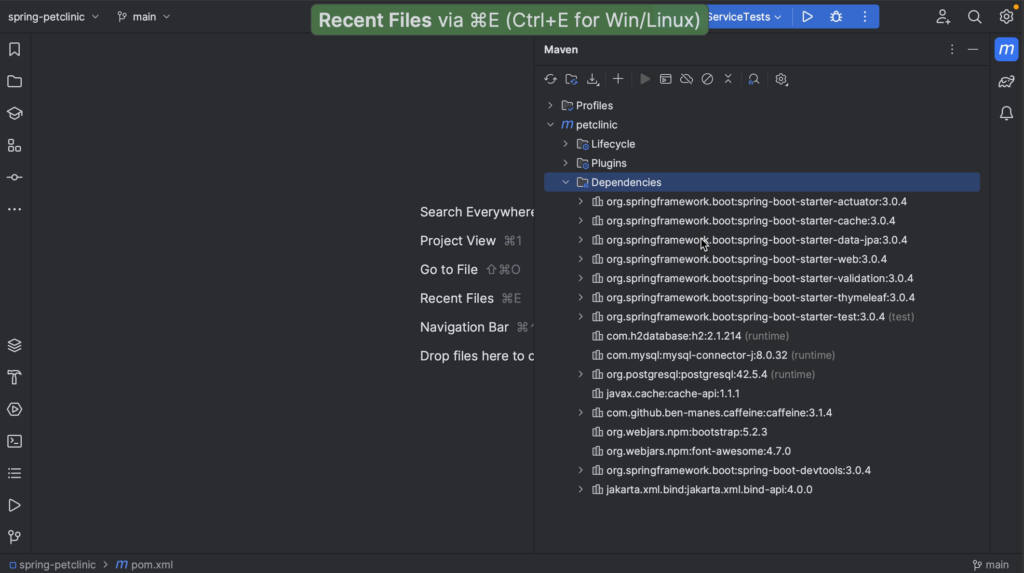
We can view our dependencies in the Maven or Gradle tool window. Here, we can expand dependencies to show their transitive dependencies, or collapse them again.

Open the Dependency Analyzer

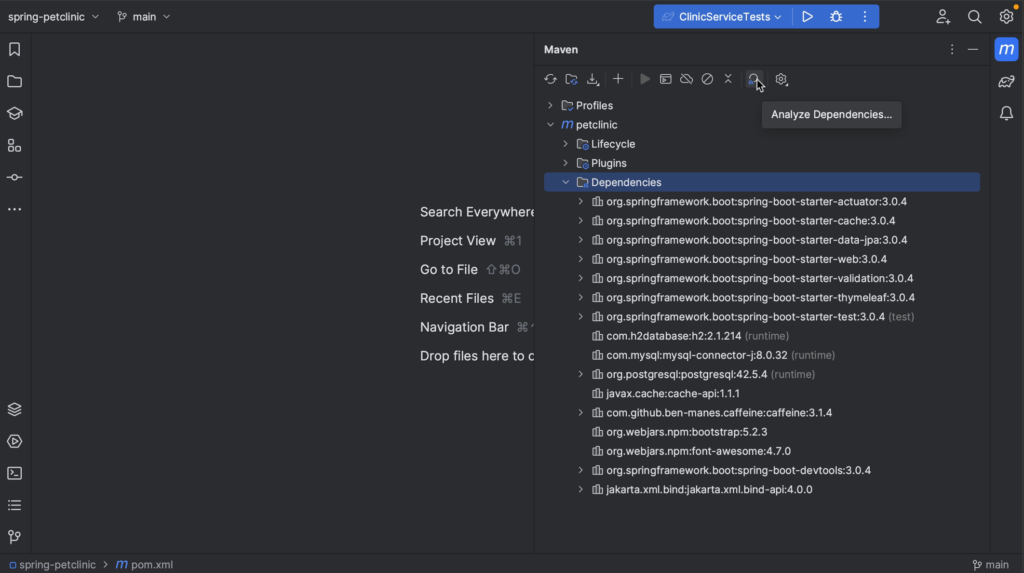
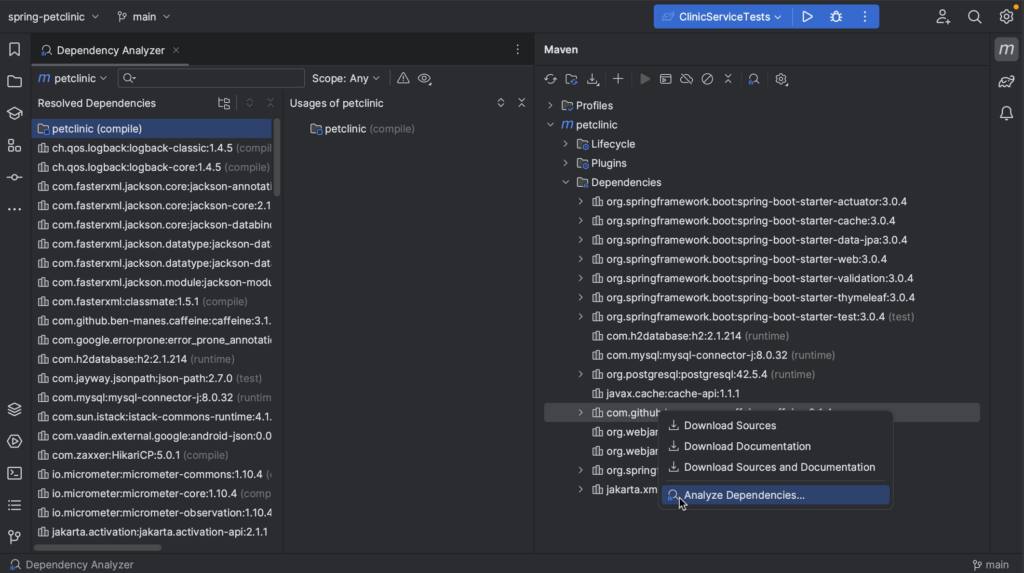
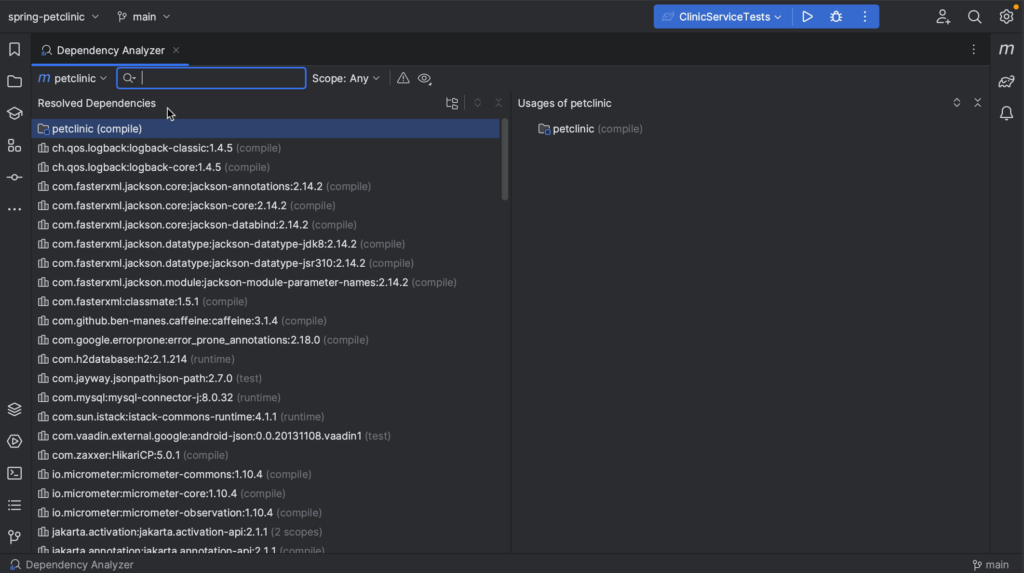
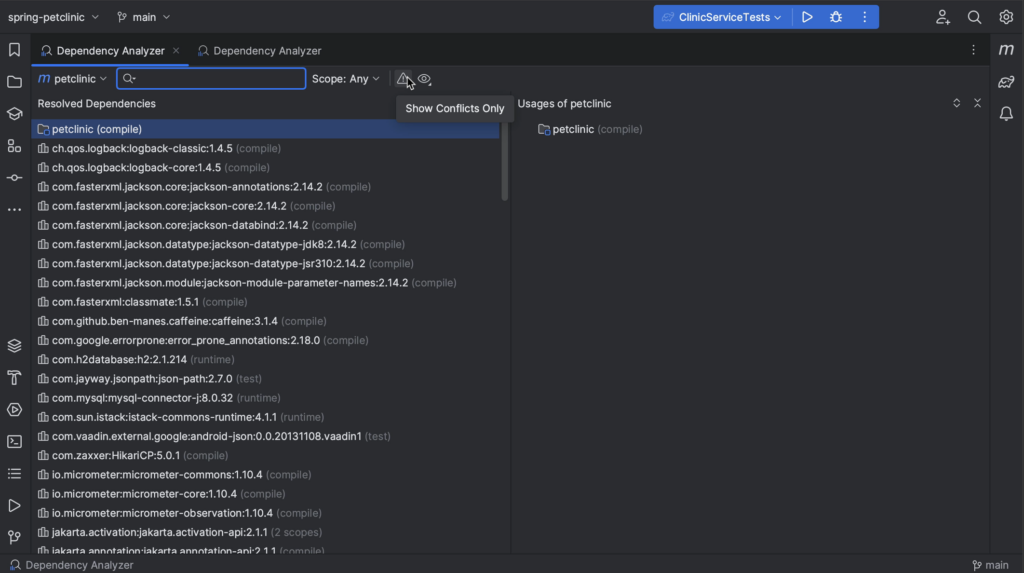
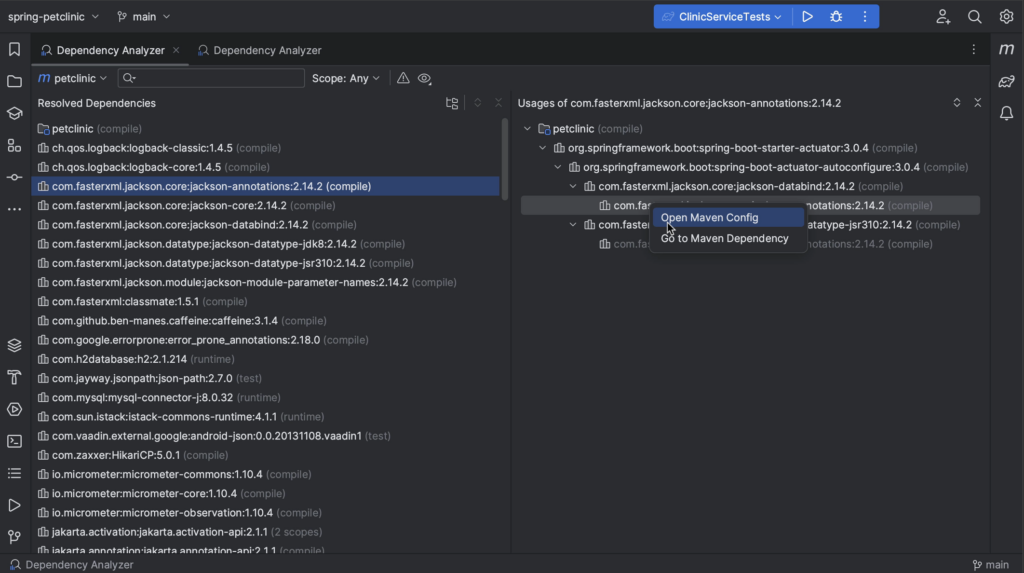
We can open the Dependency Analyzer from the Maven or Gradle tool window by clicking the Analyze Dependencies… button. This will open the Dependency Analyzer showing the Resolved Dependencies on the left and their Usages on the right.

Alternatively, we can right-click a dependency in the Maven or Gradle tool window and select Analyze Dependencies from the context menu. This will open the Dependency Analyzer with the dependency selected.

We can hide all tool windows (⇧⌘F12 on macOS / Control+Shift+F12 on Windows/Linux), so we can focus on the dependencies.

Viewing dependencies in the Dependency Analyzer

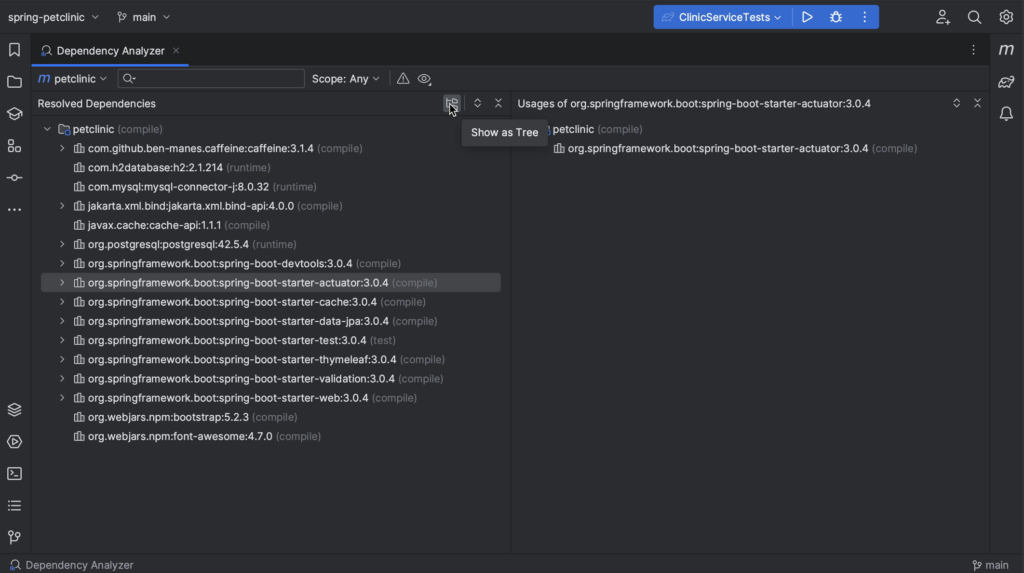
We can view the dependencies as a tree by clicking the Show as Tree button and Expand or Collapse them as needed by pressing the corresponding buttons.

We can also click the View Options button and toggle Show GroupId, to show the GroupId for dependencies or not.

Finding a specific dependency

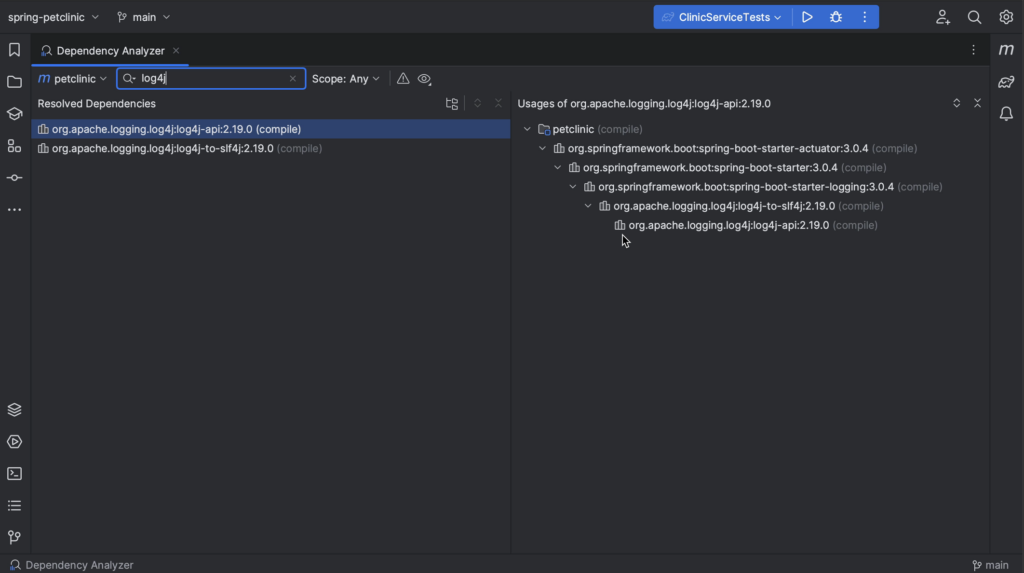
To see where we are getting a specific version of a particular library, we can search for that dependency. For example, when we search for “log4j” we see that we are only getting it via this spring-boot-starter, and it’s a version newer than the one where log4shell was fixed.

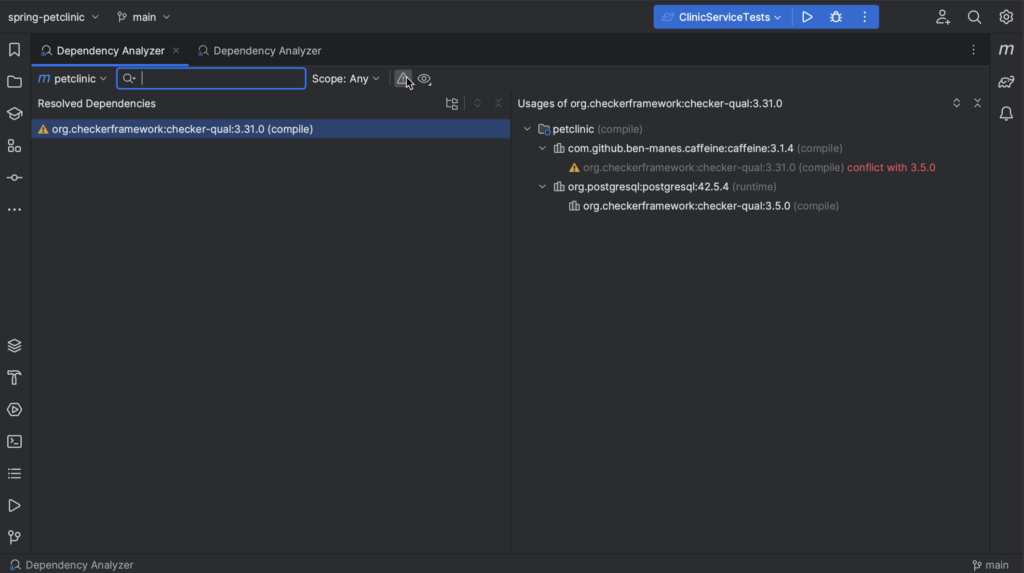
Finding conflicts

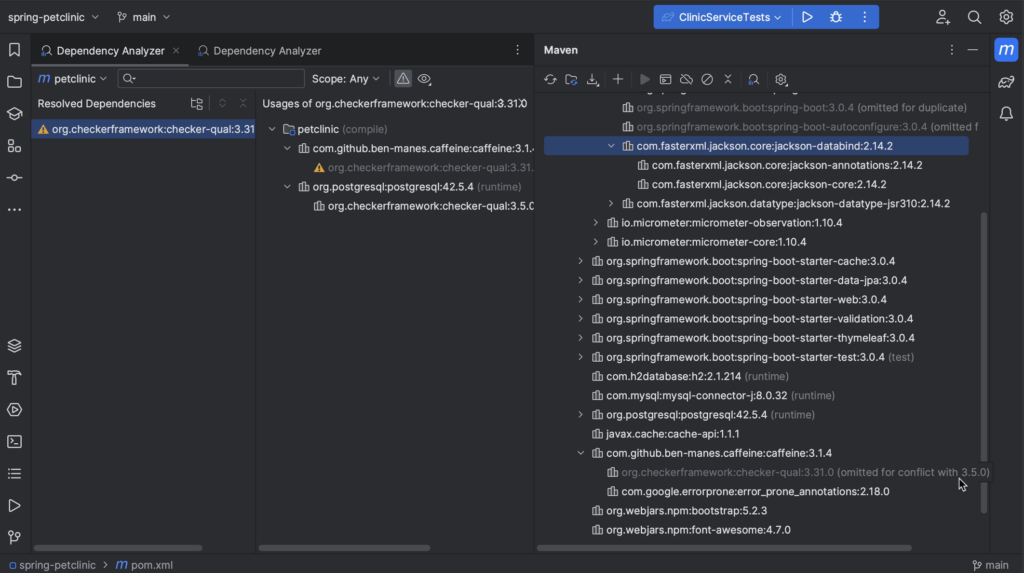
We might only want to look at dependencies that have conflicts. When we select the Show Conflicts Only button, we see only dependencies that have conflicts. In this example, we see that there is a conflict with the checker framework dependency. Fortunately, it’s been resolved; we see that one version is greyed out. If we go back to the Maven tool window, we see that this version has been omitted for conflict. We can see that the version we are using is 3.5.0 which we get from postgres.

Selecting scopes

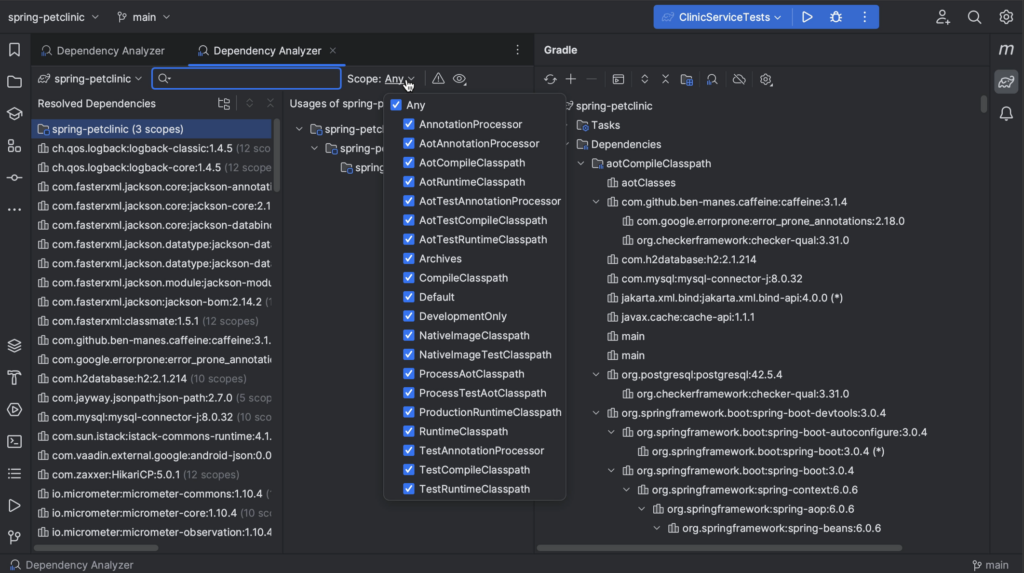
We can also select a scope (for example, if we want to look at our test dependencies or exclude them from analysis). Since we’ve opened the Dependency Analyzer from the Maven tool window, we see the Maven scopes.

When we open the Dependency Analyzer from the Gradle tool window, the list of scopes will contain Gradle scopes.

More context

For more context, we can click a specific dependency and select Open Maven Config to open its pom.xml or Go to Maven Dependency to open the location in the pom.xml where this dependency is declared.

Using the Dependency Diagram

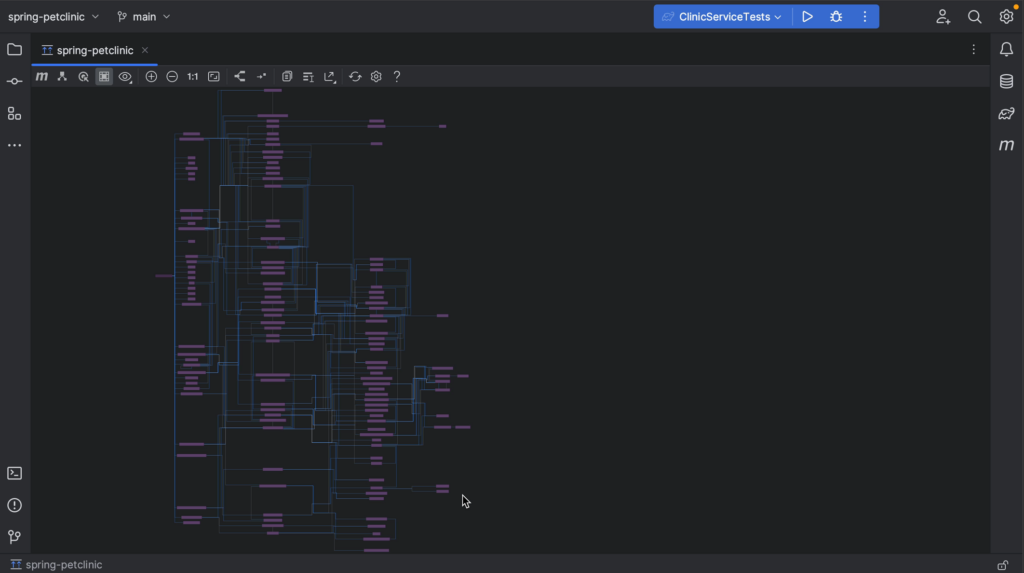
If you are using IntelliJ IDEA Ultimate, you can also view your dependencies as a diagram.

Show Diagrams

We can open diagrams either by right-clicking the project in the Project tool window and selecting Diagrams | Show Diagrams, or by using the shortcut ⌥ ⇧ ⌘ U (on macOS) or Ctrl+Alt+Shift+U (on Windows/Linux). You’ll notice this gives you several diagram options to choose from. In this case, we’re interested in the Gradle Dependencies, so we select that one. We can hide all tool windows (⇧⌘F12 on macOS / Control+Shift+F12 on Windows/Linux), so we can focus on the diagram.

Zoom in

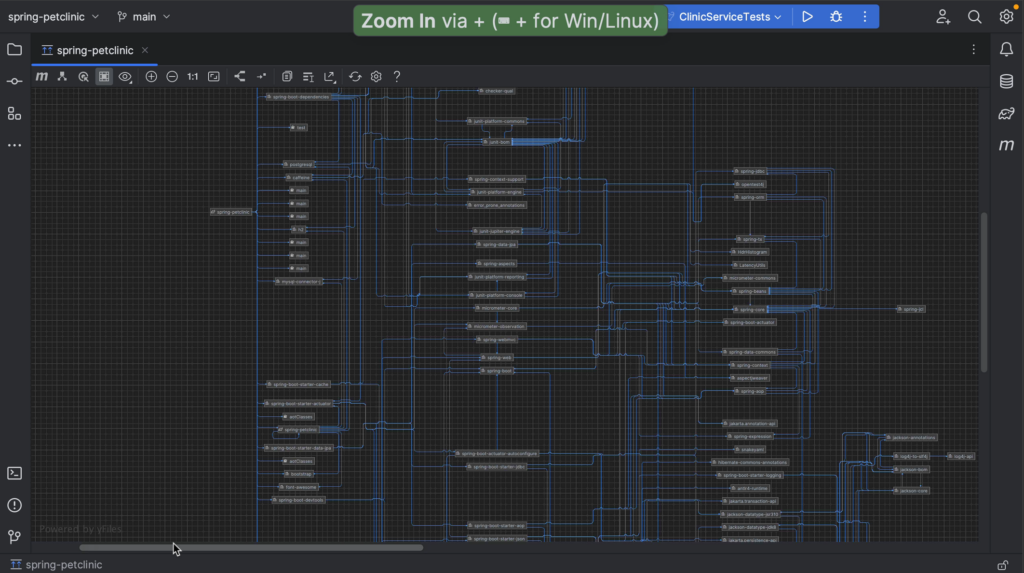
If the project we’re looking at pulls in a lot of transitive dependencies, like this example, the diagram can be quite large. We can zoom in and out using the + and – keys, or the + and – buttons in the diagram window.

Finding a specific dependency

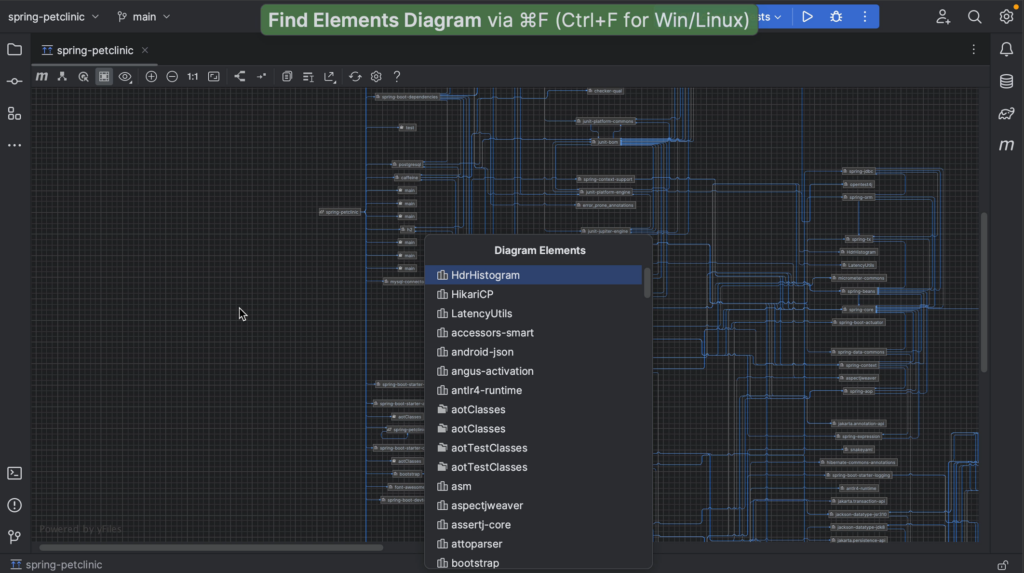
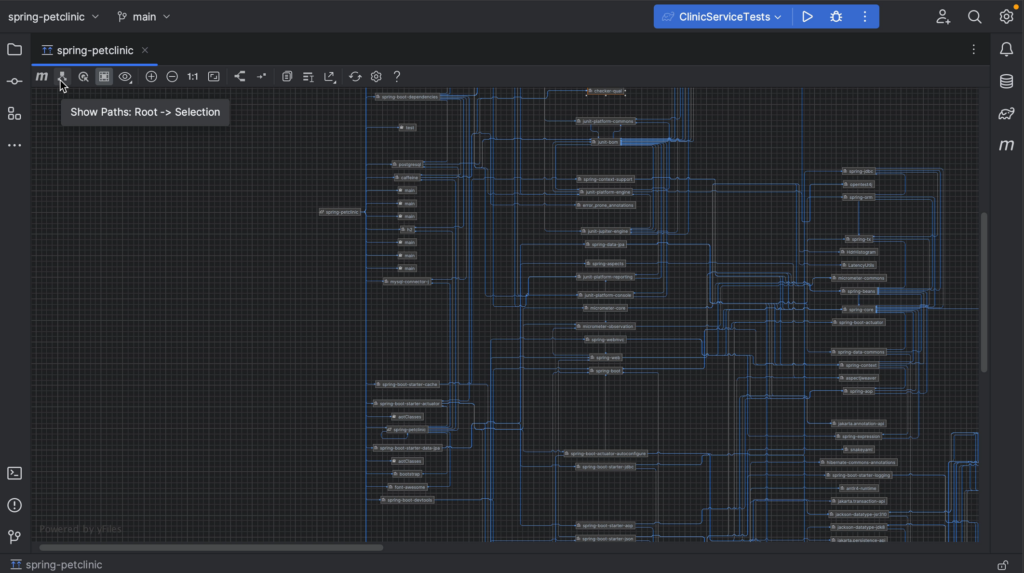
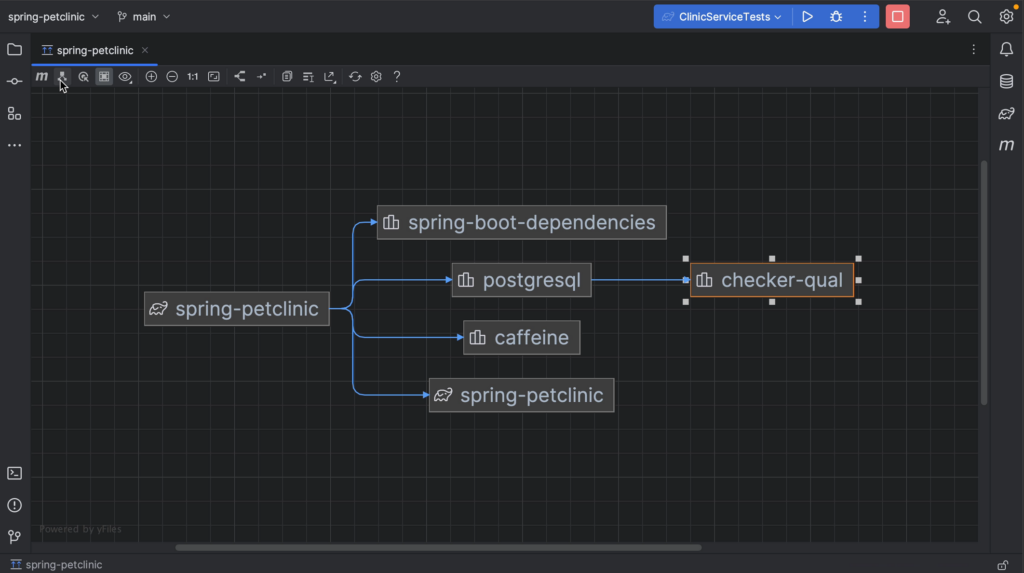
To look for a specific dependency and see where we get it from, we can search for this dependency using ⌘F (on macOS) or Ctrl+F (on Windows/Linux) to find it in the diagram. Using the button Show Paths: Root -> Selection, we can check the path for this dependency and click related dependencies to follow the path to the root.

Focus on related nodes

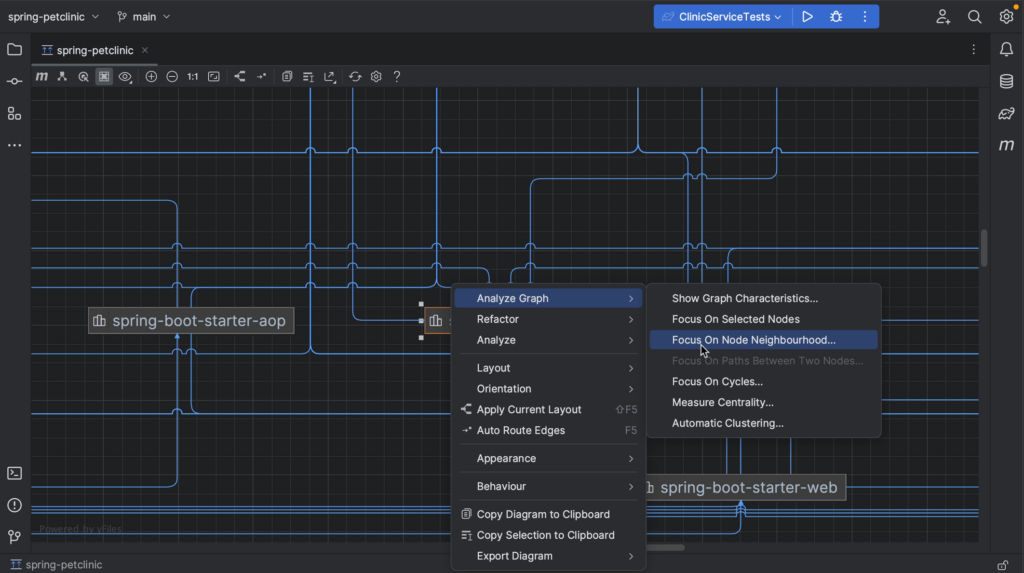
We have other options to look into specific dependencies. For example, we can zoom in on a specific dependency and the related nodes. Right-click the dependency you’re interested in, and from the context menu, select Analyze graph > Focus on Node Neighbourhood. This will give you several options. In this example, we’ll look at both directions. When we are done, we can reopen Analyze graph context menu and select Drop focus.

Select scopes

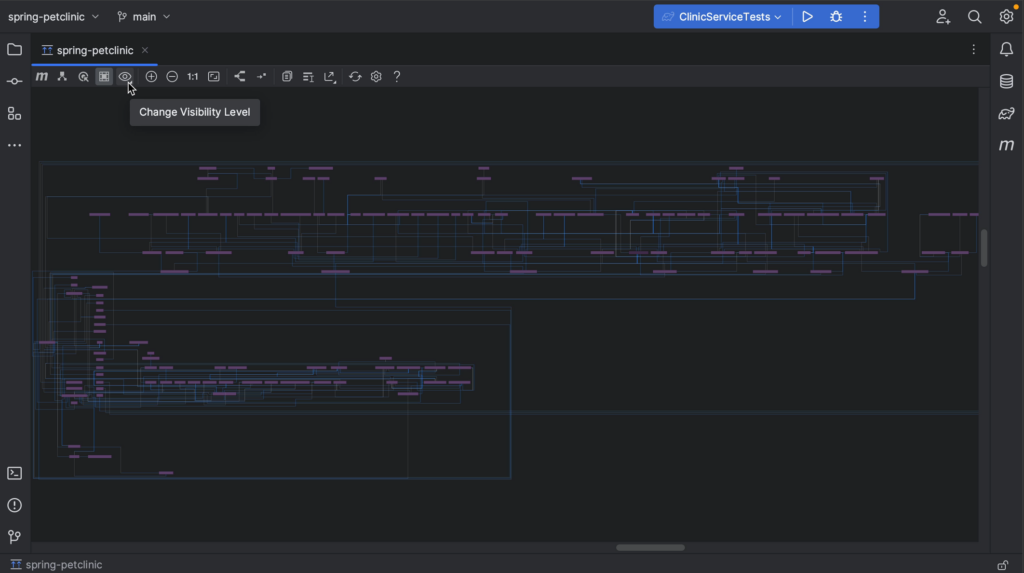
We can change the visibility level, by clicking the Change Visibility Level button for example if we want to focus on compile or runtime dependencies only.

Summary and Shortcuts

Now we know several ways to analyze our project’s dependencies in IntelliJ IDEA.

IntelliJ IDEA Shortcuts Used

Here are the IntelliJ IDEA shortcuts that we used.

NamemacOS ShortcutWindows / Linux Shortcut
Recent Files⌘ECtrl+E
Hide all windows / Restore windows⇧⌘F12Ctrl+Shift+F12
Open / Close Project Tool Window⌘1Alt+1
Show Diagram⌥⇧⌘UCtrl+Alt+Shift+U
Zoom in (in the diagram)++
Zoom out (in the diagram)
Find Elements in Diagram⌘FCtrl+F
Context Actions⌥⏎Alt+Enter

Related Links