This article was first published in NLJUG‘s Java Magazine. You can view an online copy here.
As developers, we read code more than we write it. Research has shown that “developers on average spend as much as 58% of their time comprehending existing source code” (The Programmer’s Brain – Felienne Hermans). And yet, we don’t practice reading code nearly as much as we do writing code. Let’s look at how to practice reading code and how IntelliJ IDEA can help.
Code Reading Club
In 2022, a friend invited me to join a Code Reading Club, based on the work of Felienne Hermans. We have monthly sessions where we take a sample of code and apply structured exercises to this code to try and make sense of it. I have really enjoyed our sessions, not only for the opportunity to practice reading code, but also because I find it very interesting to learn how other people read code. To start your own club, use the Code Reading Club resources. Or try the code reading exercises from Felienne’s book, The Programmer’s Brain.
While it’s possible to use these exercises in our daily work, developers mostly read code in the IDE.
Exploring an existing code base
When joining a new team or company, you need to quickly get up to speed with existing code bases. Obviously you can look at the project, but unfortunately not everything can be captured in the code.
It helps to have a teammate give an introduction to the application; a description of what the application does, its place in the landscape, relevant history and design choices, current plans (are you actively developing new features or mostly doing maintenance?), which parts of the application are changed more than others, as well as links to existing documentation and other relevant information. Also think about which stories a new team member can pick up to help them become familiar with the project.
As a new team member, check out all relevant repositories. Make sure you can build the project, run the tests and run the application locally. How to do this will hopefully be described in the README. If not, consider adding it. Running the project locally can help you to both see how the application works by trying it out, and make sure that you can test your changes when you are done.
Opening a project in the IDE allows you to search and navigate your codebase more easily, as well as use additional useful IDE features. Let’s dive into several powerful IntelliJ IDEA features you can use to quickly be productive.
Note: Keyboard shortcuts are provided for macOS and Windows/Linux respectively.
Project overview
Explore modules and packages in the Project tool window (⌘1 | Alt+1) to get an idea of the project. If you prefer a visual representation, IntelliJ IDEA can generate several types of diagrams for you, including UML class diagrams. Also consider drawing your own diagrams; this will help you retain the information better and lets you focus only on the information you need for the task at hand.
To understand dependencies between modules, packages and classes, the Dependency Structure Matrix (DSM) can help. Open the DSM from the main menu using Code | Analyze Code | Dependency Matrix….

In this example the matrix displays modules in a project. As you can see in the legend at the top right, dependencies are marked in blue and the direction of the dependencies is marked in green and yellow; the module marked in green depends on the module marked in yellow. Visualising the dependencies can help us to get an overview of the application. If you prefer, you can also generate a Project Modules diagram. Note that this diagram only gives you one side of the equation (which modules the selected module depends on).
Search & navigate
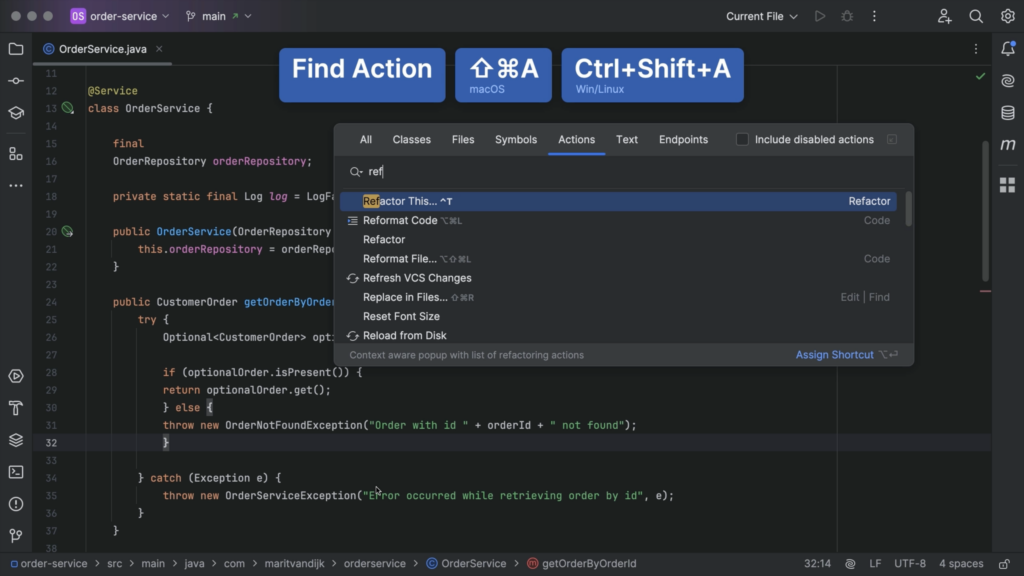
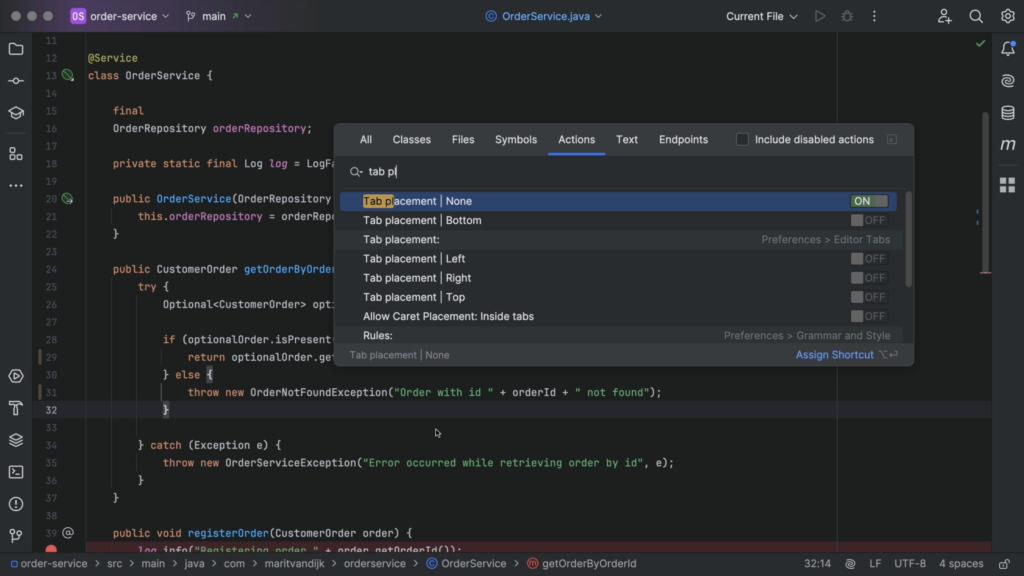
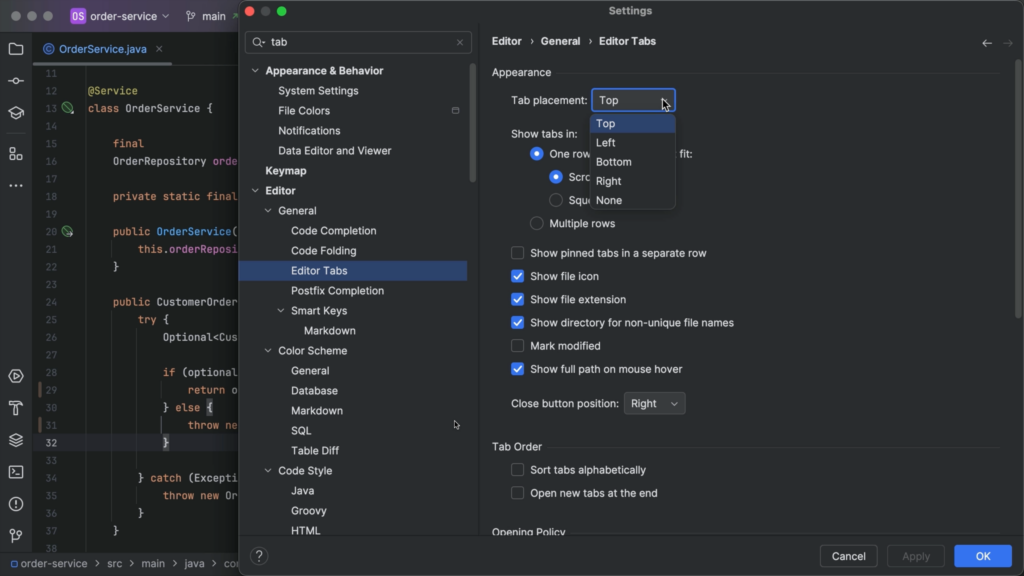
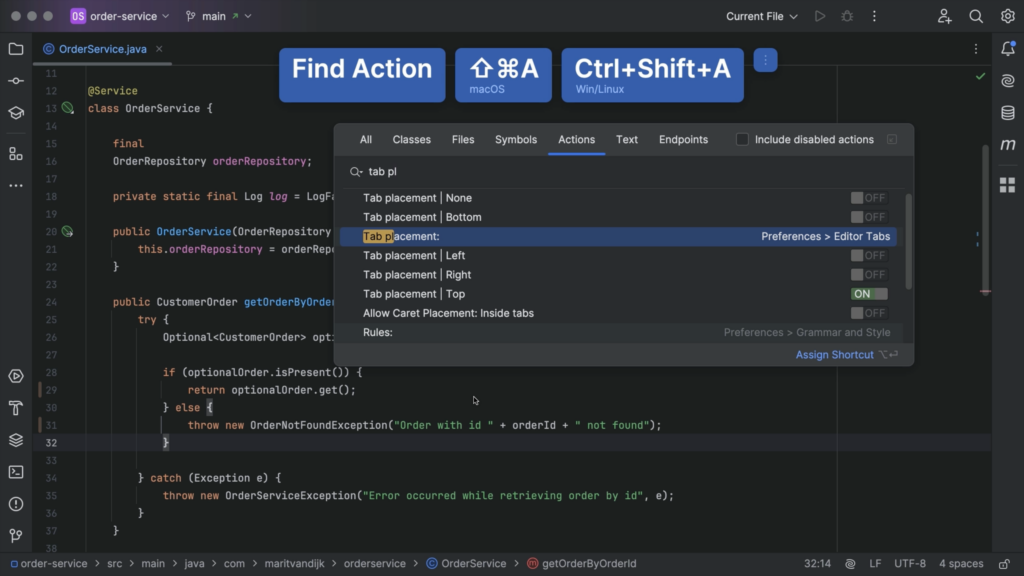
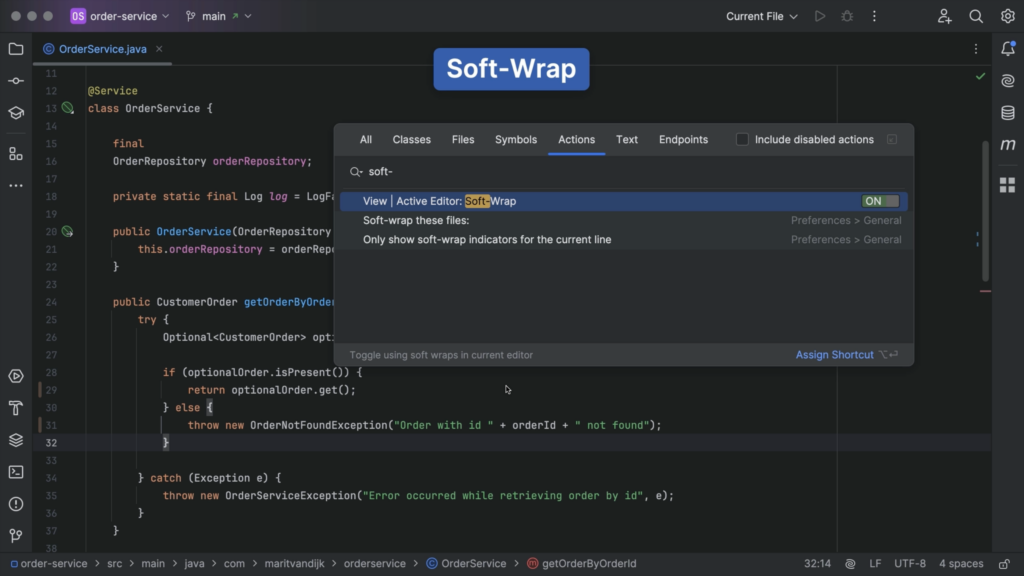
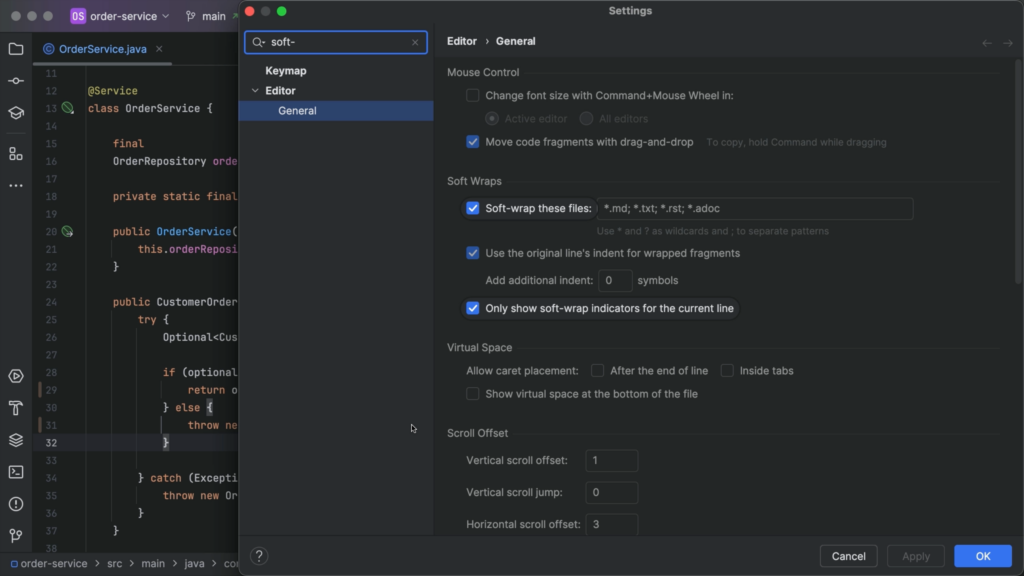
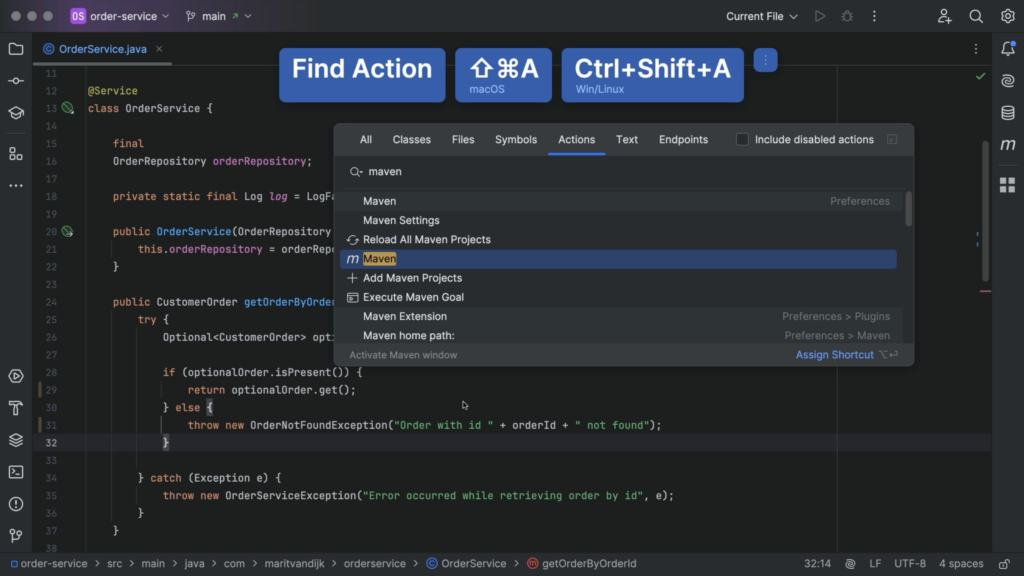
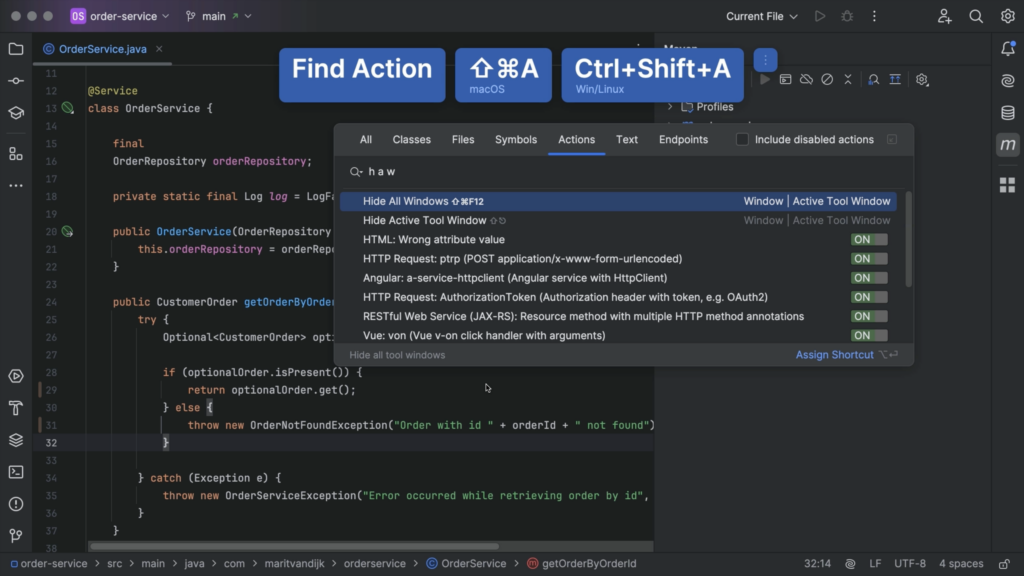
Use Search Everywhere (⇧⇧ | Shift+Shift) to find anything in your project, including IDE settings & features. Other useful navigation features include Recent Files (⌘E | Ctrl+E) or Recent Locations (⌘⇧E | Ctrl+Shift+E). Knowing how to search and navigate code in your IDE is helpful when working with existing code, so you can focus on the task at hand.
Looking at a slice of the application
Instead of looking at the whole code base, look at a specific slice of the application. For example, find the main method and see what the application does from there, find a specific endpoint and trace the code down to the database, or find the location where an error is thrown and trace the code back up to how you got there.
Understanding a piece of code
At some point you’ll find a piece of code that you will need to understand, for example, to fix a bug or make necessary changes. If you’ve ever been overwhelmed by a piece of code without any idea how to start, this is where code reading exercises can help! Of course, your IDE can also provide you with handy features. For starters, IntelliJ IDEA provides you with hints about the code, like syntax highlighting, inlay hints and gutter icons.
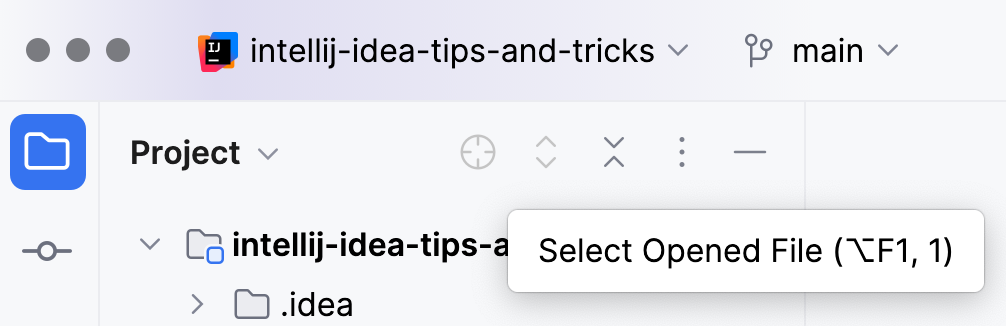
One of the reasons code can be confusing is because of a lack of information. For example, you might not know the exact implementation of a class or method. While you can Jump to Source (⌘↓ | F4) to navigate to the relevant code, and use shortcuts to Navigate Back (⌘[ | Ctrl+Alt+Left Arrow) and Navigate Forward (⌘] | Ctrl+Alt+Right Arrow), it’s easy to get lost in a large code base. To see where a particular file is located in the project, use the crosshair icon at the top of the Project tool window.
It is also possible to pull up additional information using Quick Documentation (F1 | Ctrl+Q) to show the Javadoc, Quick Definition (⌥␣ | Ctrl+Shift+I) to see the code or Type Information (⌃⇧P | Ctrl+Shift+P) to determine which type is returned by an expression.
Did you know IntelliJ IDEA can help you work with regular expressions? You can mark a String as RegExp from Show Context Actions (⌥⏎ | Alt+Enter), using Inject Language or Reference and selecting RegExp (or a specific flavor of regular expressions). From the Show Context Action menu, select Check RegExp to open a popup where you can check whether a certain String matches the regular expression. Place your String in the Sample field in the popup; a yellow warning sign will be shown if the String is incomplete, a red exclamation mark shows the String does not match, or a green check mark will indicate that the String matches the RegExp.

The structure of the code
Code is not read from top to bottom. Code doesn’t run linearly either! Developers “scan” code looking for the parts you’re interested in. Using white space and formatting can help improve readability.
When you write code in IntelliJ IDEA, the code will be formatted automatically. If you encounter code that isn’t properly formatted, you can reformat it (⌘⌥L | Ctrl+Alt+L).
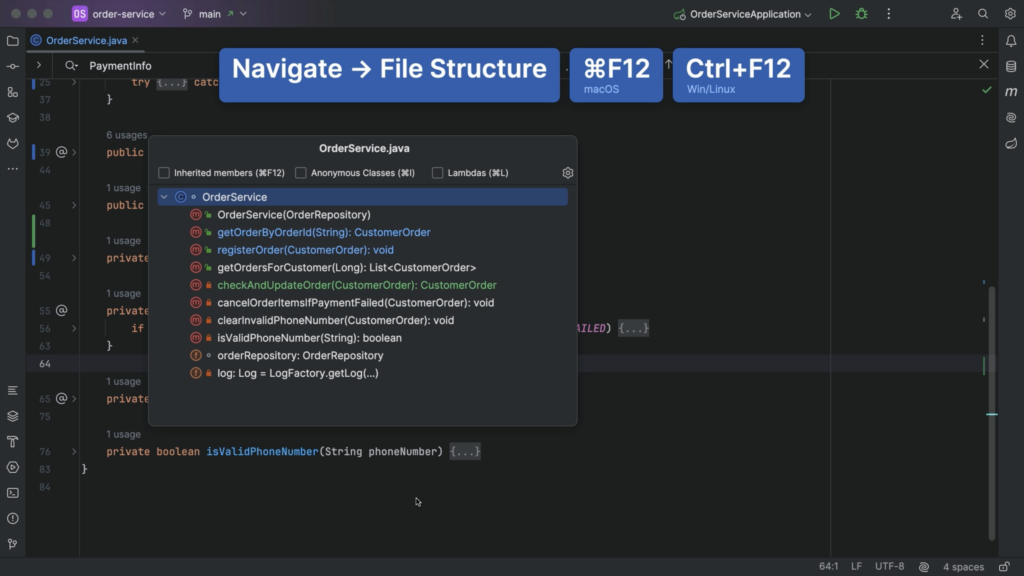
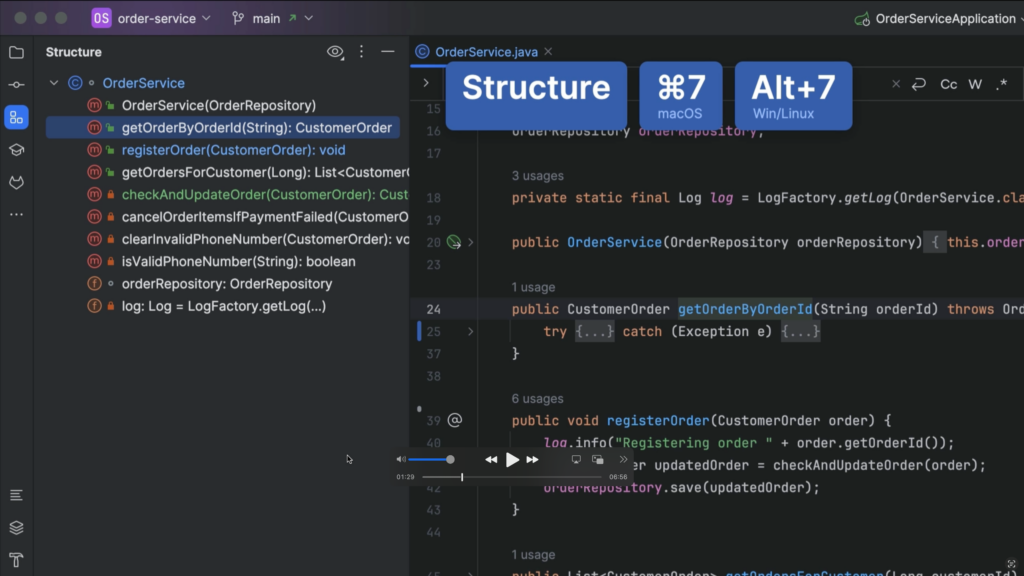
You can collapse the code (⌘⇧- | Ctrl+Shift+Minus) to get an overview of a class without being overwhelmed with too many details. You can expand it again (⌘⇧+ | Ctrl+Shift+Plus) as needed. Other ways to get a quick overview of the code are to use the File Structure popup (⌘F12 | Ctrl+F12), or the Structure tool window (⌘7 | Alt+7).
When reading code, it might help to play with it a little bit as you try to understand it. Remember to revert any changes you make!
Restructure
Restructure the code by moving code blocks around to match your mental model, preferred style or coding conventions. Use shortcuts to move a statement up (⌘⇧↑ | Ctrl+Shift+Up Arrow) or down (⌘⇧↓ | Ctrl+Shift+Down Arrow).
Refactoring
You can use refactoring to change the code to aid your understanding. Rename variables or methods (⇧F6 | Shift+F6), extract variables (⌥⌘V | Ctrl+Alt+V) or extract methods (⌥⌘M | Ctrl+Alt+M) and give them meaningful names, inline variables (⌥⌘N | Ctrl+Alt+N) you don’t need. The most frequently used refactorings are available in the Refactor This menu (^T | Ctrl+Alt+Shift+T) . Additional refactorings or quick fixes might be available under Show Context Actions (⌥⏎ | Alt+Enter).
Testing
Look at the tests for a piece of code to see what this code is supposed to do, using Navigate to Tests (⌘⇧T | Ctrl+Shift+T). Hopefully names of the tests will express the intended behavior of the application. This is useful for two reasons: 1. The tests will serve as executable documentation of the system. 2. Should the tests fail in the future, good names can help to quickly tell you what’s wrong, so you don’t spend more time than necessary analyzing failures.
Debugging
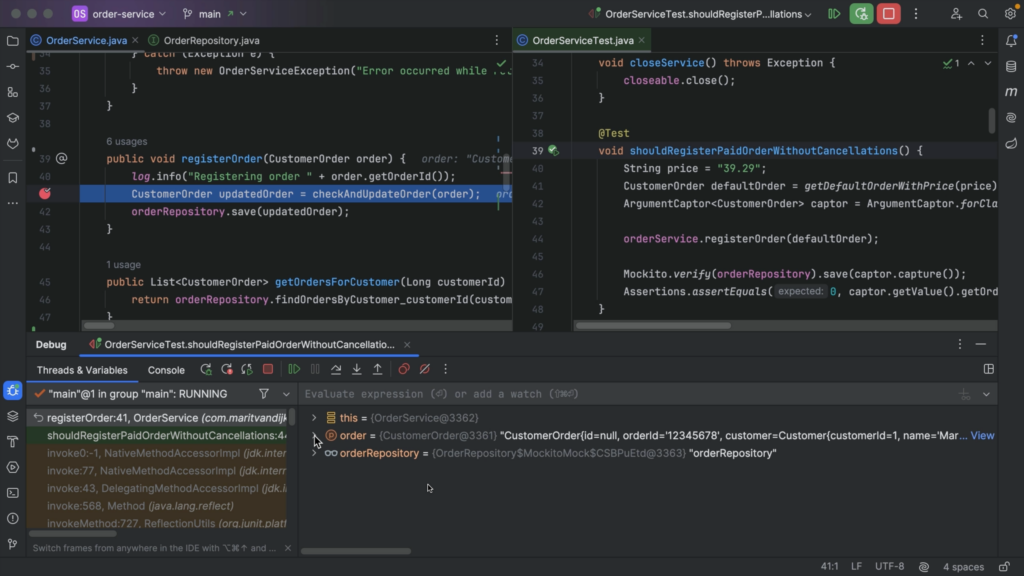
Run code through the debugger to see if the actual behavior of the code matches your understanding. Place a breakpoint (⌘F8 | Ctrl+F8) in the code at the point where you want to observe its state. Run the test in debug mode (⌃D | Shift+F9); execution will halt when it hits the breakpoint. You can observe the state of objects & variables in the editor and in the debug window, and look at the call stack in the Debug tool window. Continue execution by either stepping into a method (F7) or stepping over a line (F8).
The IntelliJ IDEA debugger is very powerful and has many useful features. I highly recommend familiarizing yourself with its features; this will come in handy next time you need to urgently debug your code for a production incident!
Version control
Sometimes you might want to know how the code came to be the way it is, and do a bit of what I like to call “Git archeology”. Use Annotate with Git Blame to see when the code was last changed. Click the commit in the gutter to navigate to that commit in the Git tool window and look at the diff. If you’re using JetBrains AI Assistant [13], you can also ask it to explain the commit to you. Right-click the commit and select Explain Commit with AI Assistant from the context menu.

AI Assistant features to understand code
Finally, AI coding assistants, like JetBrains AI Assistant, may offer other useful features for understanding existing code. For example, chat with an AI Assistant and ask questions about software development, your project’s code and version control. Ask it to explain specific code to you, maybe even explain regular expressions, SQL queries, cron expressions, etc.
Because it is deeply integrated within IntelliJ IDEA, JetBrains AI Assistant can explain runtime errors right from the console. With another assistant you may need to copy-paste the error into a chat window. Alternatively, use an AI assistant to write documentation for a class or method. The generated Javadoc is often more concise than the explanation in the chat.
Conclusion
I hope you found this overview useful to see how to approach understanding existing code with the help of IntelliJ IDEA. This article is based on my talk “Reading Code”, which includes live demos of the features discussed in this article.
Shortcuts
| Name | macOS | Windows/Linux |
| Project tool window | ⌘1 | Alt+1 |
| Search Everywhere | ⇧⇧ | Shift+Shift |
| Recent Files | ⌘E | Ctrl+E |
| Recent Locations | ⌘⇧E | Ctrl+Shift+E |
| Jump to Source | ⌘↓ | F4 |
| Navigate Back | ⌘[ | Ctrl+Alt+Left Arrow |
| Navigate Forward | ⌘] | Ctrl+Alt+Right Arrow |
| Quick Documentation | F1 | Ctrl+Q |
| Quick Definition | ⌥␣ | Ctrl+Shift+I |
| Type Information | ⌃⇧P | Ctrl+Shift+P |
| Show Context Actions | ⌥⏎ | Alt+Enter |
| Reformat code | ⌘⌥L | Ctrl+Alt+L |
| Collapse all | ⌘⇧- | Ctrl+Shift+Minus |
| Expand all | ⌘⇧+ | Ctrl+Shift+Plus |
| File Structure | ⌘F12 | Ctrl+F12 |
| Structure tool window | ⌘7 | Alt+7 |
| Move Statement Up | ⌘⇧↑ | Ctrl+Shift+Up Arrow |
| Move Statement Down | ⌘⇧↓ | Ctrl+Shift+Down Arrow |
| Refactor Rename | ⇧F6 | Shift+F6 |
| Extract Variable | ⌥⌘V | Ctrl+Alt+V |
| Extract Methods | ⌥⌘M | Ctrl+Alt+M |
| Inline Variable | ⌥⌘N | Ctrl+Alt+N |
| Refactor This | ^T | Ctrl+Alt+Shift+T |
| Navigate to Tests | ⌘⇧T | Ctrl+Shift+T |
| Toggle Breakpoint | ⌘F8 | Ctrl+F8 |
| Debug | ⌃D | Shift+F9 |
| Step into | F7 | F7 |
| Step over | F8 | F8 |