How many shortcuts can you remember? Three? Five? More? I try to learn as many as I can and still forget some of them…
What if you could unlock IntelliJ IDEA features, without having to remember shortcuts? You can still use shortcuts if you want. But you don’t haveto.
Command completion (..) is a new feature in IntelliJ IDEA that lets you discover and execute IDE actions right from your editor.
Command completion extends regular completion
Command completion is an extension of regular code completion – something every developer already uses. For example, when you have a variable, you can type a dot to show you completion options. It will show you API completion (all of the methods you can call on this variable), and postfix completion (templates you can apply to this variable). The list now also includes commands; all relevant commands for your current context. Code completion (a single dot) is now a universal entry point for all relevant actions.
To filter the list to show commands only, type two dots ... As the list can be quite long, the list is searchable, so you can type part of the command you want to use.
Command completion extends regular completion
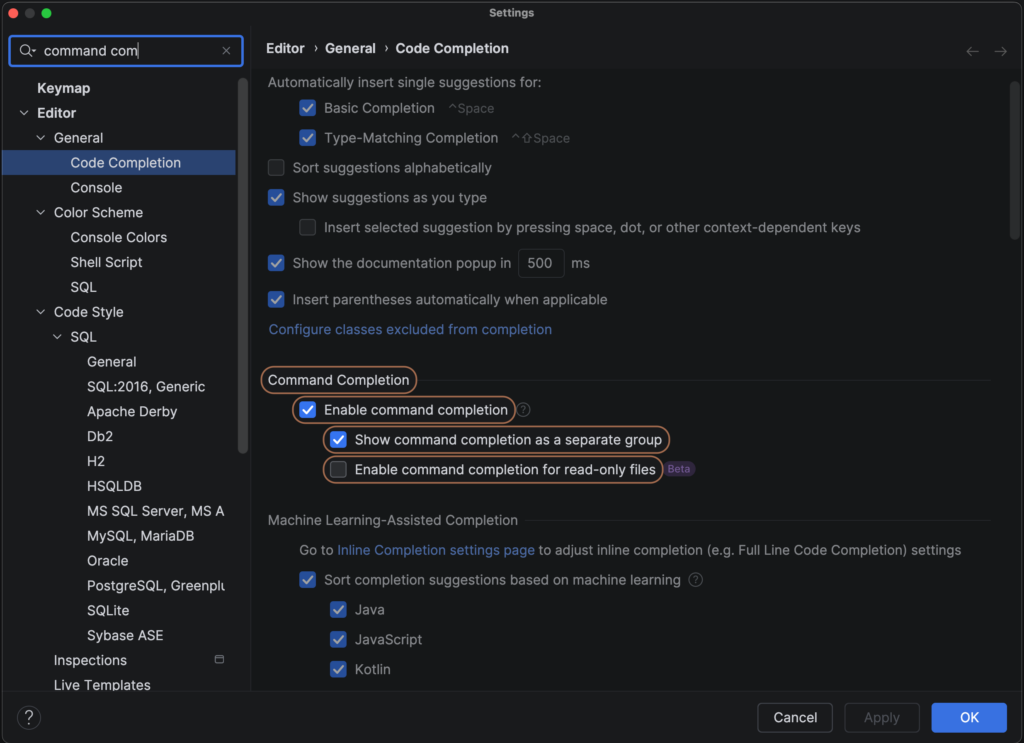
By default, the commands are shown in a separate section of the list. If you prefer Commands to be part of the regular completion list, you can adjust this in the Settings. Use Search Everywhere (Shift Shift) and look for “command completion” to go straight to the relevant settings and uncheck the option Show command completion as a separate group.
Command Completion Settings: Show command completion as a separate group
Fix errors and warnings with command completion
You can use this new feature to fix errors and warnings in your code. If you write code that doesn’t compile, IntelliJ IDEA will tell you. You can navigate to the error using F2 and press Alt+Enter to show context actions. However, Alt+Enter gives you only a few options; it is designed to give you the most relevant fixes to your problem. That means it might not always include the action you want to perform. On the other hand, command completion (..) offers you all actions that are relevant in your current context. IntelliJ IDEA will give you a preview of what each command will do.
Fix errors and warnings
Perform file- or class-level actions
It is now possible to unlock this type of completion in places where it wasn’t available before, like on a blank line. Typing a dot on a blank line now shows you file-level actions, like Reformat Code or Optimize Imports. For example, use Optimize Imports to remove an import statement that is no longer needed.
Perform file or class level actions
Refactoring and code transformation
Command completion can also help you when refactoring or transforming your code. When writing code, you can use it to keep moving forward. For example, to create classes, methods and fields.
Keep moving forward and create classes, methods and fields
You can use it to generate code for you, such as a toString() method.
You can transform your code as you go, for example to make use of modern Java language features. For example, you can refactor a class into a record, using only command completion.
Transform code
Use command completion for navigation
You can use it for navigation. For example, we can navigate to the String class declaration. You’ll notice that this file is read only! How will we use completion here? Don’t worry, you can change your settings to be able to use command completion in read-only files!
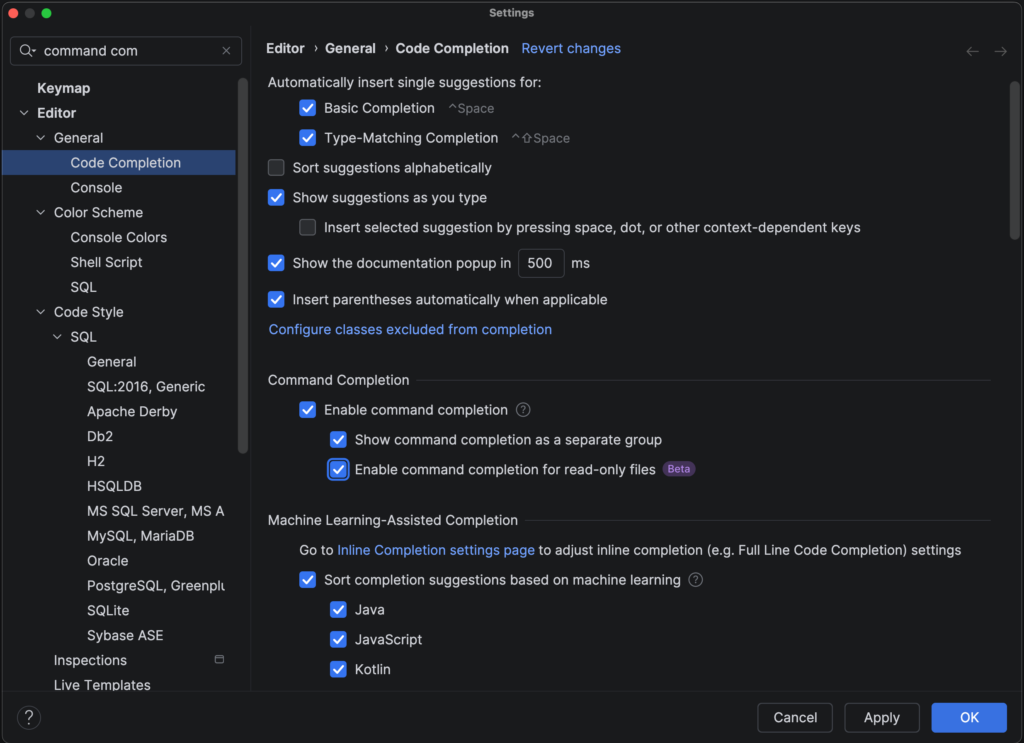
Open the Settings for Command Completion, by using Search Everywhere (Shift Shift) and searching for “command completion”. Select the option Enable command completion for read only files. Now, you can use command completion in read-only files, for example to navigate back to where you were.
Command Completion Settings: Enable command completion for read only files.
If you want to rename your class, you can use a shortcut to do so, but you need to know this shortcut (⇧F6 on macOS / Shift+F6 on Windows/Linux). Now, you can use command completion instead. Go to the end of the class or method name you want to rename and type ..rename.
Aliases for several commands
In some cases, you don’t even need to know the exact name of the command you’re looking for, as some commands have aliases. For example, you can also use ..change name instead of ..rename.
Aliases
This makes features even more discoverable; you don’t need to remember the exact name of the feature.
Imagine we declare a new instance of a class Person. To assign this new Person() to a variable, you can use the shortcut to Extract Variable (⌥⌘V on macOS / Ctrl+Alt+V on Windows/Linux). But this requires you to know this feature exists and the relevant shortcut.
Alternatively you could use postfix completion .var to create a variable. But that would again require you to know (or quickly be able to find) this specific postfix completion.
Instead, you can now use command completion to introduce a local variable. After the declaration of the new instance, use ..Introduce local variable.
Command completion complements existing features
If you want, you can still use postfix completion. For example, you type person.sout to print variable person to System.out: System.out.println(person);.
You can transform this code to modern Java and use features introduced in Java 25, like simple IO. After the line System.out.println(person); type .. and select ..Replace with IO.println().
You can use refactoring, like Extract Method (⌥⌘M on macOS / Ctrl+Alt+M on Windows/Linux), even if you don’t remember the shortcut. To do so, type .. and select ..Extract method after the method you want to extract.
Refactor: Extract method
What if you want to add JavaDoc to your code? You could use Alt+Enter to Add JavaDoc. But now you can also use command completion to generate JavaDoc, and convert it to Markdown.
Command completion is as easy as adding a dot, or two..
As you can see, using command completion is as easy as adding a dot, or two..
Conclusion
Command completion extends regular completion – which you already use. It lets you discover and use IntelliJ IDEA features without having to remember shortcuts. This keeps you in the flow of coding; you can think about what you want to do, instead of how to do it.
Type a . to find commands as part of regular completion, or .. to see all available commands relevant to your current context. You might discover powerful features you never knew were there!
In June, I presented the talk Learning modern Java the playful way with Piotr Przybył at Devoxx Poland 2025. For this presentation, I thought it would be funny to have a custom progress bar running in IntelliJ IDEA during our demos. Since we adapted our presentation to the Polish audience a little, I figured a Polish flag and #PolishSmile would be appropriate.
Creating an IntelliJ IDEA plugin
As I had never implemented an IntelliJ IDEA plugin before, I had no idea how hard it would be. When I asked my colleague, Anton Arhipov, he suggested using Junie to vibe code it. And given that this was just a fun idea for a plugin intended to be used only once, it was the perfect candidate for vibe coding: We don’t care that much about the code quality, since we won’t be maintaining it. All we need is for the plugin to work.
We started a new project using the Plugin template on GitHub. While Junie may or may not be able to do the configuration for such a project, there is a deterministic template available; why not use that?
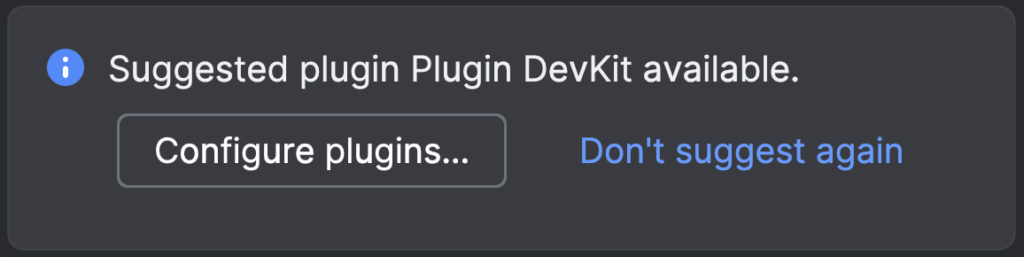
When you open the project, IntelliJ IDEA will show a popup Suggested plugin Plugin DevKit available. Clicking the button Configure plugins will open Settings | Plugins with this plugin selected and the option to Install it.
Using Junie for vibe coding
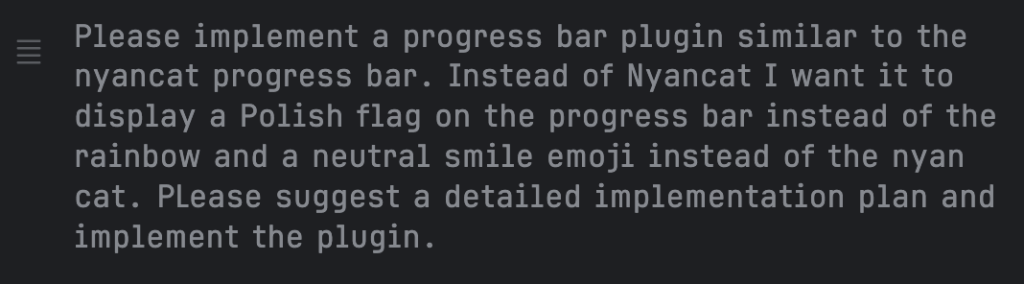
Then we started with a prompt asking Junie to implement the plugin similar to the Nyan Progress Bar plugin. The prompt we used was as follows:
“Please implement a progress bar plugin similar to the nyancat progress bar. Instead of Nyancat I want it to display a Polish flag on the progress bar instead of the rainbow and a neutral smile emoji instead of the nyan cat. PLease suggest a detailed implementation plan and implement the plugin.”
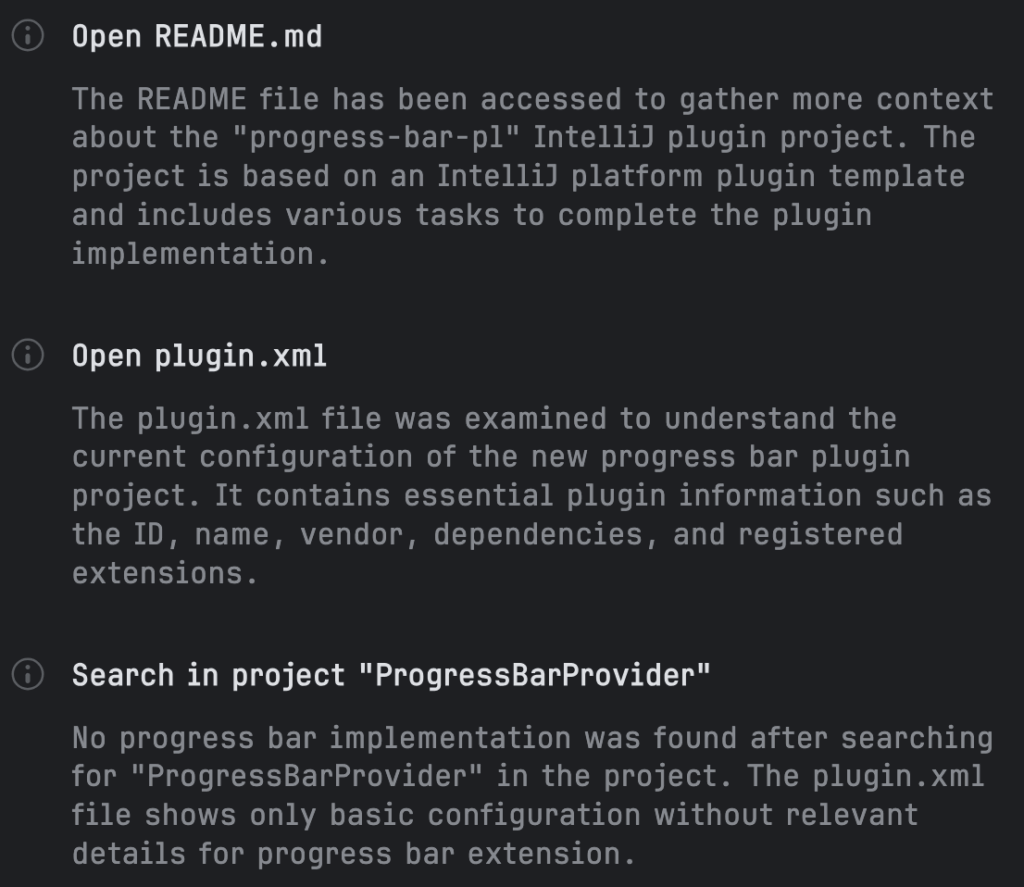
Junie correctly identified that no implementation was available and set about creating one. Before doing so, it first scanned the project and looked at the README and plugin.xml, correctly identifying that “the project is based on an IntelliJ platform plugin template”.
The plugin template project includes multiple Gradle goals, including runIDE; which allows you to run your plugin on an instance of the IDE so that you can try it out. This is perfect for our vibecoded project, since all we care about is whether the plugin does what we want.
When Junie is done, it will say so in the Junie tool window and give an overview of files that were changed. The links to the files are clickable, if you want to look at the diff for these files.
First results
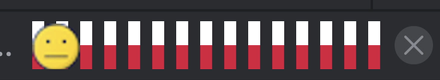
The first implementation of the progress was a step in the right direction but not quite what we wanted. Instead of a continuous Polish flag, it showed only small sections of white and red. Also, while the code referenced an icon, no icon was available, so we had to download a Polish smile emoji ourselves and add it to the project in the right location. We also had to manually resize this image to fit the progress bar, which unfortunately made it slightly pixelated…
One of the things I like about Junie is that it can to build your project, and will try to fix any issues if the project doesn’t build successfully. It might not try to do so every time (AI is non-deterministic after all), so if it doesn’t you might want to add something to your `.junie/guidelines.md` along the lines of “DO make sure the project builds successfully.
Also, Junie might stop if it cannot resolve issues in several tries. This is usually a hint to either break up the task into smaller pieces and/or provide more detailed information.
In our example, we tried prompting Junie to make the Polish flag on the progress bar continuous, but with no luck. We used the following follow up prompt:
“i want the brogress bar to be continuous and smooth and it should move 5 times slower”.
(Note that even though the prompt has typos, Junie doesn’t seem to mind.)
Providing a code example for better results
Unfortunately, this prompt did not have the desired outcome. Instead, Anton had the idea to take part of the Nyan Progress Bar plugin implementation and provide that code to Junie as an example to work with. We did so and used the following prompt:
“analyze the code in NyanCatProgressBar.txt (it is in Java) and create PolishFlagBProgressBar in Kotlin by following the same logic but with the polish flag colors”
This turned out to be a great idea; the plugin showed a continuous Polish flag now. This goes to show that providing Junie with examples of what you want will lead to better results.
Unfortunately, the smiley still jumped up and down on the progress bar, which is not what I wanted. But I figured it was good enough for a plugin I would only use for fun anyway. It wasn’t until after the conference that I realised that the smiley jumped up and down because that is what the Nyan Cat does in the Nyan Progress Bar. It took me five minutes to prompt Junie to fix this.
The next challenge was to build the plugin in a way that I could install it in IntelliJ IDEA from disk (as I had no plans to publish the plugin). A plugin project can be built using the task buildPlugin. Unfortunately this didn’t work for our project. It took several tries to get Junie to fix it, but I have to say that I was impressed that Junie fixed my Gradle problem.
Installing the plugin
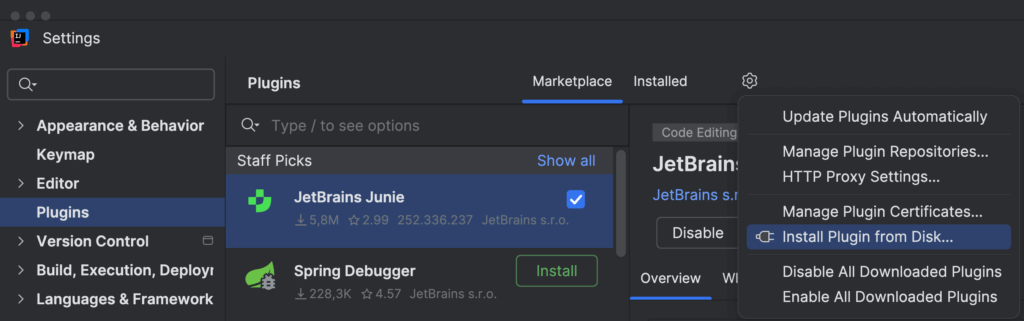
Once the project was built successfully, I could install it. To install a plugin from disk, open Settings (⌘, on macOS) / Ctrl+Alt+S on Windows/Linux) and go to Plugins. On the Plugins page, next to Marketplace and Installed, click the icon to Manage Repositories, Configure Proxy or Install Plugin from Disk. From the menu, select Install Plugin from Disk, and select the .jar file for the built plugin from your file system.
Uninstalling the plugin
When it came time to uninstall the plugin, I found that I had trouble doing so. Fortunately my colleagues were able to provide a workaround. To manually uninstall the plugin, delete the plugin from the plugins main directory, which you can find in Help | Diagnostic Tools | Special Files And Folders.
Results
Remember, this plugin is not meant to be published to the marketplace. However, if you’re interested in the code, you can find it here.
Overall, it was fun vibe code something silly with Junie and I am happy with the result. Also, it turns out, I could actually reuse the plugin when speaking in Poland again.
Recently my friend Piotr posted a question on social media about how to format records in IntelliJ IDEA…
How to format records
Sidenote: I don’t know why he wouldn’t just ask me directly, but I guess this was more fun 😉
Configuring code style
IntelliJ IDEA can format your code for you. Code will be formatted as you type it, and if needed you can Reformat the code (⌘⌥L on macOS) / Ctrl+Alt+L on Windows/Linux). If the (pre)defined code style isn’t to your liking, you can change it.
By default, IntelliJ IDEA will format records with the curly braces {} on two lines. When you apply Reformat to a record, IntelliJ IDEA will let you know “No lines changed: content is already properly formatted”.
Content is already properly formatted
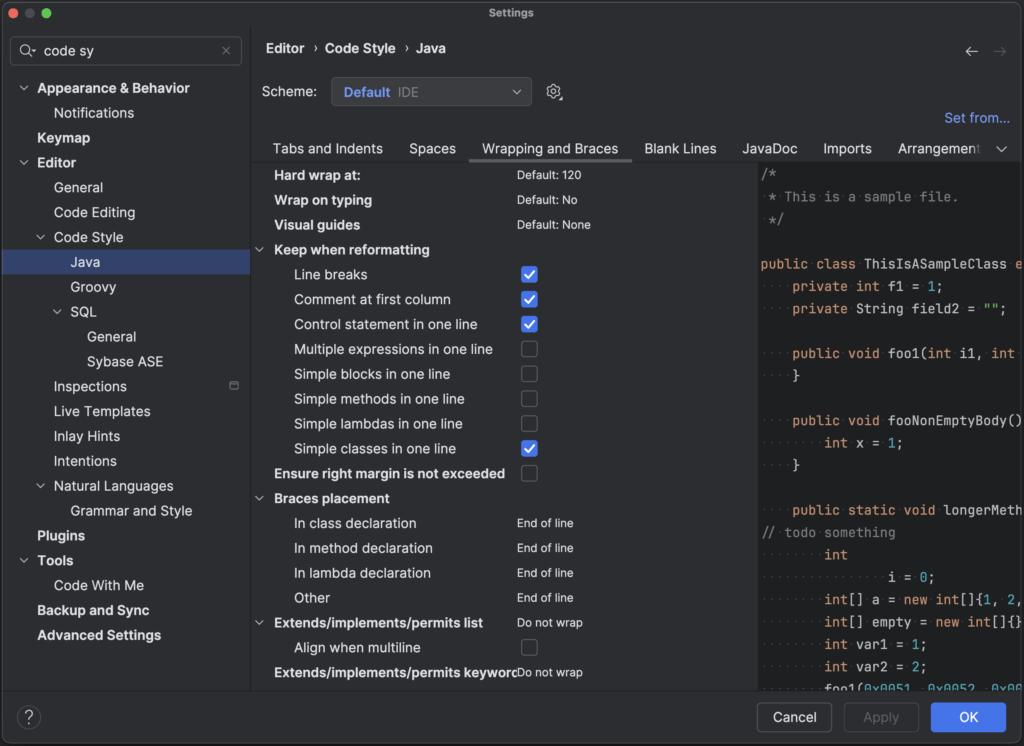
To change the formatting for records so that the curly braces {} will be on the same line, open Settings (⌘, on macOS / Ctrl+Alt+S on Windows/Linux) and go to Editor | Code style | Java. Open the tab Wrapping and Braces and in the section Keep when reformatting select the option Simple classes in one line. Don’t forget to Save Changes.
Settings – Code style
Now if we have any code with a record (or any other simple class), we can use the Reformat the code (⌘⌥L on macOS) / Ctrl+Alt+L on Windows/Linux) to reformat the simple class accordingly. Note that you’ll need to use the shortcut twice to remove custom line breaks.
The same formatting will be applied in other situations. For example, when we add another record to the file, and use Complete Current Statement (⌃⇧⏎ on macOS / Ctrl+Shift+Enter on Windows/Linux), our new record will be completed with the curly braces {} on one line.
What about generating a new Record?
From the Project tool window, we can generate a new record. Use GenerateNew (⌘N on macOS / Alt+Ins on Windows/Linux) and select Java class. In the New Java Class dialog, type the name of your new record, and select Record. Note this record is still generated with the curly braces {} on 2 lines.
To make sure a newly created record is also formatted with the curly braces {} on one line, we can change the File template for Record.
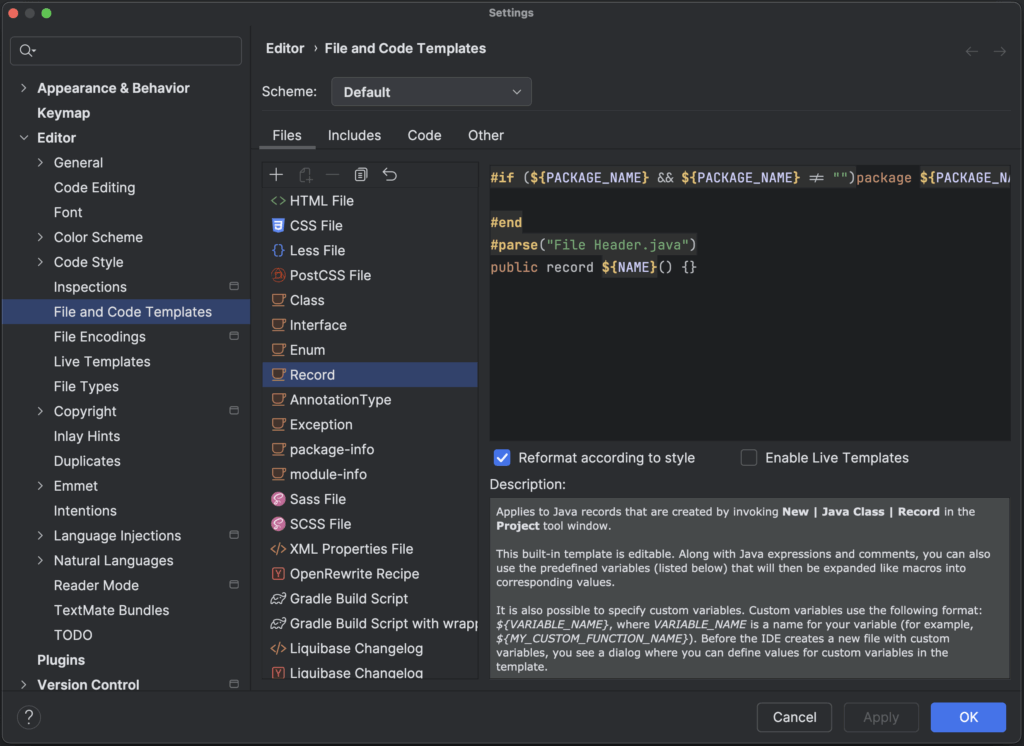
Open Settings (⌘, on macOS / Ctrl+Alt+S on Windows/Linux) and go to Editor | Code style | File and Code Templates. Open the template for Record and change the template to have the curly braces {} on one line. Again, don’t forget to Save Changes.
File and Code Templates – Record
Now when we generate a new record it will be formatted with the curly braces {} on one line.
Note that changing only the File Template for Record is not enough to format records with the curly braces {} on one line. For one, it will be immediately reformatted upon creation according to the code style, as long as the Reformat according to style box is checked for this file template. Even if we uncheck this option, reformatting a file with a record would reformat it to the code style (which by default is {} on 2 lines).
In this blog post, we will look at how to debug Java code using the IntelliJ IDEA debugger. We will look at how to fix a failing test, how to find out where an `Exception` is thrown, and how to find problems with our data. And we will learn some neat tricks about the debugger in the process!
To illustrate using the debugger, we will use a small example application that reads test scores from a CSV file, calculates the average score per student, and prints the results to the console. If you’d like to follow along, you can find the code here.
Debug a failing test
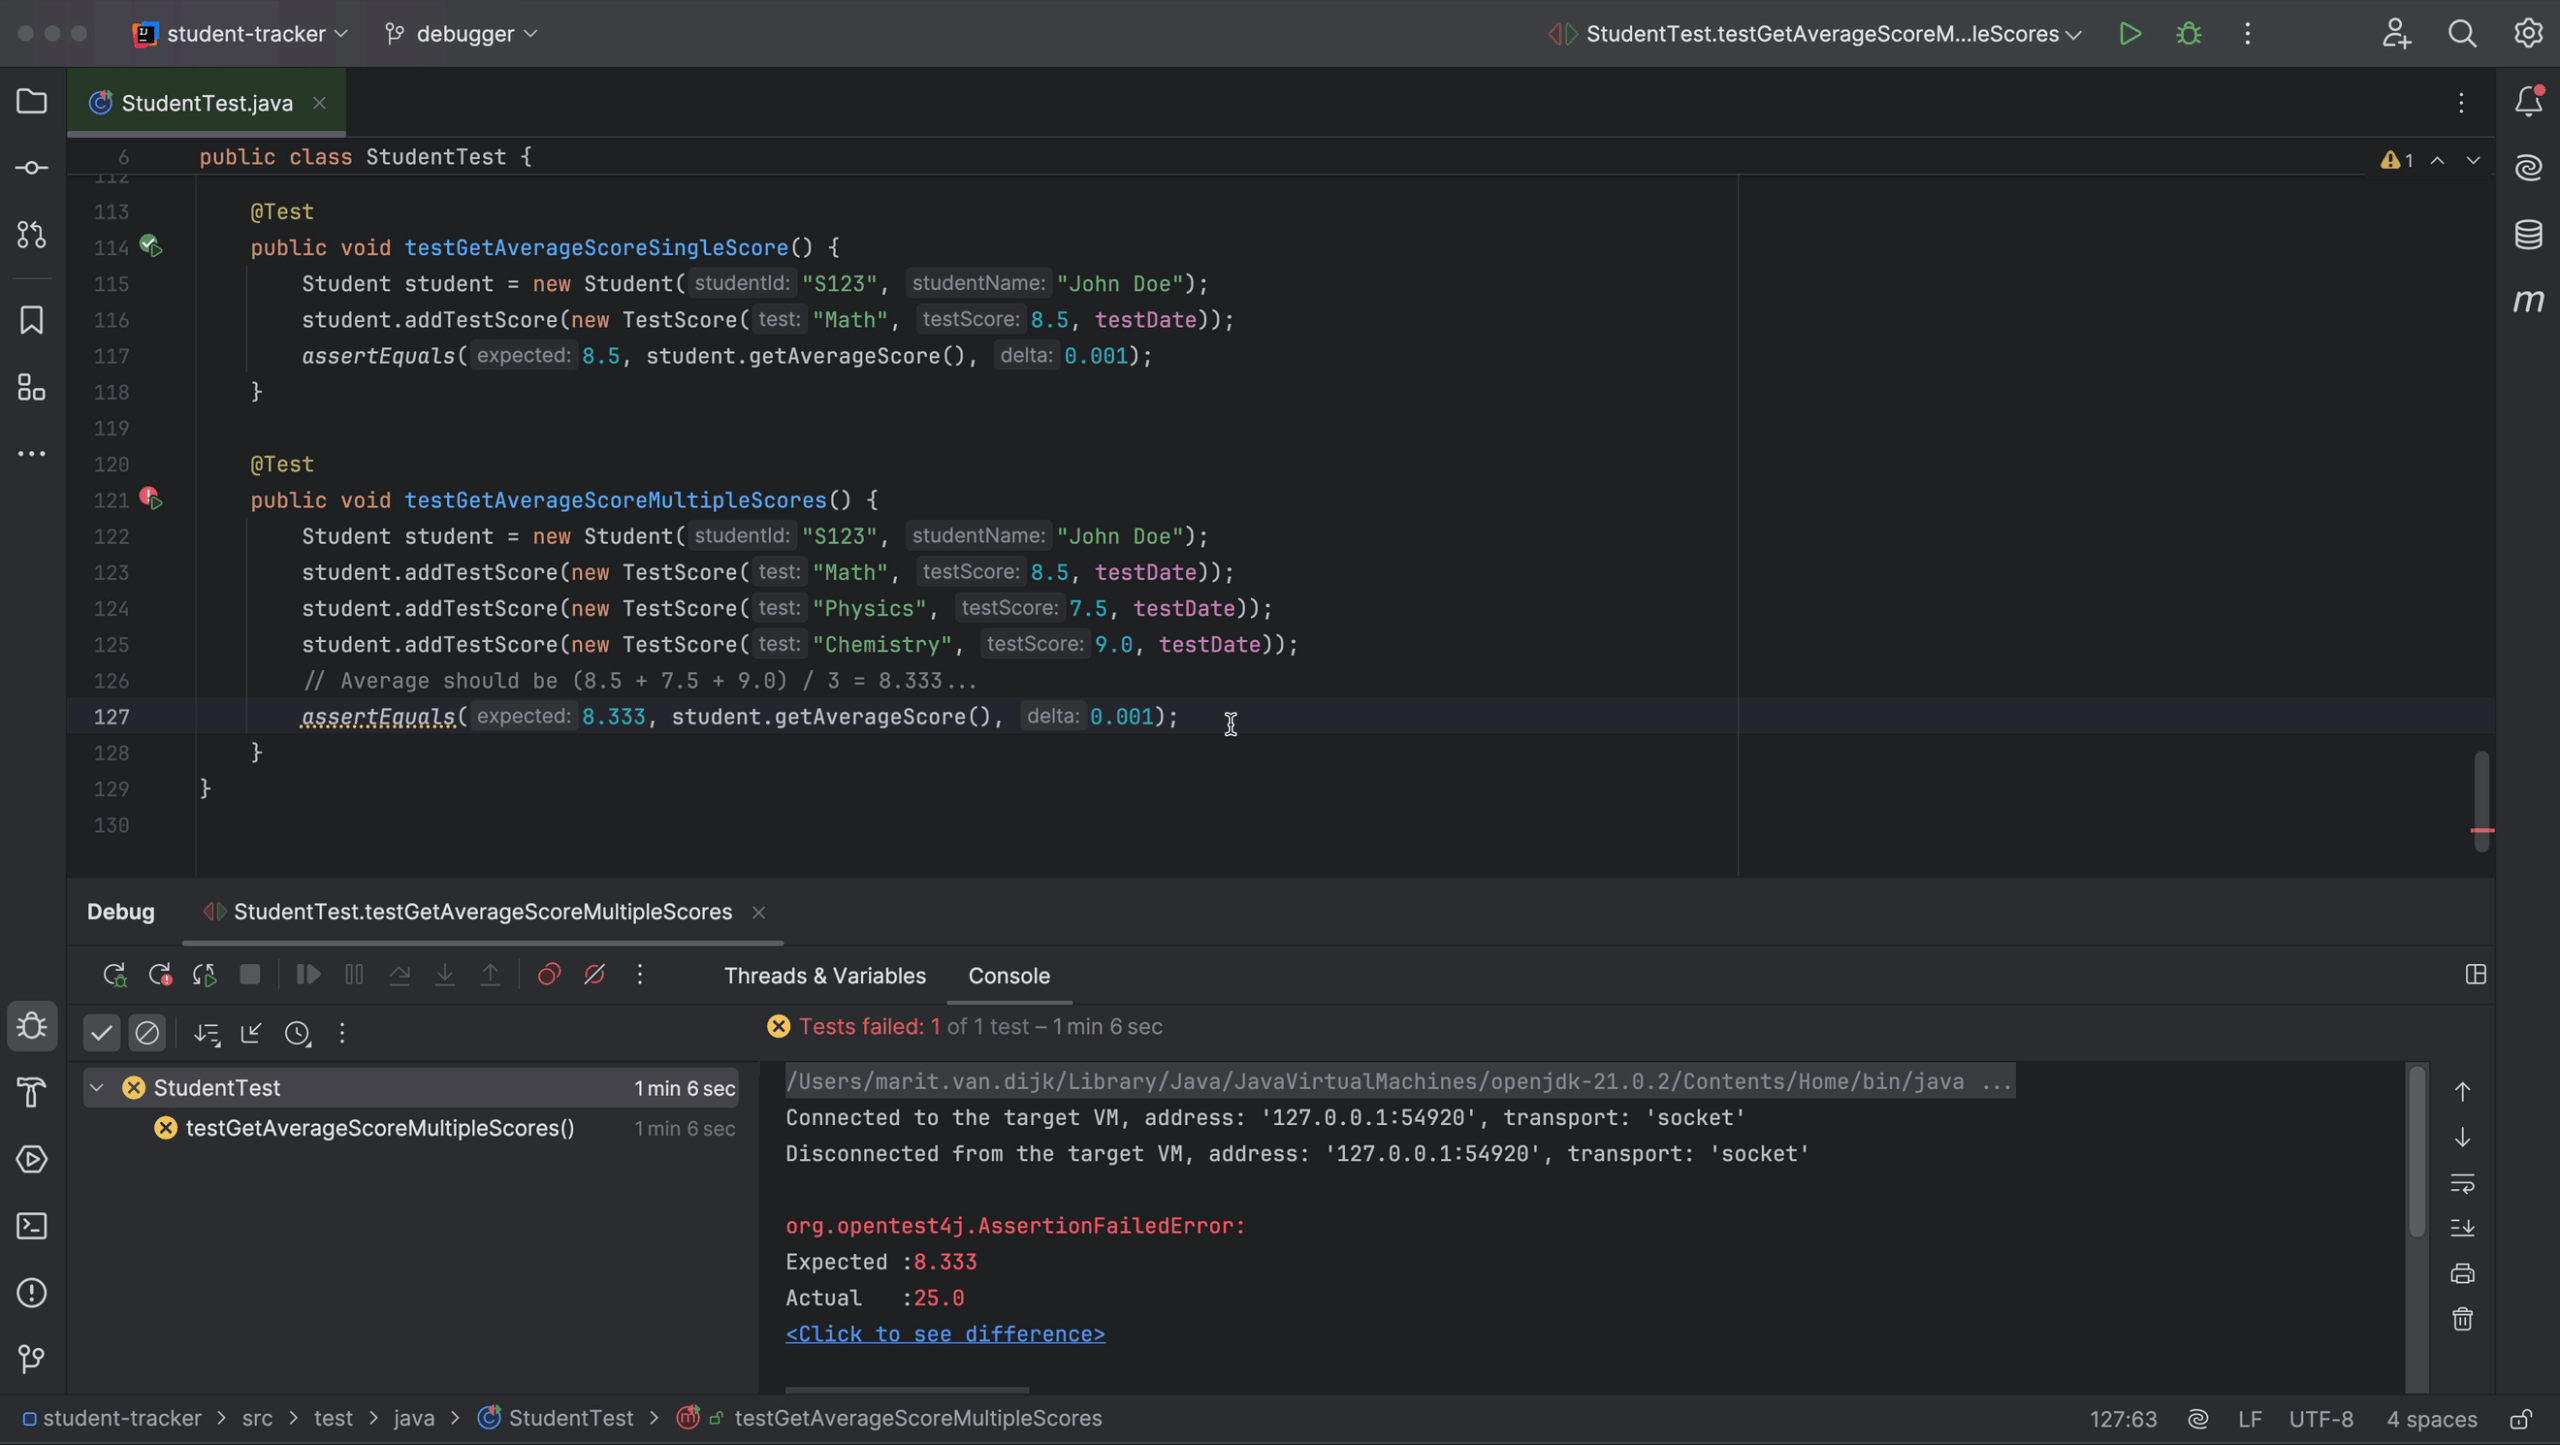
One reason you might need the debugger is when one of your tests fails. In our example application, when we run the tests in `StudentTest`, we see that there is a failing test.
Failing test
Currently, this test fails because the expected average does not match the result of the method `getAverageScore()`, as we can see on line 127. We can use the debugger to find out what the problem is and how to fix it. Let’s navigate to this method so we can set a breakpoint there to see what happens.
Set a breakpoint
We can navigate to the method `getAverageScore()` using Jump to Source (⌘↓ on macOS / F4 on Windows/Linux) when our cursor is on the method. We can place a breakpoint, either by clicking in the gutter or using the shortcut (⌘F8 on macOS / Ctrl+F8 on Windows/Linux). Place the breakpoint on the first line of the method (line 50).
Breakpoint in method
Run in Debug mode
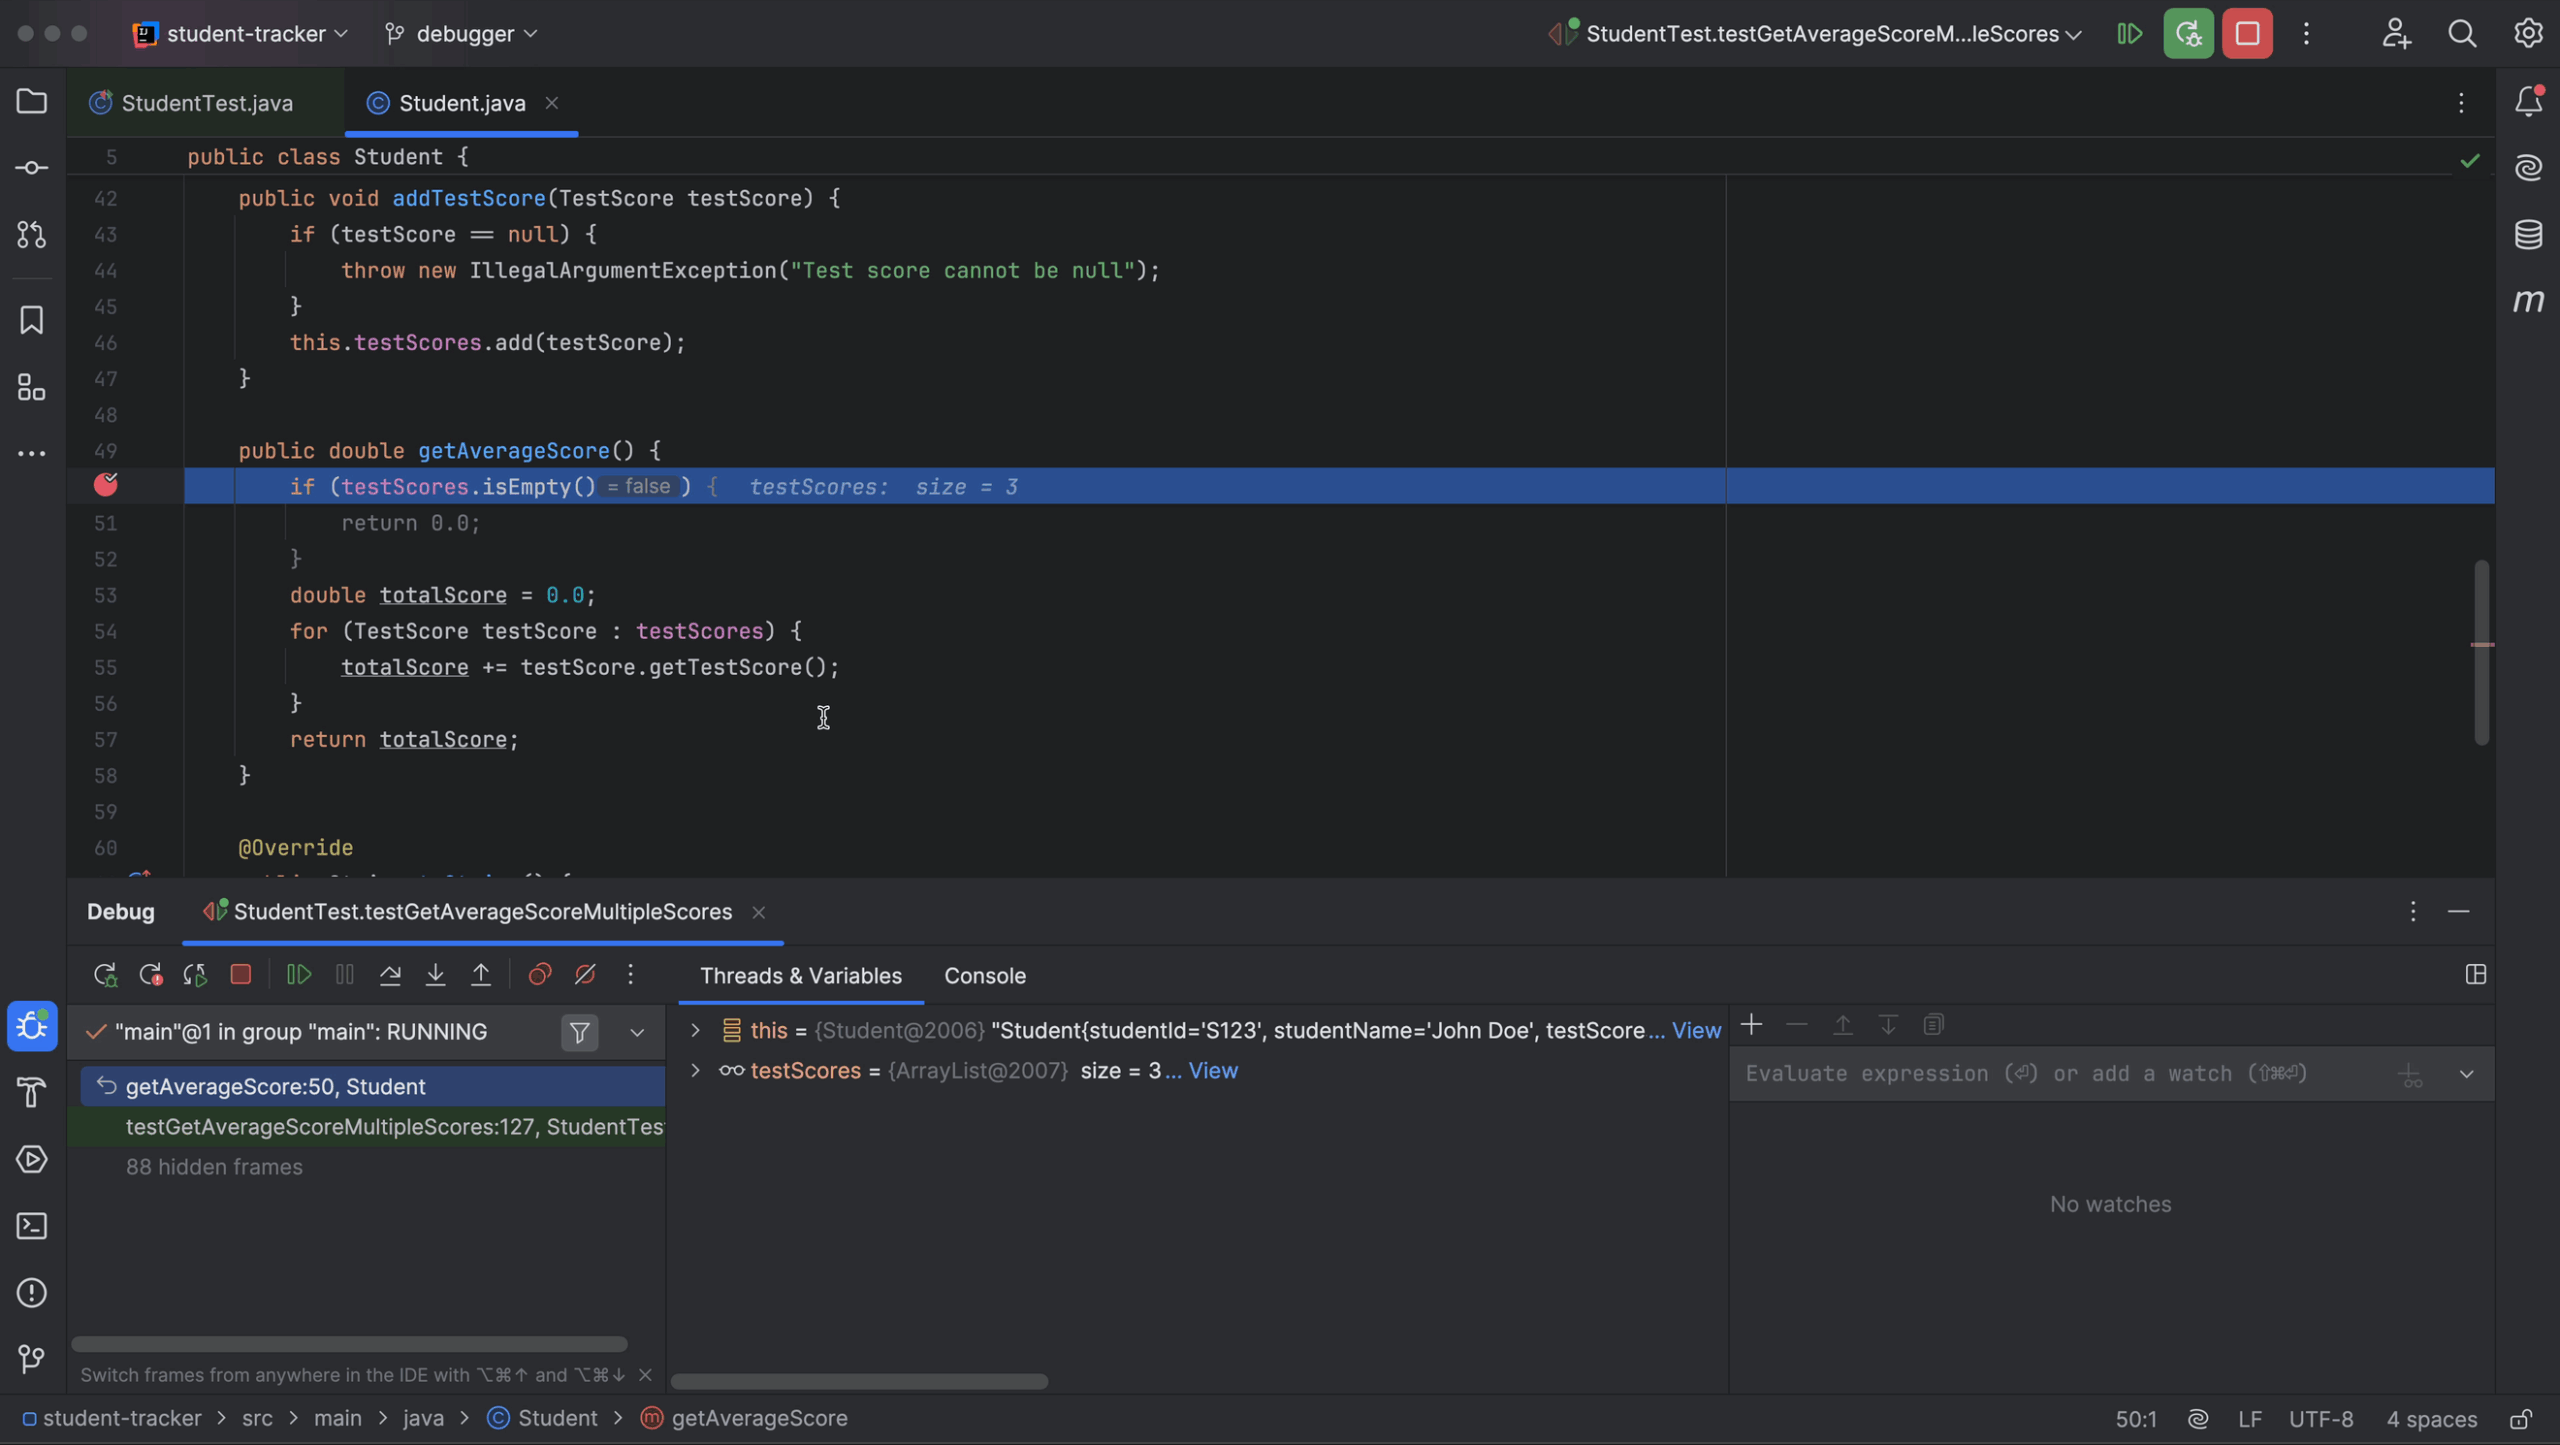
When we run the test in Debug mode (⌃D on macOS / Shift+F9 on Windows/Linux), execution will stop when it hits the breakpoint, so that we can look at the state of our application. We see inline debugging information in the editor.
Run in Debug mode
Here we see that the list of `testScores` has `size = 3`. We can even click in the editor to expand this list to see details of the values in the list. We also see that `testScores.isEmpty()` evaluates to `false`, and therefore the `return` statement inside that `if` statement is unreachable and greyed out.
In the Debug tool window (⌘5 on macOS / Alt+5 on Windows/Linux), we see the call stack (the methods that were called) on the left. We can also see information about objects and variables, like the student and their test scores, in this example.
Debug tool window
Stepping through the application
Now, we can step through the code to see what happens, using different step actions.
Use Step Over (F8) to step over a line and go to the next line, or use Step Into (F7) to step into a method that is called on a line. In this example, we can step into `getTestScore()` – which isn’t very interesting. When we step into a method, we can continue stepping to return to the call site once we exit the method, or use Step Out (Shift F8) to return right away. Notice that the variables and values that are shown inline and in the Debug tool window are updated as we step through the program.
Step through the program
Once all the scores have been added, we see that the` totalScore` is 25. And here, we see the problem with our logic: we forgot to divide by the number of test scores!
Evaluate expression
To fix our problem, we need to divide the total score by the number of test scores. To make sure our intended fix is correct, we can use Evaluate Expression. Right-click on `totalScore` in the editor to open the context menu and select Evaluate Expression. Alternatively, use the shortcut ⌥F8 on macOS / Alt+F8 on Windows/Linux.
Evaluate Expression
If we evaluate `totalScore`, we get 25.0, as we can already see in the debugger. However, we can use Evaluate Expression to evaluate other expressions, even ones not currently part of our code. Here we can try out potential solutions. For example, if we evaluate `totalScore / testScores.size()`, we get “8.333333333333334”, which is the expected average.
Evaluate Expression
Apply fix and rerun tests
Let’s apply our fix to the code to return `totalScore / testScores.size()` instead of `totalScore` from the method `getAverageScore()`. When we rerun the test, we see that it now passes. Note that you might want to run all tests to make sure that your fix has not had any unintended side effects.
Test passed
Since we no longer need the breakpoint, we can remove it, either by clicking the breakpoint in the gutter or by using the shortcut ⌘F8 on macOS / Ctrl+F8 on Windows/Linux.
Run the application
Now that we’ve fixed our failing test and all the tests pass, let’s see if our application works correctly. Go to the `Main` class and run it, for example, by clicking the Run button in the gutter.
Debug an Exception
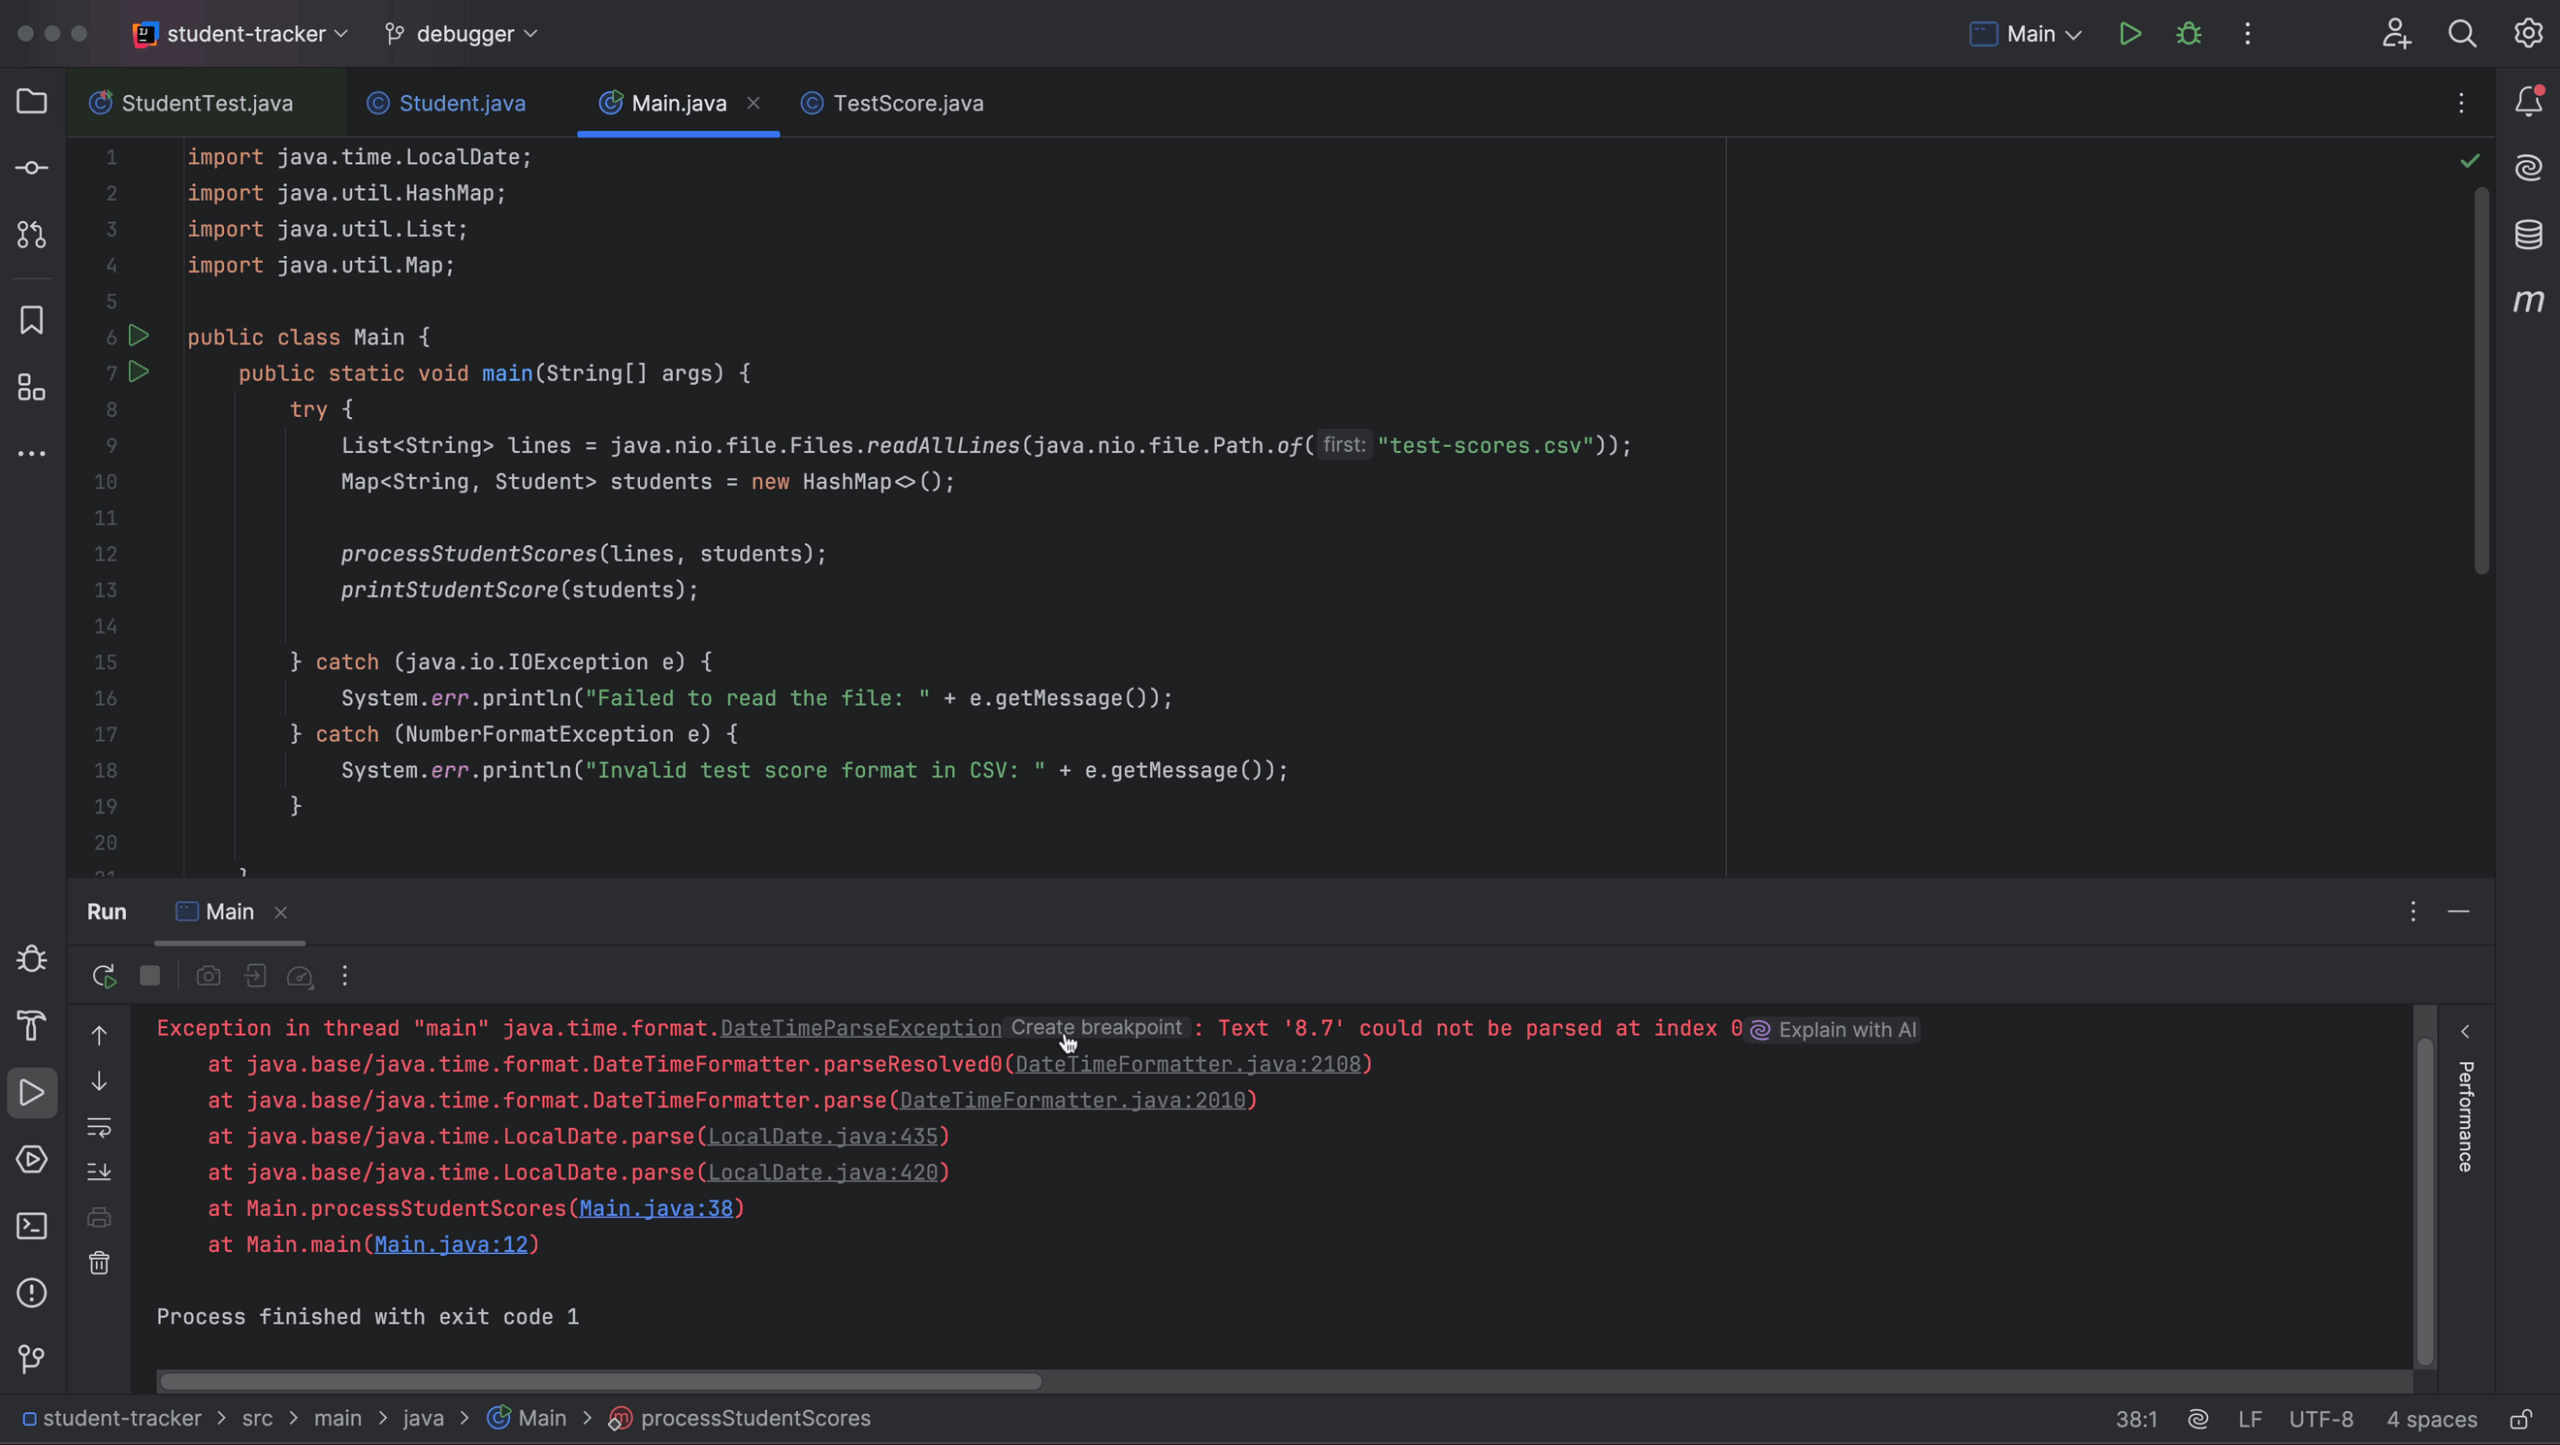
When we run the application, we see that there seems to be another problem! Our application throws a `DateTimeParseException`, with the message `Text ‘8.7’ could not be parsed at index 0`. Let’s use the debugger to find out what’s wrong.
DateTimeParseException
Note that we can create a breakpoint right from the console, by clicking the link Create breakpoint. This opens the Breakpoints dialog, where an Exception Breakpoint has been added for the `DateTimeParseException`.
Create Exception Breakpoint
Now, when we run our application in Debug mode, execution will stop when and where this exception is thrown, so we can figure out what caused it. Execution stops in the `DateTimeFormatter` class. When we expand the `Exception` in the Debug tool window, we see that the `detailMessage` is “Text “8.7” cannot be parsed as a `DateTime`”. That makes sense, as the number 8.7 does not represent a valid date.
Reset frame
To find out where the incorrect value comes from, we can go back in the call stack. The call stack is shown in the left pane of the Debug tool window. We see a round arrow in front of the last method that was called. When we hover over this arrow, we see the option to Reset Frame.
Reset Frame
We can use Reset Frame to go back to the previous frame. Let’s do so until we get to the point in our code where we try to parse this value into a date. We will need to drop several frames until we get back to our own code. We see that we try to parse a `LocalDate` on line 38 of our `Main` class.
Note that there are limitations to using Reset Frame; it only resets local variables, not static and instance variables. It also won’t undo any side effects of your application, like console output. While this is not relevant in the current example, you should be aware when you use Reset Frame in the future.
We are trying to parse a part of a line from our CSV file. Each line has been split into parts. To see all parts of the current line, click the View link next to the `parts` variable in the Debug tool window. Here we see that “8.7’ is actually a test score, as you might have guessed. We can also see that the line does contain a date, but it is in the next part of the line.
Reset Frame
As we can see in our code, we are parsing the same part of the line (`parts[3]`) twice! This looks like a copy-paste error! We should be parsing the part of the line that contains the date, which is `parts[4]`. Let’s fix that by changing line 38 to `var testDate = LocalDate.parse(parts[4]);`
Note that we could have also gone directly to this line in the code from the console, by clicking the link “Main.java:38” in the console. However, it is useful to know how to set a breakpoint for an exception in case you ever need it.
Go to line in code from console
Print to the console
In fact, while we’re here, let’s make sure that we are parsing all the parts of the lines correctly.
As we can see in the code just above (on line 25), our CSV file contains a header. Let’s print this header to the console to make sure we parse each part of the line to the correct field. We could add a `System.out.println()` to our code to print the header, but we don’t want to risk print statements ending up in production! Fortunately, there is a better way to do so.
Non-suspending logging breakpoint
Let’s create a non-suspending breakpoint, which means that execution will not stop on this breakpoint, and set it to log the line to the console when the breakpoint is hit.
To do so, create a breakpoint on line 27. Right-click the breakpoint and click More to open the Breakpoints dialog. Unselect Suspend to make this a non-suspending breakpoint. Next, select Log and Evaluate & log. Set the Evaluate & log field to `”Header: ” + line` and click Done. Notice that the breakpoint is yellow, to signify that this is a non-suspending breakpoint.
Non-suspending breakpoint
Now, when we run the application in Debug mode, we see that the header is printed to the console. But so are all the other lines from the file. To print only the header, the breakpoint should be on the next line. We could set a new breakpoint there, but then we’d have to redo the configuration…
Drag and drop breakpoint
Instead of creating a new breakpoint, we can drag and drop the existing breakpoint to the next line, preserving its configuration.
Drag and drop breakpoint
Now, when we run the application in Debug mode, only the header is printed to the console. Along with the output of our program, of course. It looks like our fields correspond correctly to the headers of the file.
Checking the functionality of the application
Let’s run our application again to see if everything is now as it should be. We see that the application runs without errors, but it looks like one of the students has a negative average test score.
Negative average score
That can’t be right! Let’s see what’s going on. We’ll set a breakpoint in the code where we add test scores to the student (line 45 in `Main.java`). When we run our application in Debug mode, execution will stop every time this breakpoint is hit. We can click the Resume Program button (⌥⌘R on macOS / F9 on Windows/Linux), either in the Debug tool window, or inline in the editor, to get to the next test score.
Resume program
Every time we click the Resume Program button, we can see the values change both in the inline debugging information in the editor and in the Debug tool window. Execution will stop every time it hits this breakpoint, so for every test score. Since there are a lot of test scores in the file, this is going to take a while…
Resume program
Conditional breakpoint
As we are only interested in the test scores for a particular student, we don’t need execution to stop for each test score. Instead of clicking the Resume Program button many times in a row to get to the scores we’re interested in, we can use a conditional breakpoint – which will only halt execution under certain conditions.
Right-click the breakpoint to open the Line Breakpoint dialog and edit the configuration for the breakpoint. Since we don’t need execution to suspend until we process this particular student’s test scores, we can set the field Condition to `studentName.equals(“Olivia Garcia”)` and click Done.
Conditional breakpoint
Notice that the breakpoint has a small question mark in it, to signify that it is a conditional breakpoint. Now, when we resume our program, execution will stop only once we get to the test scores for the student whose name we have set in the condition. Here we can see that the test score is negative.
Negative test score
Add watch
To see whether all test scores for this student are negative, let’s add a watch to the field `testScore`. Adding a watch makes it easier to explicitly watch the value of a field. Right-click on the variable `testScore` in the Threads & Variables tab in the Debug tool window and select Add to watches from the context menu. The watch will be shown in the right pane of the Debug tool window.
Add to Watches
If needed, select the Layout Settings icon at the top right of the Debug tool window and select Watches in the list, to show watches in the right pane.
Add Watches to Debug tool window
When we click Resume Program and loop over this student’s scores, we see that all her scores are negative. That would explain her negative average…
This looks like a problem with the input data. Let’s open the CSV file to correct the scores and make sure Olivia’s scores are no longer negative. We can use multiple carets to fix all scores at the same time.
In this example, we can fix our input data ourselves. If you are dealing with user input that you can’t change, consider adding validation to the code, for example, that test scores cannot be negative.
Final check
Let’s run our application one more time to see that everything is in order. We see that average scores are printed to the console for all students, and none of the scores are negative. This is how our application is expected to work.
Final check
Conclusion
In this blog post, we’ve seen how to use the debugger to find and fix several types of bugs, from problems with the logic in the code, to reasons that exceptions are thrown, and finding problems with input data.
Is there anything else you’d like to learn about the debugger? Please tell us in the comments!
This article was first published in NLJUG‘s Java Magazine. You can view an online copy here.
As developers, we read code more than we write it. Research has shown that “developers on average spend as much as 58% of their time comprehending existing source code” (The Programmer’s Brain – Felienne Hermans). And yet, we don’t practice reading code nearly as much as we do writing code. Let’s look at how to practice reading code and how IntelliJ IDEA can help.
Code Reading Club
In 2022, a friend invited me to join a Code Reading Club, based on the work of Felienne Hermans. We have monthly sessions where we take a sample of code and apply structured exercises to this code to try and make sense of it. I have really enjoyed our sessions, not only for the opportunity to practice reading code, but also because I find it very interesting to learn how other people read code. To start your own club, use the Code Reading Club resources. Or try the code reading exercises from Felienne’s book, The Programmer’s Brain.
While it’s possible to use these exercises in our daily work, developers mostly read code in the IDE.
Exploring an existing code base
When joining a new team or company, you need to quickly get up to speed with existing code bases. Obviously you can look at the project, but unfortunately not everything can be captured in the code.
It helps to have a teammate give an introduction to the application; a description of what the application does, its place in the landscape, relevant history and design choices, current plans (are you actively developing new features or mostly doing maintenance?), which parts of the application are changed more than others, as well as links to existing documentation and other relevant information. Also think about which stories a new team member can pick up to help them become familiar with the project.
As a new team member, check out all relevant repositories. Make sure you can build the project, run the tests and run the application locally. How to do this will hopefully be described in the README. If not, consider adding it. Running the project locally can help you to both see how the application works by trying it out, and make sure that you can test your changes when you are done.
Opening a project in the IDE allows you to search and navigate your codebase more easily, as well as use additional useful IDE features. Let’s dive into several powerful IntelliJ IDEA features you can use to quickly be productive.
Note: Keyboard shortcuts are provided for macOS and Windows/Linux respectively.
Project overview
Explore modules and packages in the Project tool window (⌘1 | Alt+1) to get an idea of the project. If you prefer a visual representation, IntelliJ IDEA can generate several types of diagrams for you, including UML class diagrams. Also consider drawing your own diagrams; this will help you retain the information better and lets you focus only on the information you need for the task at hand.
To understand dependencies between modules, packages and classes, the Dependency Structure Matrix (DSM) can help. Open the DSM from the main menu using Code | Analyze Code | Dependency Matrix….
Dependency Structure Matrix
In this example the matrix displays modules in a project. As you can see in the legend at the top right, dependencies are marked in blue and the direction of the dependencies is marked in green and yellow; the module marked in green depends on the module marked in yellow. Visualising the dependencies can help us to get an overview of the application. If you prefer, you can also generate a Project Modules diagram. Note that this diagram only gives you one side of the equation (which modules the selected module depends on).
Search & navigate
Use Search Everywhere (⇧⇧ | Shift+Shift) to find anything in your project, including IDE settings & features. Other useful navigation features include Recent Files (⌘E | Ctrl+E) or Recent Locations (⌘⇧E | Ctrl+Shift+E). Knowing how to search and navigate code in your IDE is helpful when working with existing code, so you can focus on the task at hand.
Looking at a slice of the application
Instead of looking at the whole code base, look at a specific slice of the application. For example, find the main method and see what the application does from there, find a specific endpoint and trace the code down to the database, or find the location where an error is thrown and trace the code back up to how you got there.
Understanding a piece of code
At some point you’ll find a piece of code that you will need to understand, for example, to fix a bug or make necessary changes. If you’ve ever been overwhelmed by a piece of code without any idea how to start, this is where code reading exercises can help! Of course, your IDE can also provide you with handy features. For starters, IntelliJ IDEA provides you with hints about the code, like syntax highlighting, inlay hints and gutter icons.
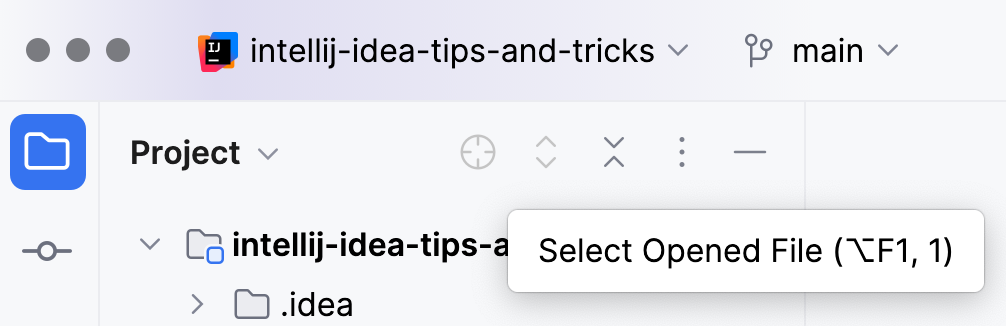
One of the reasons code can be confusing is because of a lack of information. For example, you might not know the exact implementation of a class or method. While you can Jump to Source (⌘↓ | F4) to navigate to the relevant code, and use shortcuts to Navigate Back (⌘[ | Ctrl+Alt+Left Arrow) and Navigate Forward (⌘] | Ctrl+Alt+Right Arrow), it’s easy to get lost in a large code base. To see where a particular file is located in the project, use the crosshair icon at the top of the Project tool window.
Select Opened File
It is also possible to pull up additional information using Quick Documentation (F1 | Ctrl+Q) to show the Javadoc, Quick Definition (⌥␣ | Ctrl+Shift+I) to see the code or Type Information (⌃⇧P | Ctrl+Shift+P) to determine which type is returned by an expression.
Did you know IntelliJ IDEA can help you work with regular expressions? You can mark a String as RegExp from Show Context Actions (⌥⏎ | Alt+Enter), using Inject Language or Reference and selecting RegExp (or a specific flavor of regular expressions). From the Show Context Action menu, select Check RegExp to open a popup where you can check whether a certain String matches the regular expression. Place your String in the Sample field in the popup; a yellow warning sign will be shown if the String is incomplete, a red exclamation mark shows the String does not match, or a green check mark will indicate that the String matches the RegExp.
Check RegExp
The structure of the code
Code is not read from top to bottom. Code doesn’t run linearly either! Developers “scan” code looking for the parts you’re interested in. Using white space and formatting can help improve readability.
When you write code in IntelliJ IDEA, the code will be formatted automatically. If you encounter code that isn’t properly formatted, you can reformat it (⌘⌥L | Ctrl+Alt+L).
You can collapse the code (⌘⇧- | Ctrl+Shift+Minus) to get an overview of a class without being overwhelmed with too many details. You can expand it again (⌘⇧+ | Ctrl+Shift+Plus) as needed. Other ways to get a quick overview of the code are to use the File Structure popup (⌘F12 | Ctrl+F12), or the Structure tool window (⌘7 | Alt+7).
When reading code, it might help to play with it a little bit as you try to understand it. Remember to revert any changes you make!
Restructure
Restructure the code by moving code blocks around to match your mental model, preferred style or coding conventions. Use shortcuts to move a statement up (⌘⇧↑ | Ctrl+Shift+Up Arrow) or down (⌘⇧↓ | Ctrl+Shift+Down Arrow).
Refactoring
You can use refactoring to change the code to aid your understanding. Rename variables or methods (⇧F6 | Shift+F6), extract variables (⌥⌘V | Ctrl+Alt+V) or extract methods (⌥⌘M | Ctrl+Alt+M) and give them meaningful names, inline variables (⌥⌘N | Ctrl+Alt+N) you don’t need. The most frequently used refactorings are available in the Refactor This menu (^T | Ctrl+Alt+Shift+T) . Additional refactorings or quick fixes might be available under Show Context Actions (⌥⏎ | Alt+Enter).
Testing
Look at the tests for a piece of code to see what this code is supposed to do, using Navigate to Tests (⌘⇧T | Ctrl+Shift+T). Hopefully names of the tests will express the intended behavior of the application. This is useful for two reasons: 1. The tests will serve as executable documentation of the system. 2. Should the tests fail in the future, good names can help to quickly tell you what’s wrong, so you don’t spend more time than necessary analyzing failures.
Debugging
Run code through the debugger to see if the actual behavior of the code matches your understanding. Place a breakpoint (⌘F8 | Ctrl+F8) in the code at the point where you want to observe its state. Run the test in debug mode (⌃D | Shift+F9); execution will halt when it hits the breakpoint. You can observe the state of objects & variables in the editor and in the debug window, and look at the call stack in the Debug tool window. Continue execution by either stepping into a method (F7) or stepping over a line (F8).
The IntelliJ IDEA debugger is very powerful and has many useful features. I highly recommend familiarizing yourself with its features; this will come in handy next time you need to urgently debug your code for a production incident!
Version control
Sometimes you might want to know how the code came to be the way it is, and do a bit of what I like to call “Git archeology”. Use Annotate with Git Blame to see when the code was last changed. Click the commit in the gutter to navigate to that commit in the Git tool window and look at the diff. If you’re using JetBrains AI Assistant [13], you can also ask it to explain the commit to you. Right-click the commit and select Explain Commit with AI Assistant from the context menu.
Explain Commit with AI Assistant
AI Assistant features to understand code
Finally, AI coding assistants, like JetBrains AI Assistant, may offer other useful features for understanding existing code. For example, chat with an AI Assistant and ask questions about software development, your project’s code and version control. Ask it to explain specific code to you, maybe even explain regular expressions, SQL queries, cron expressions, etc.
Because it is deeply integrated within IntelliJ IDEA, JetBrains AI Assistant can explain runtime errors right from the console. With another assistant you may need to copy-paste the error into a chat window. Alternatively, use an AI assistant to write documentation for a class or method. The generated Javadoc is often more concise than the explanation in the chat.
Conclusion
I hope you found this overview useful to see how to approach understanding existing code with the help of IntelliJ IDEA. This article is based on my talk “Reading Code”, which includes live demos of the features discussed in this article.
Discover 7 powerful ways to supercharge your version control with JetBrains AI Assistant!
From resolving tricky merge conflicts to generating precise commit messages, AI Assistant offers tools that can save you time and boost your productivity. Learn how to ask questions about your project’s version control history, review local changes, and even customize commit prompts to fit your style. Whether you’re dealing with complex git commands or want help revisiting old commits, JetBrains AI Assistant has you covered.
Watch now to explore how you can transform your version control experience!
Struggling to understand complex code? JetBrains AI Assistant is here to help!
In this video, we walk you through practical examples of how the AI Assistant simplifies code comprehension. From summarizing projects and explaining classes to clarifying regex and runtime errors, this tool enhances your productivity and understanding. You’ll also learn how to use natural language queries, write concise documentation, and even dig into commit history with ease.
Whether you’re dealing with unfamiliar code or just need quick insights, JetBrains AI Assistant has you covered!
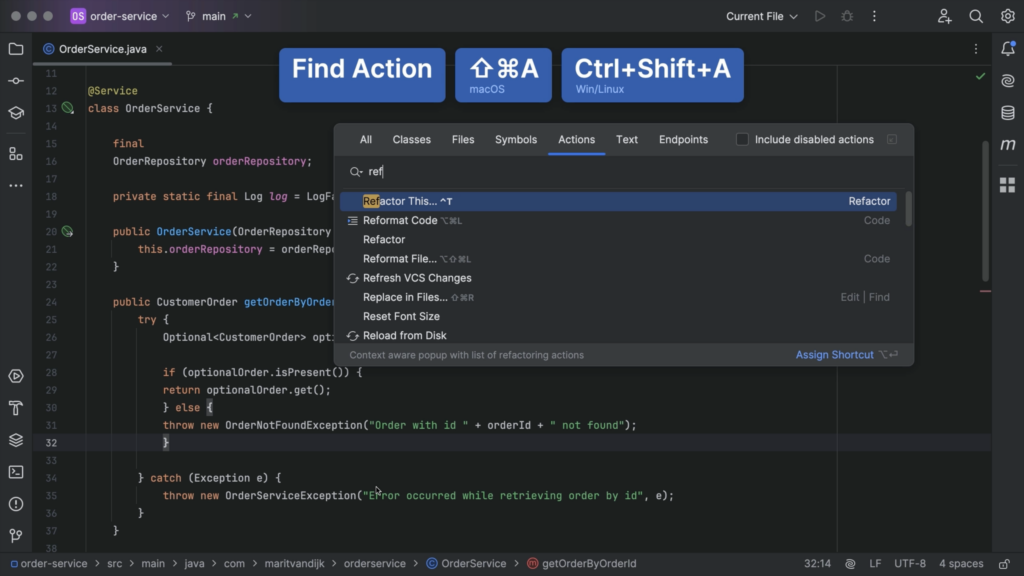
You want to perform an action in IntelliJ IDEA, like reformatting your code, but don’t remember the shortcut. To find any action in IntelliJ IDEA, there is only one shortcut you need: Find Action! Press ⇧⌘A (on macOS) or Control+Shift+A (on Windows/Linux) to open the Find Action dialog.
Find Action
Next, search for the action you want to perform. Type as much as needed until the relevant action shows up in the list. Notice that the shortcuts for actions are also shown if there is one available. For example, we see that the shortcut for Reformat File is ⌘⌥L (on macOS) or Ctrl+Alt+L (on Windows/Linux). Where relevant, the menu option is also shown. Use arrow keys to navigate the list, and enter to select the desired option.
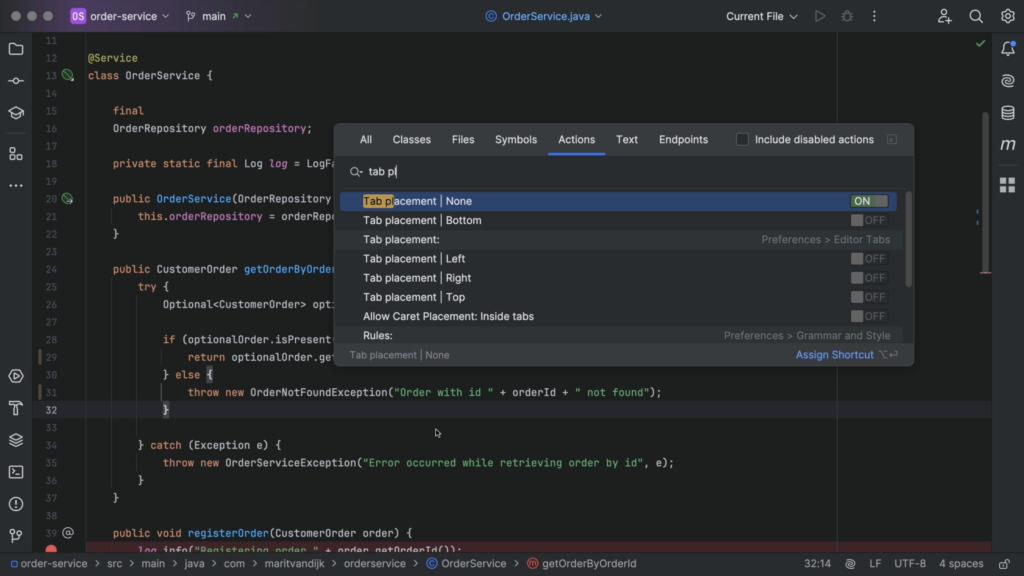
We can also find and change settings in the Find Action popup. For example, let’s look for “tab placement.” Press enter on a selected setting to toggle it on or off. For example, set Tab Placement to None to turn off tabs, without having to open the Settings menu.
Tab Placement – None
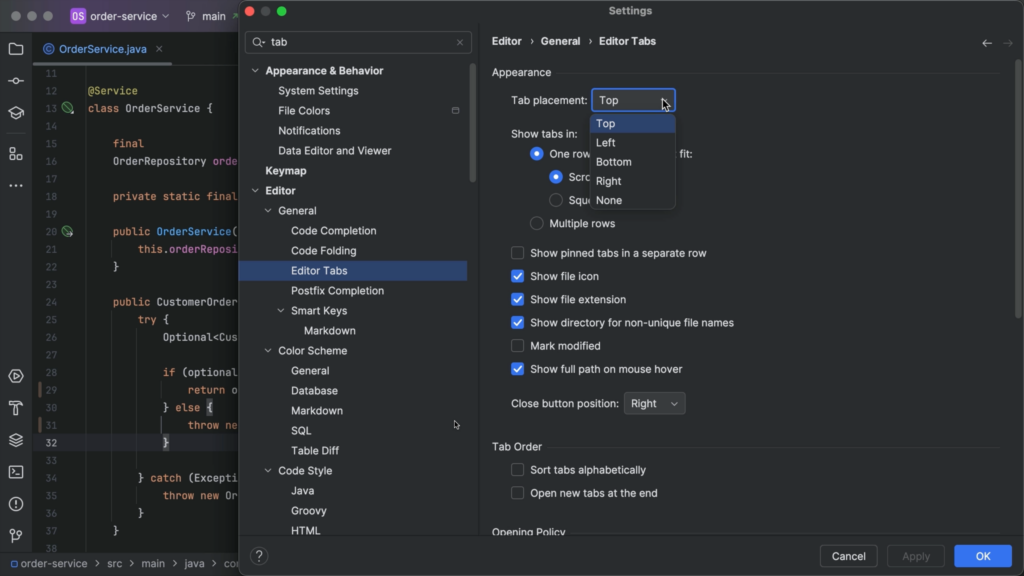
We can still open the Settings menu directly using the shortcut ⌘, (on macOS) or Ctrl+Alt+S (on Windows/Linux) if we want to. To quickly find the right settings, we can search for tab placement. Turn tabs back on by selecting Tab placement: Top (or Left, Bottom or Right, if you prefer any of those locations), and we can set a other related settings here.
Settings – Tab Placement
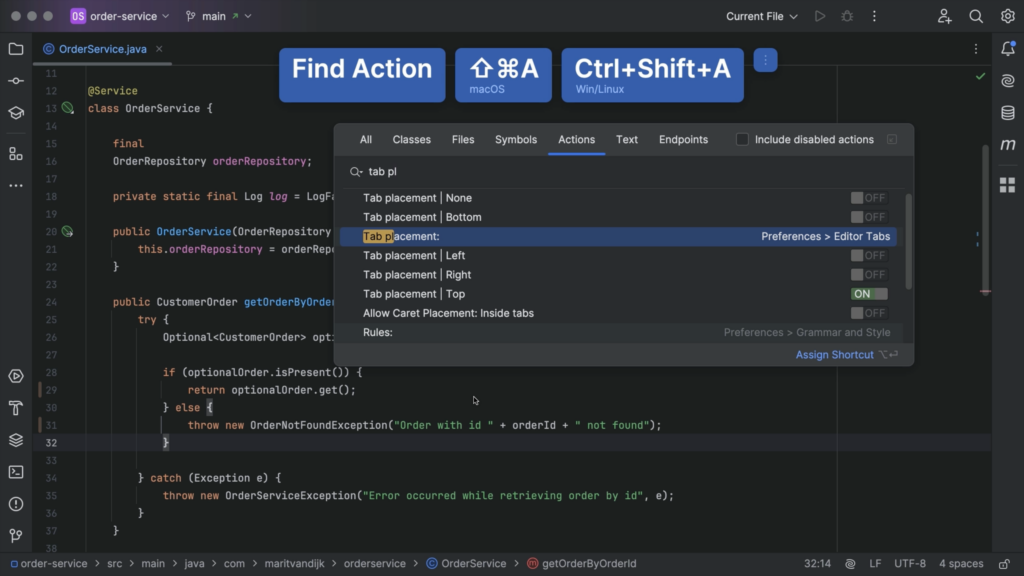
But we can open Settings from Find Action too. We can even go directly to specific settings, like those for tab placement.
Find Action – Tab Placement Settings
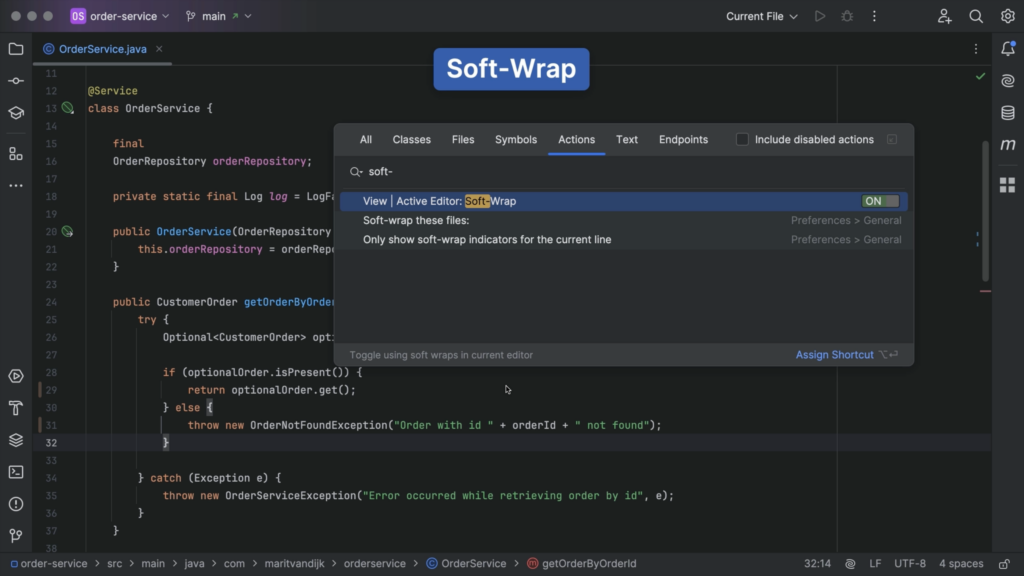
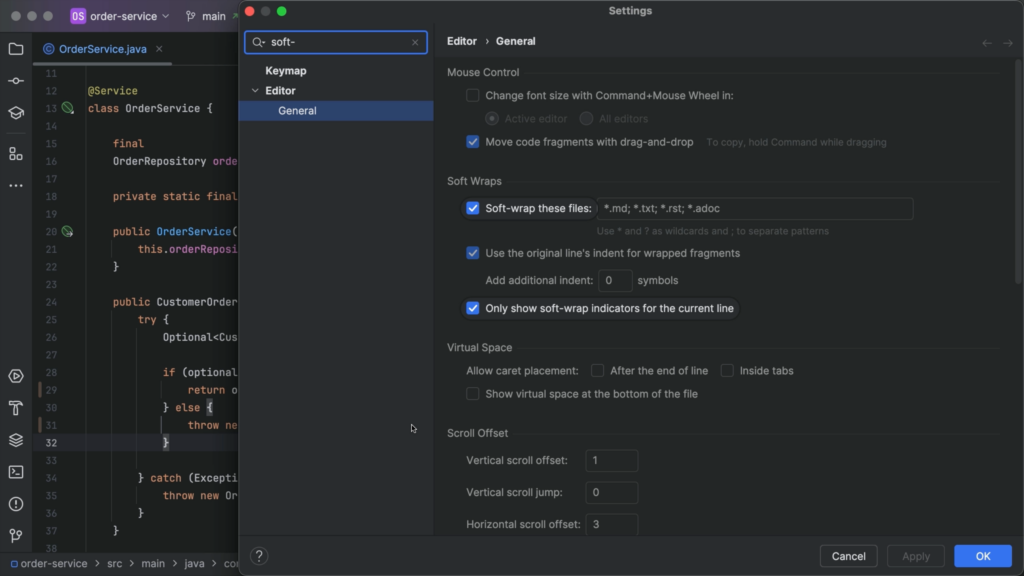
This can be useful because not all settings can be toggled. For example, we can search for “soft-wrap” to toggle it on or off, but if we want to specify which file types to soft-wrap, we can do so in the Settings.
Find Action – Soft-wrapSettings – Soft-wrap
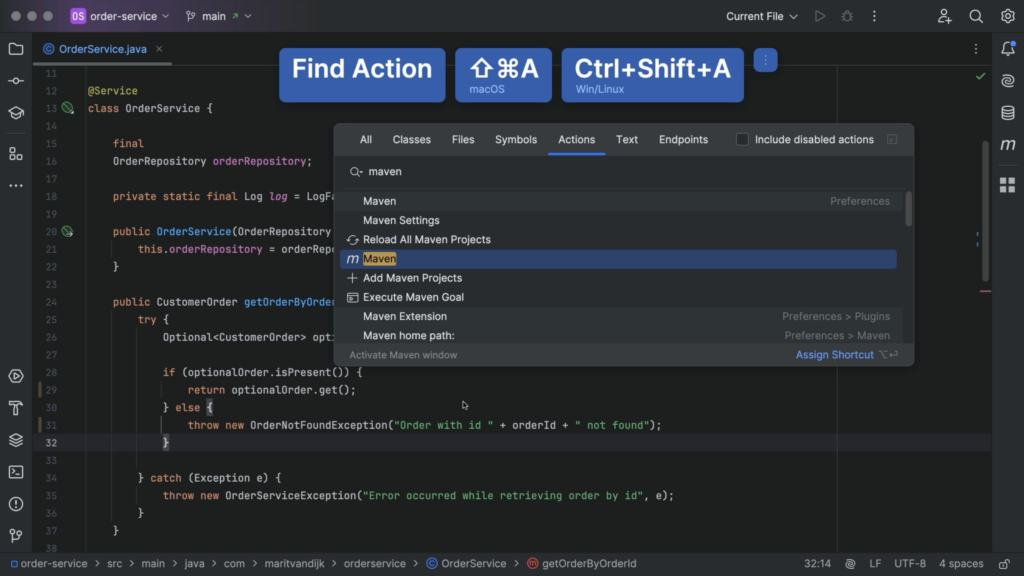
Finally, we can open windows using Find Action, for example the Maven window. In this example, searching for “Maven” gives us multiple results. If we’re unsure which one we need, we can look at the description of the action shown in the bottom of the Find Action dialog.
Find Action – Maven
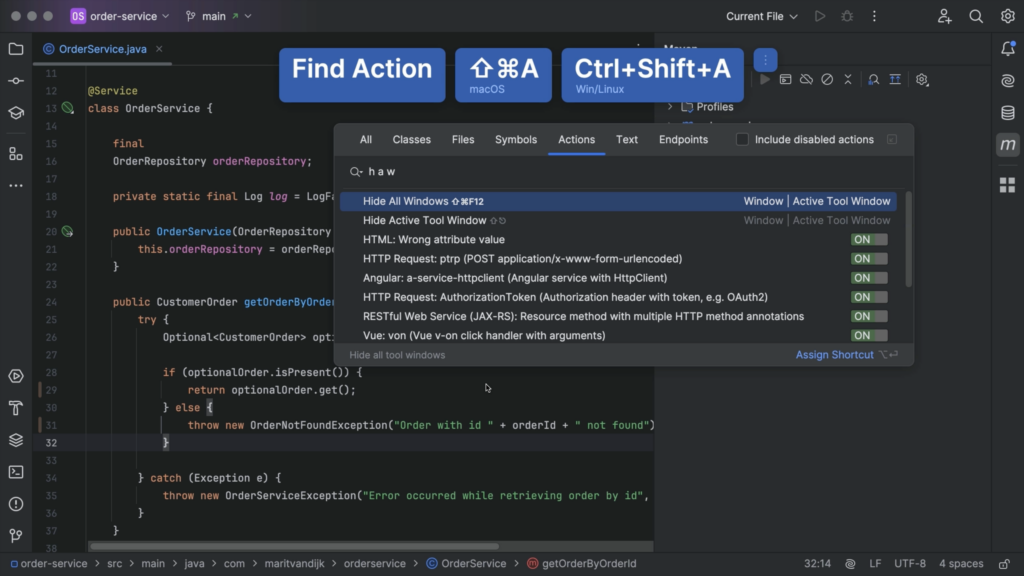
We can also hide all tool windows again. Use speed typing to find options faster by typing just one, or a few letters of each word. For example, typing “h a w” finds the option to Hide All Windows. This is especially useful if you know the name of the action you’re trying to find. But don’t worry if you don’t! You can still find the action you want by looking for any part of the name. For example, by searching for “window” to find the option to Hide All Windows, or Hide Active Window.
Find Action – Speed typing
Now you have all actions in IntelliJ IDEA at your fingertips. Use Find Action to find any action.
Used to determine whether a user is included in an A / B or Multivariate test.
18 months
_ga
ID used to identify users
2 years
_gali
Used by Google Analytics to determine which links on a page are being clicked
30 seconds
_ga_
ID used to identify users
2 years
_gid
ID used to identify users for 24 hours after last activity
24 hours
_gat
Used to monitor number of Google Analytics server requests when using Google Tag Manager
1 minute
_gac_
Contains information related to marketing campaigns of the user. These are shared with Google AdWords / Google Ads when the Google Ads and Google Analytics accounts are linked together.
90 days
__utma
ID used to identify users and sessions
2 years after last activity
__utmt
Used to monitor number of Google Analytics server requests
10 minutes
__utmb
Used to distinguish new sessions and visits. This cookie is set when the GA.js javascript library is loaded and there is no existing __utmb cookie. The cookie is updated every time data is sent to the Google Analytics server.
30 minutes after last activity
__utmc
Used only with old Urchin versions of Google Analytics and not with GA.js. Was used to distinguish between new sessions and visits at the end of a session.
End of session (browser)
__utmz
Contains information about the traffic source or campaign that directed user to the website. The cookie is set when the GA.js javascript is loaded and updated when data is sent to the Google Anaytics server
6 months after last activity
__utmv
Contains custom information set by the web developer via the _setCustomVar method in Google Analytics. This cookie is updated every time new data is sent to the Google Analytics server.